| Param | Original file | Final file |
|---|---|---|
| Filename | modeM0/AS1A09_120T02_9000003904_27066cztM0_level2.evt | modeM0/AS1A09_120T02_9000003904_27066cztM0_level2_quad_clean.evt |
| Size (bytes) | 637,513,920 | 84,640,320 |
| Size | 608.0 MB | 80.7 MB |
| Events in quadrant A | 4,008,696 | 545,820 |
| Events in quadrant B | 7,713,495 | 517,557 |
| Events in quadrant C | 3,528,647 | 538,838 |
| Events in quadrant D | 3,634,558 | 525,440 |
| Mode M9 | |||
|---|---|---|---|
| Quadrant | BADHDUFLAG | Total packets | Discarded packets |
| A | 0 | 12 | 0 |
| B | 0 | 12 | 0 |
| C | 0 | 12 | 0 |
| D | 0 | 12 | 0 |
| Mode M0 | |||
|---|---|---|---|
| Quadrant | BADHDUFLAG | Total packets | Discarded packets |
| A | 0 | 16102 | 0 |
| B | 0 | 27205 | 0 |
| C | 0 | 14442 | 0 |
| D | 0 | 14836 | 0 |
| Quadrant | Total seconds | Saturated seconds | Saturation percentage |
|---|---|---|---|
| A | 6236 | 111 | 1.779987% |
| B | 6237 | 1836 | 29.437229% |
| C | 6237 | 116 | 1.859869% |
| D | 6237 | 83 | 1.330768% |
Noise dominated data is calculated using 1-second bins in cleaned event files. If a bin has >2000 counts, and if more than 50% of those come from <1% of pixels, then it is considered to be noise-dominated and hence unusable.
| Quadrant | # 1 sec bins | Bins with >0 counts | Bins with >2000 counts | High rate bins dominated by noise | Noise dominated (total time) | Noise dominated (detector-on time) | Marked lightcurve |
|---|---|---|---|---|---|---|---|
| A | 7476 | 6237 | 29 | 29 | 0.39% | 0.46% | 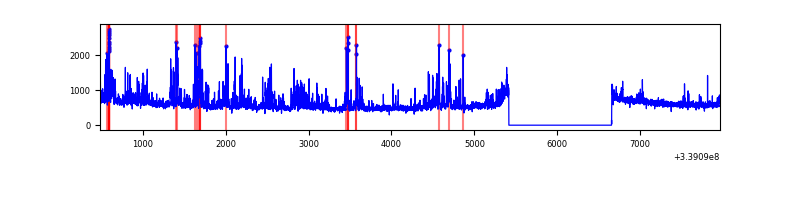 |
| B | 7477 | 6238 | 1534 | 1534 | 20.52% | 24.59% | 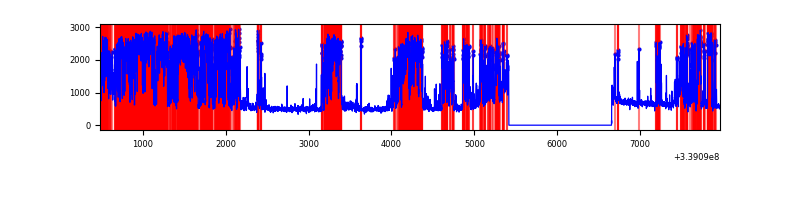 |
| C | 7477 | 6238 | 2 | 2 | 0.03% | 0.03% | 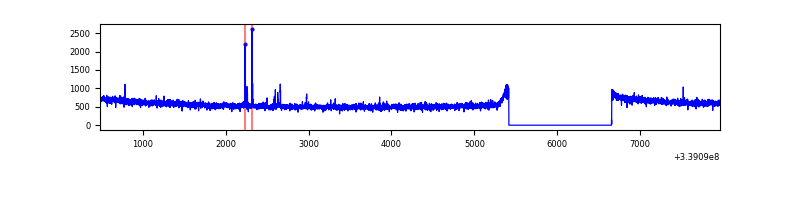 |
| D | 7477 | 6238 | 34 | 34 | 0.45% | 0.55% | 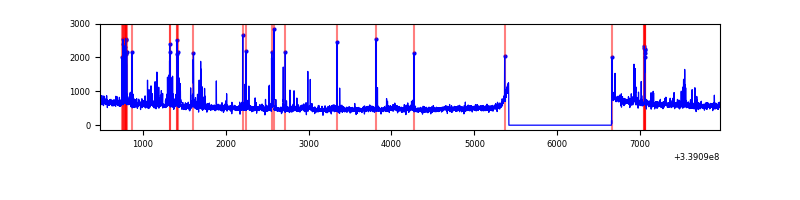 |
Top three noisy pixels from each quadrant. If the there are fewer than three noisy pixels in the level2.evt file, extra rows are filled as -1
| Pixel properties | Quadrant properties | ||||||
|---|---|---|---|---|---|---|---|
| Quadrant | DetID | PixID | Counts | Sigma | Mean | Median | Sigma |
| A | 14 | 235 | 433911 | 2484.07 | 878 | 865 | 174.3 |
| A | 6 | 16 | 180133 | 1028.33 | 878 | 865 | 174.3 |
| A | 13 | 254 | 10753 | 56.72 | 878 | 865 | 174.3 |
| B | 0 | 189 | 4645649 | 31832.19 | 780 | 764 | 145.9 |
| B | 12 | 111 | 16226 | 105.96 | 780 | 764 | 145.9 |
| B | 11 | 111 | 14914 | 96.97 | 780 | 764 | 145.9 |
| C | 14 | 238 | 140138 | 693.65 | 863 | 873 | 200.8 |
| C | 15 | 208 | 22098 | 105.72 | 863 | 873 | 200.8 |
| C | 13 | 61 | 6154 | 26.3 | 863 | 873 | 200.8 |
| D | 2 | 250 | 169874 | 833.56 | 865 | 848 | 202.8 |
| D | 1 | 52 | 107453 | 525.73 | 865 | 848 | 202.8 |
| D | 8 | 195 | 43528 | 210.48 | 865 | 848 | 202.8 |
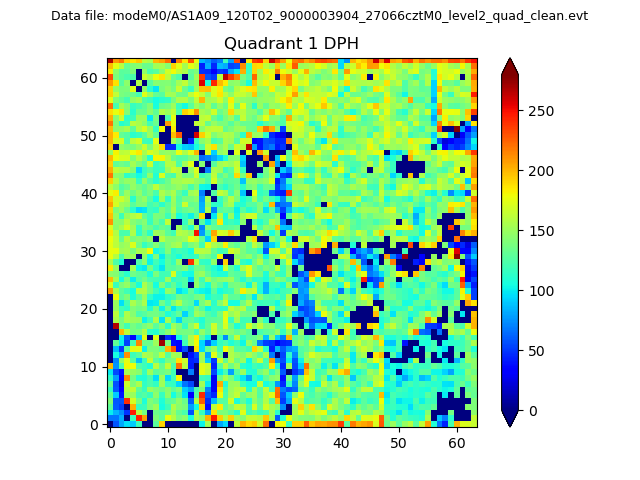
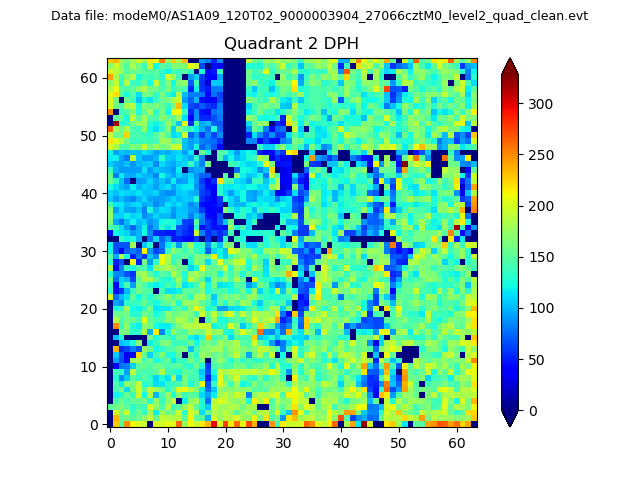
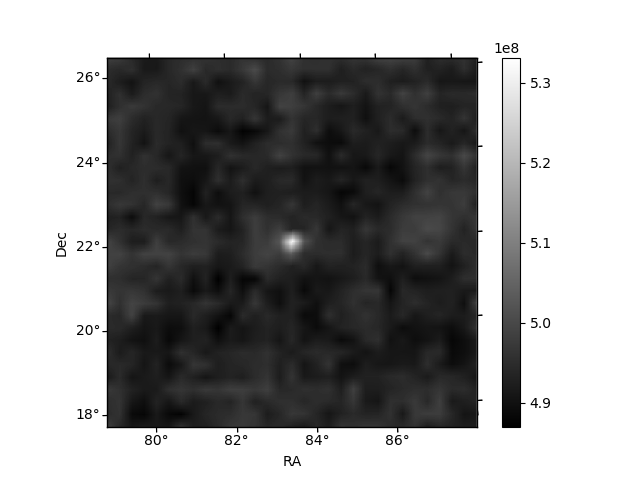
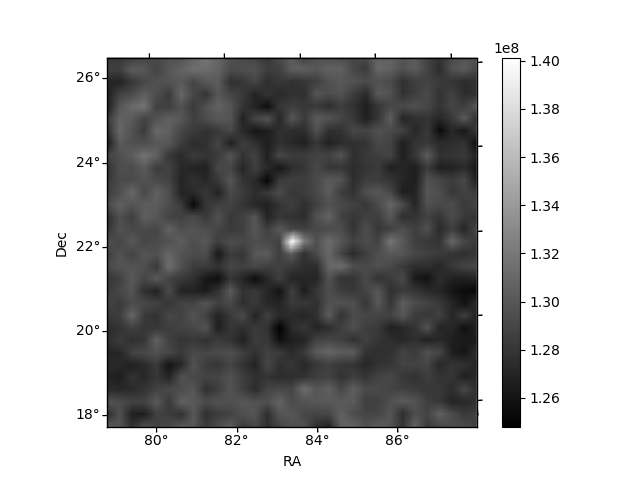
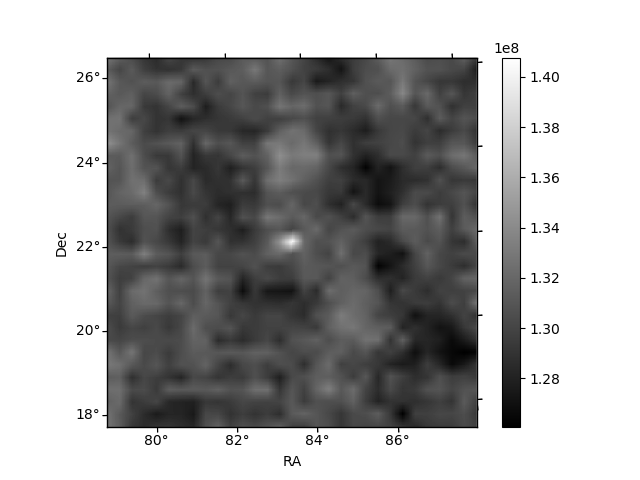
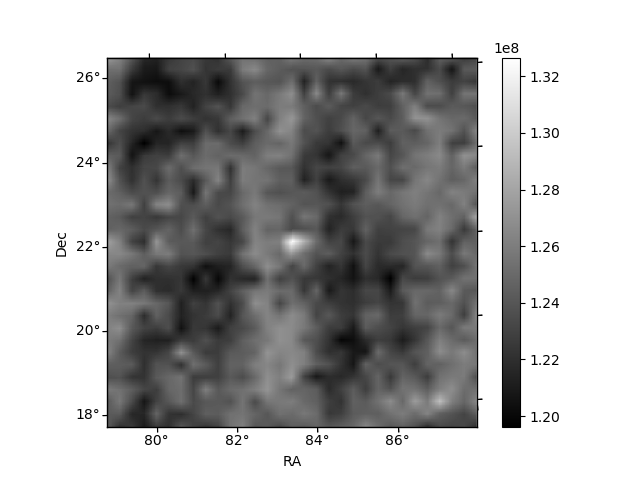
Histogram calculated using DETX and DETY for each event in the final _common_clean file
| Quadrant A |  |
 |
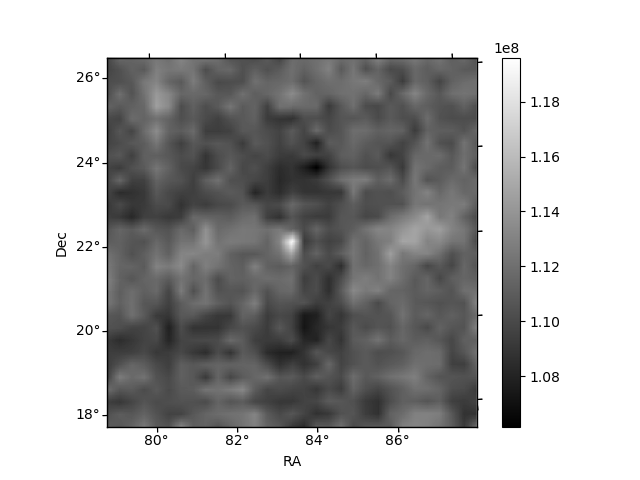
Quadrant B |
|---|---|---|---|
| Quadrant D | 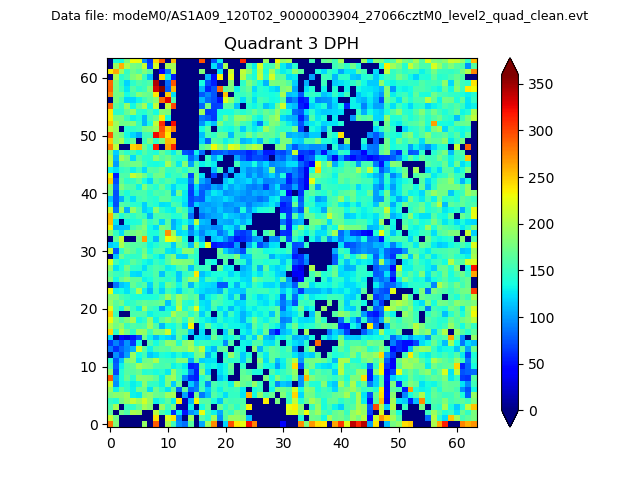 |
 |
Quadrant C |
| Plot type | Count rate plots | Images |
|---|---|---|
| Comparison with Poisson distribution Blue bars denote a histogram of data divided into 1 sec bins. Red curve is a Poisson curve with rate = median count rate of data. |
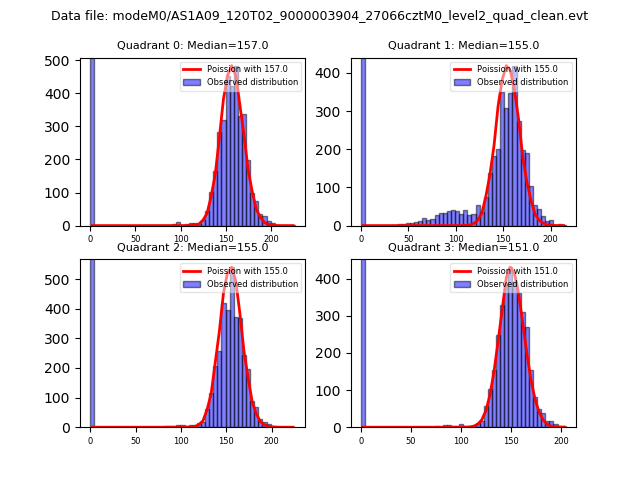 |
 |
| Quadrant-wise count rates Data is divided into 100 sec bins |
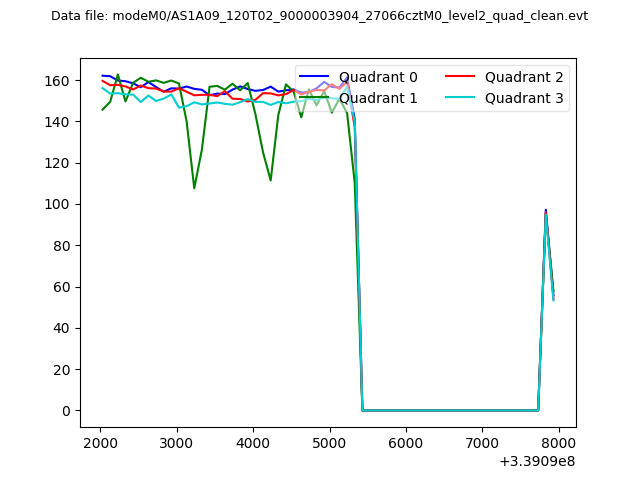 |
|
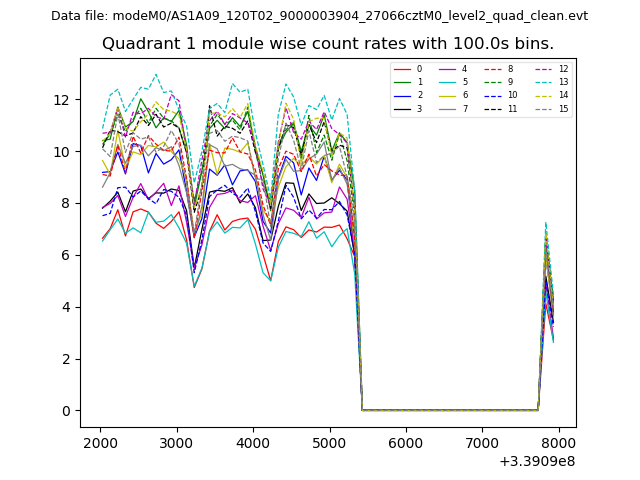
| Module-wise count rates for Quadrant A Data is divided into 100 sec bins |
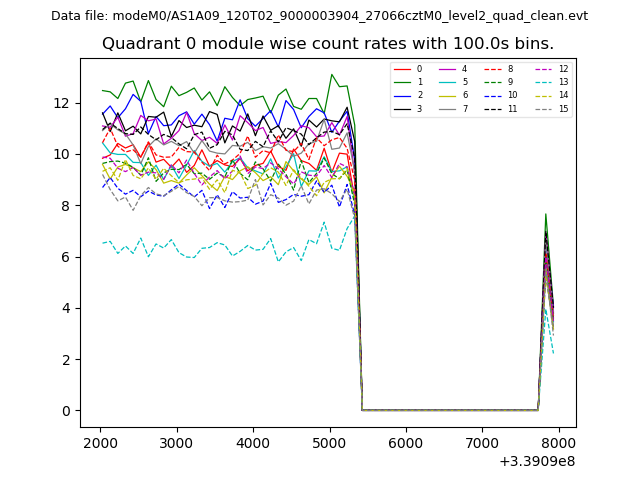 |
 |
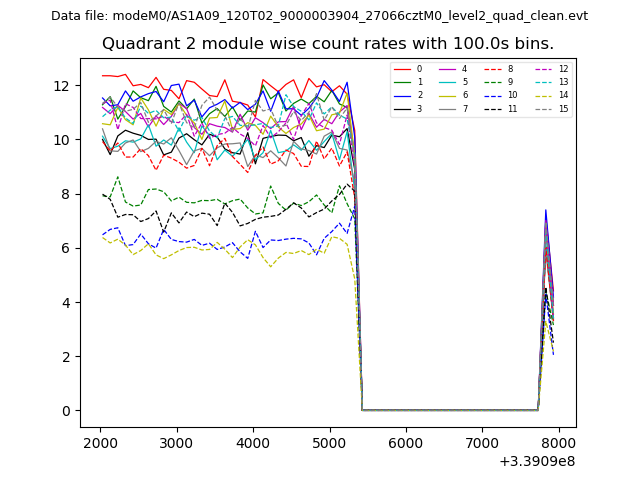
| Module-wise count rates for Quadrant B Data is divided into 100 sec bins |
 |
 |
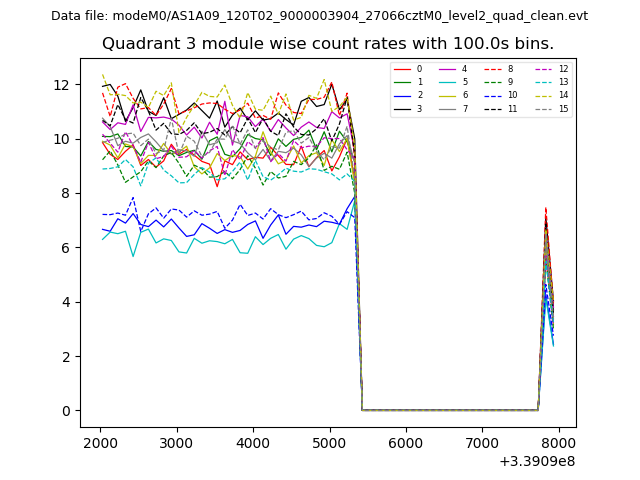
| Module-wise count rates for Quadrant C Data is divided into 100 sec bins |
 |
 |
| Module-wise count rates for Quadrant D Data is divided into 100 sec bins |
 |
 |
| Parameter | Plot |
|---|---|
| CZT HV Monitor | 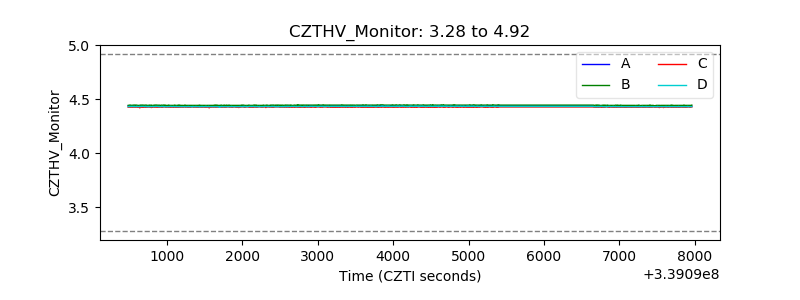 |
| D_VDD | 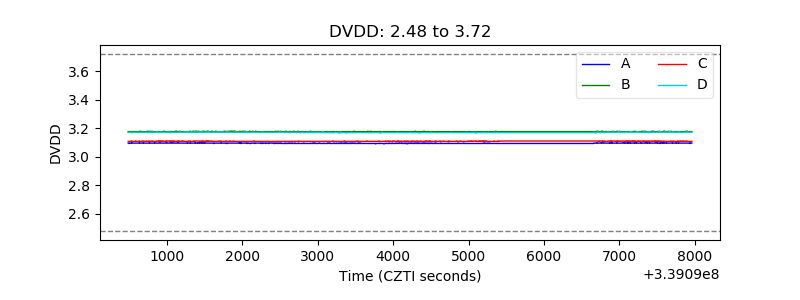 |
| Temperature 1 | 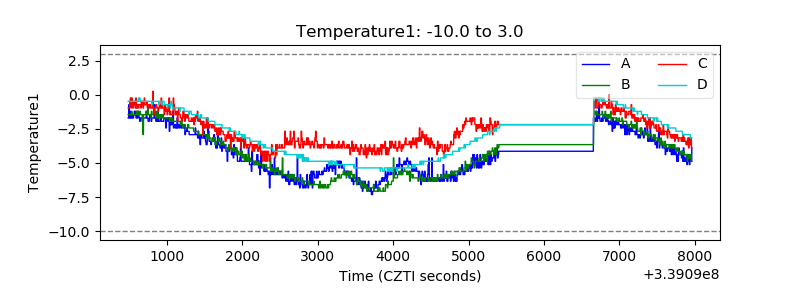 |
| Veto HV Monitor | 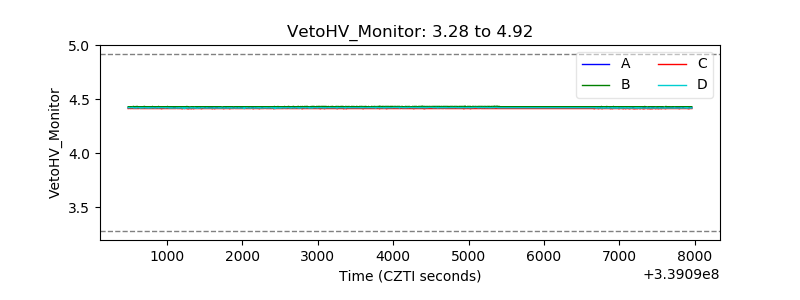 |
| Veto LLD | 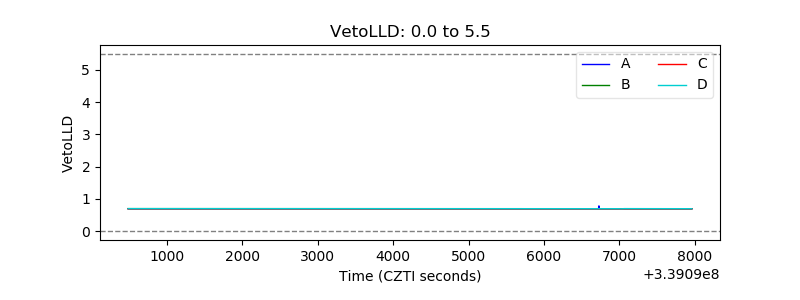 |
| Alpha Counter | 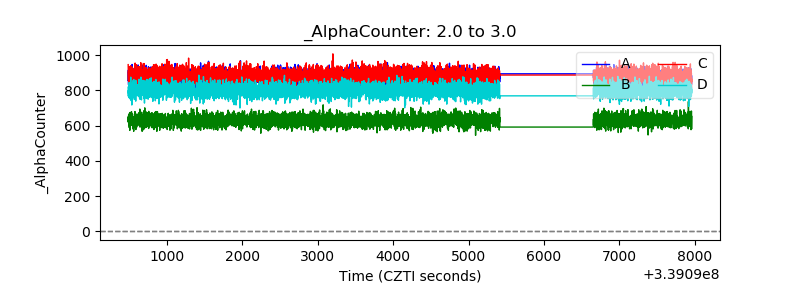 |
| _CPM_Rate | 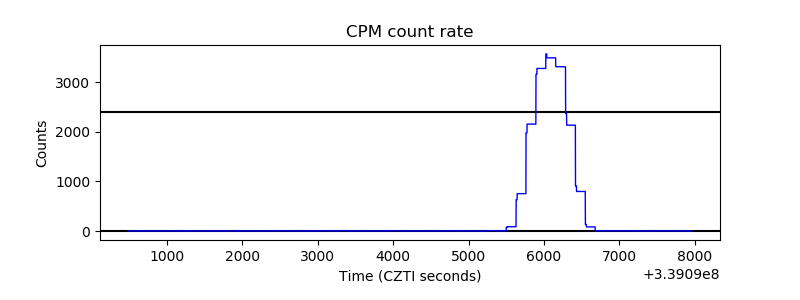 |
| CZT Counter | 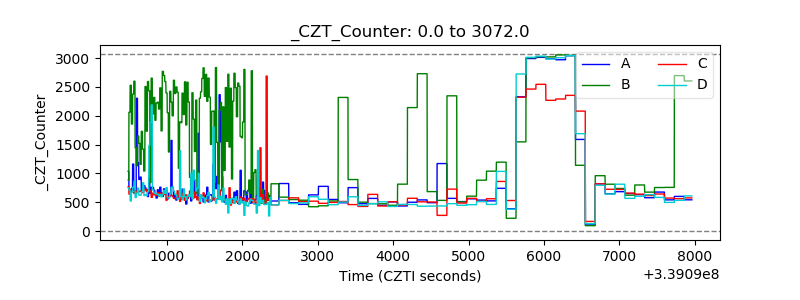 |
| +2.5 Volts monitor |  |
| +5 Volts monitor |  |
| _ROLL_ROT | 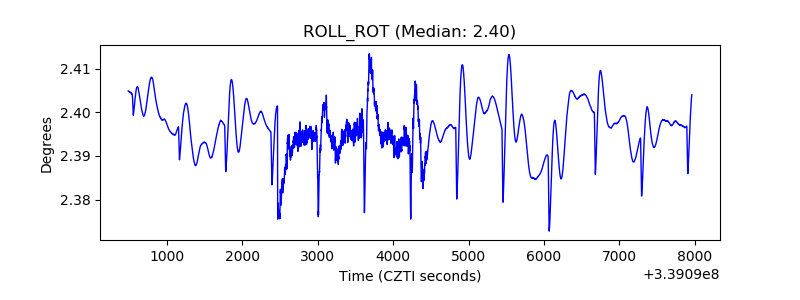 |
| _Roll_DEC | 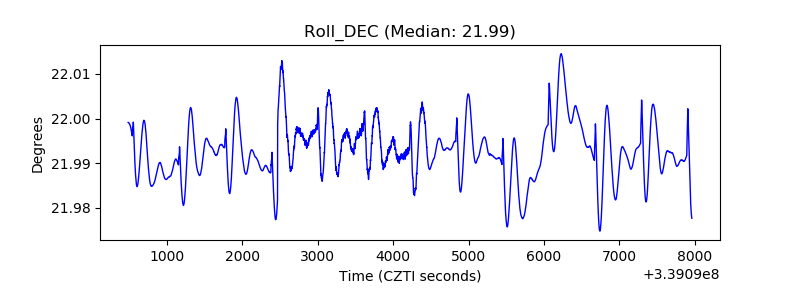 |
| _Roll_RA | 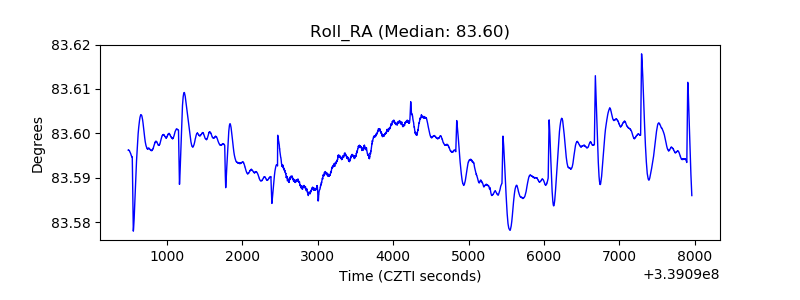 |
| Veto Counter | 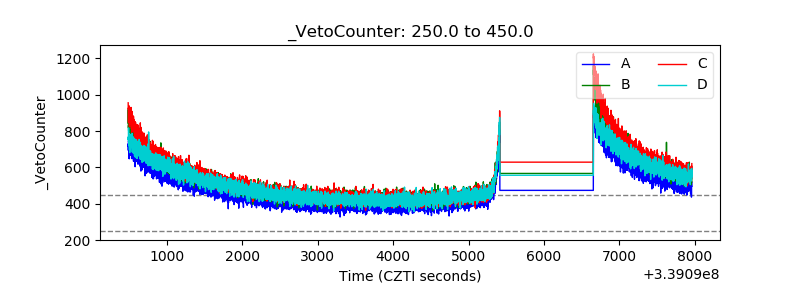 |