| Param | Original file | Final file |
|---|---|---|
| Filename | modeM0/AS1A09_120T02_9000003904_27068cztM0_level2.evt | modeM0/AS1A09_120T02_9000003904_27068cztM0_level2_quad_clean.evt |
| Size (bytes) | 634,674,240 | 109,535,040 |
| Size | 605.3 MB | 104.5 MB |
| Events in quadrant A | 3,956,193 | 738,343 |
| Events in quadrant B | 5,659,195 | 707,352 |
| Events in quadrant C | 3,524,179 | 742,977 |
| Events in quadrant D | 5,662,723 | 696,075 |
| Mode M9 | |||
|---|---|---|---|
| Quadrant | BADHDUFLAG | Total packets | Discarded packets |
| A | 0 | 13 | 0 |
| B | 0 | 13 | 0 |
| C | 0 | 13 | 0 |
| D | 0 | 13 | 0 |
| Mode M0 | |||
|---|---|---|---|
| Quadrant | BADHDUFLAG | Total packets | Discarded packets |
| A | 0 | 15887 | 0 |
| B | 0 | 20855 | 0 |
| C | 0 | 14476 | 0 |
| D | 0 | 21012 | 0 |
| Quadrant | Total seconds | Saturated seconds | Saturation percentage |
|---|---|---|---|
| A | 6193 | 90 | 1.453254% |
| B | 6194 | 1076 | 17.371650% |
| C | 6193 | 108 | 1.743904% |
| D | 6193 | 593 | 9.575327% |
Noise dominated data is calculated using 1-second bins in cleaned event files. If a bin has >2000 counts, and if more than 50% of those come from <1% of pixels, then it is considered to be noise-dominated and hence unusable.
| Quadrant | # 1 sec bins | Bins with >0 counts | Bins with >2000 counts | High rate bins dominated by noise | Noise dominated (total time) | Noise dominated (detector-on time) | Marked lightcurve |
|---|---|---|---|---|---|---|---|
| A | 7533 | 6194 | 29 | 29 | 0.38% | 0.47% | 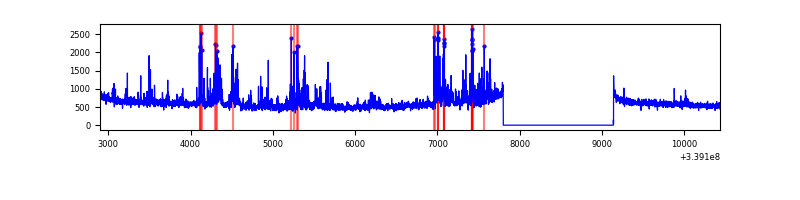 |
| B | 7534 | 6195 | 881 | 881 | 11.69% | 14.22% | 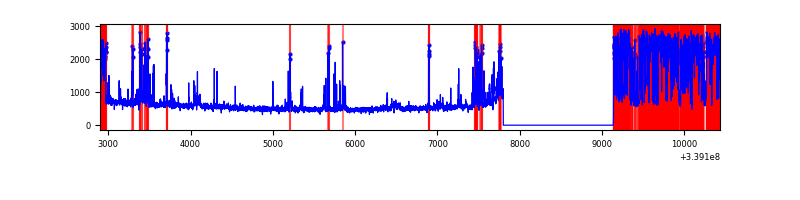 |
| C | 7533 | 6194 | 0 | 0 | 0.00% | 0.00% | 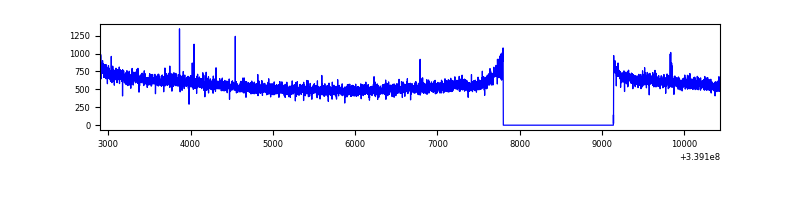 |
| D | 7533 | 6194 | 593 | 593 | 7.87% | 9.57% | 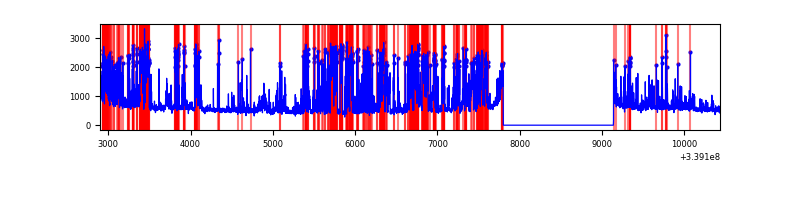 |
Top three noisy pixels from each quadrant. If the there are fewer than three noisy pixels in the level2.evt file, extra rows are filled as -1
| Pixel properties | Quadrant properties | ||||||
|---|---|---|---|---|---|---|---|
| Quadrant | DetID | PixID | Counts | Sigma | Mean | Median | Sigma |
| A | 14 | 235 | 518399 | 2978.39 | 873 | 862 | 173.8 |
| A | 12 | 189 | 45755 | 258.36 | 873 | 862 | 173.8 |
| A | 6 | 16 | 26040 | 144.9 | 873 | 862 | 173.8 |
| B | 0 | 189 | 2439386 | 16049.22 | 811 | 793 | 151.9 |
| B | 10 | 245 | 29997 | 192.2 | 811 | 793 | 151.9 |
| B | 0 | 182 | 21590 | 136.87 | 811 | 793 | 151.9 |
| C | 14 | 238 | 140944 | 694.62 | 866 | 877 | 201.6 |
| C | 15 | 208 | 6775 | 29.25 | 866 | 877 | 201.6 |
| C | 13 | 61 | 5709 | 23.96 | 866 | 877 | 201.6 |
| D | 1 | 52 | 2268358 | 11360.11 | 836 | 815 | 199.6 |
| D | 2 | 250 | 206976 | 1032.84 | 836 | 815 | 199.6 |
| D | 2 | 234 | 27013 | 131.25 | 836 | 815 | 199.6 |
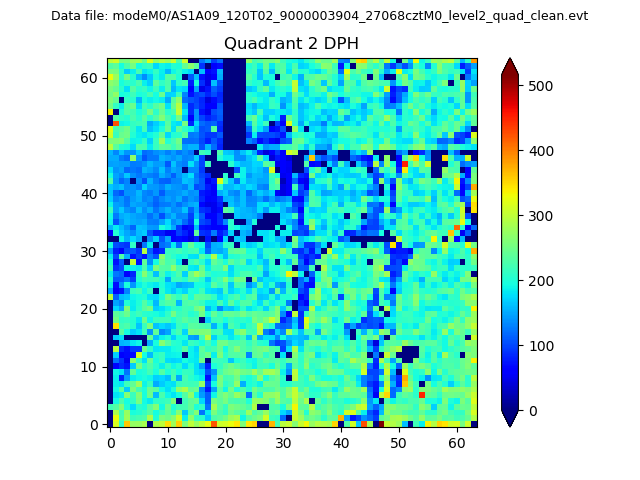
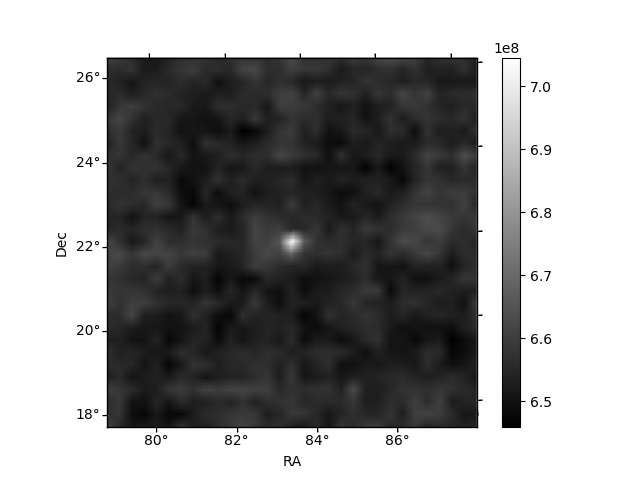
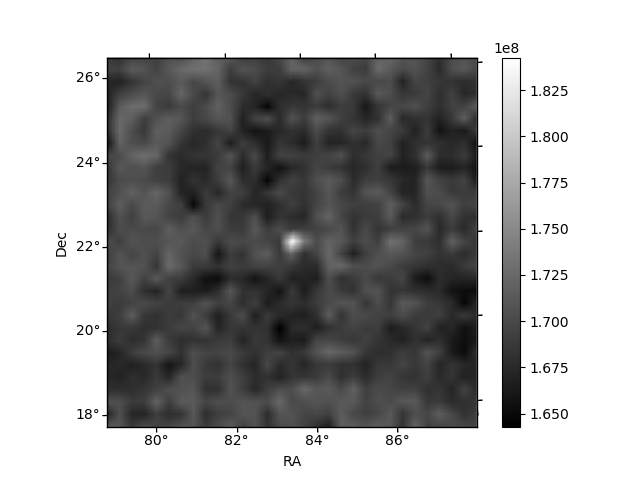
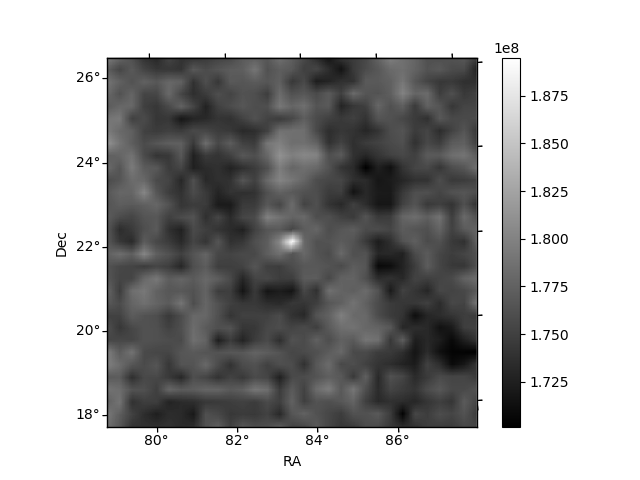
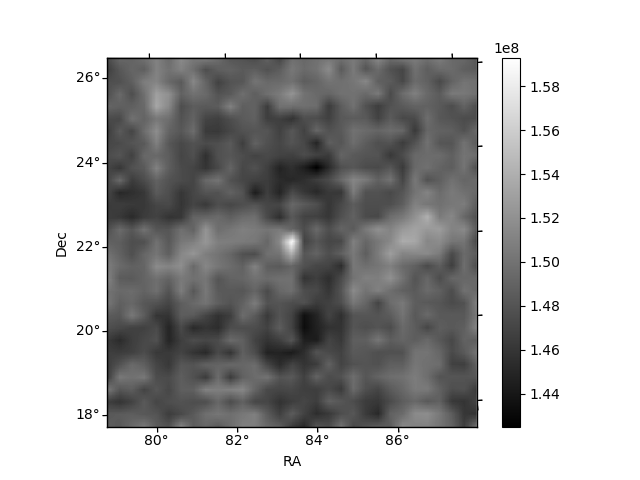
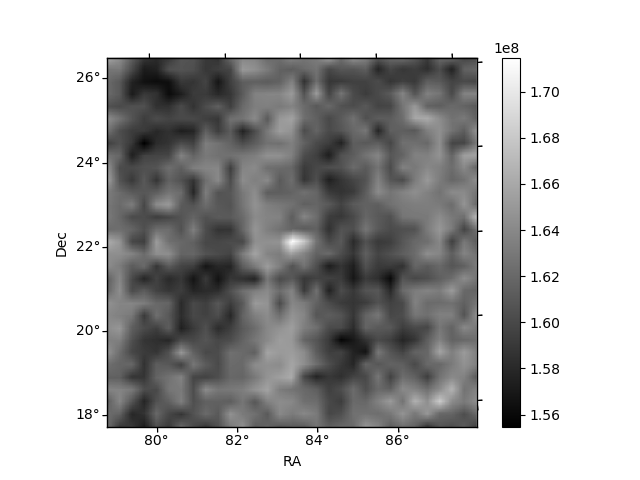
Histogram calculated using DETX and DETY for each event in the final _common_clean file
| Quadrant A | 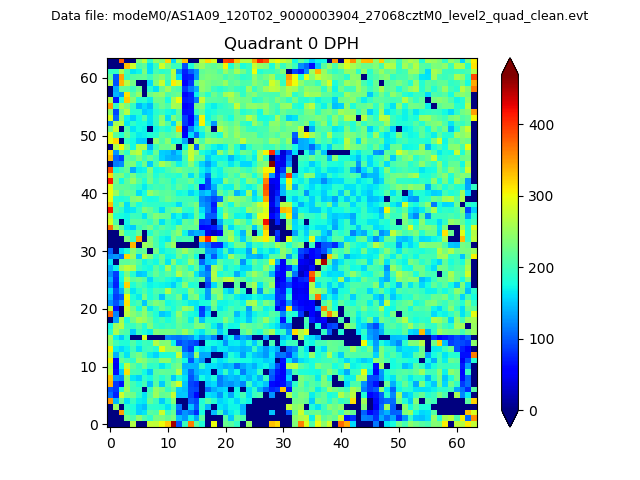 |
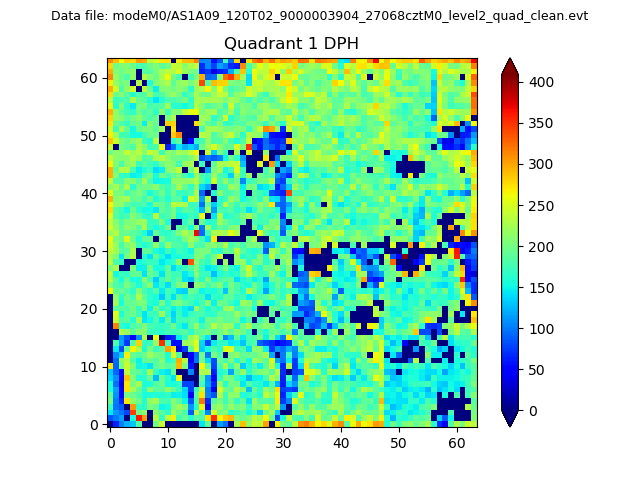 |
Quadrant B |
|---|---|---|---|
| Quadrant D | 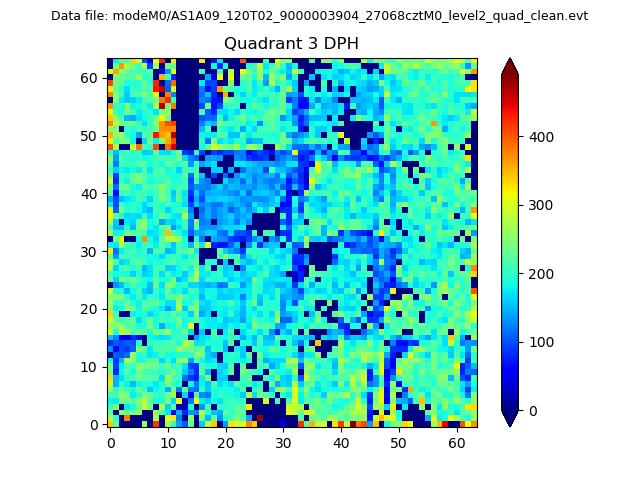 |
 |
Quadrant C |
| Plot type | Count rate plots | Images |
|---|---|---|
| Comparison with Poisson distribution Blue bars denote a histogram of data divided into 1 sec bins. Red curve is a Poisson curve with rate = median count rate of data. |
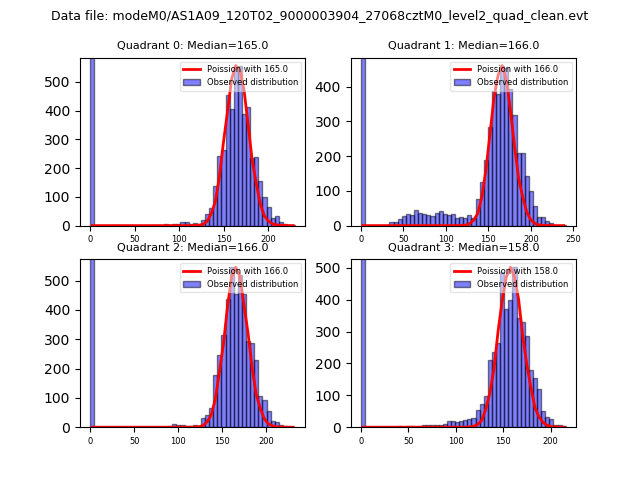 |
 |
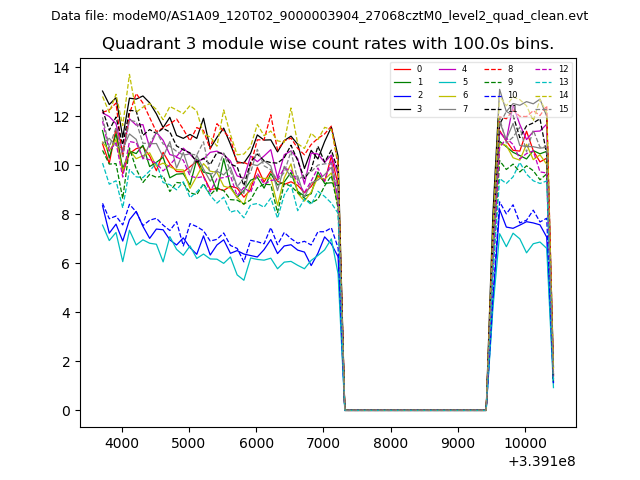
| Quadrant-wise count rates Data is divided into 100 sec bins |
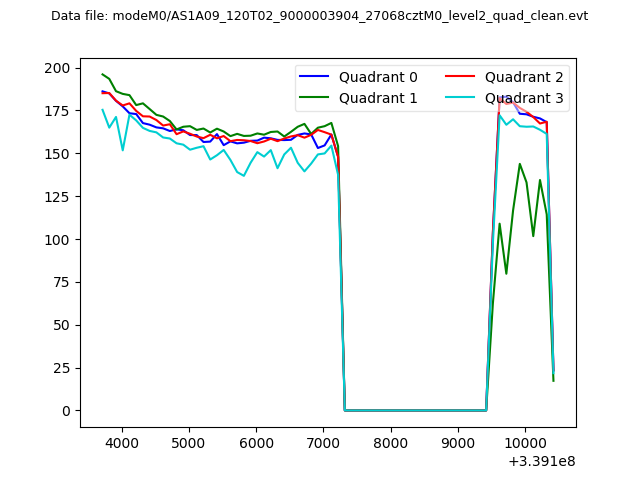 |
|
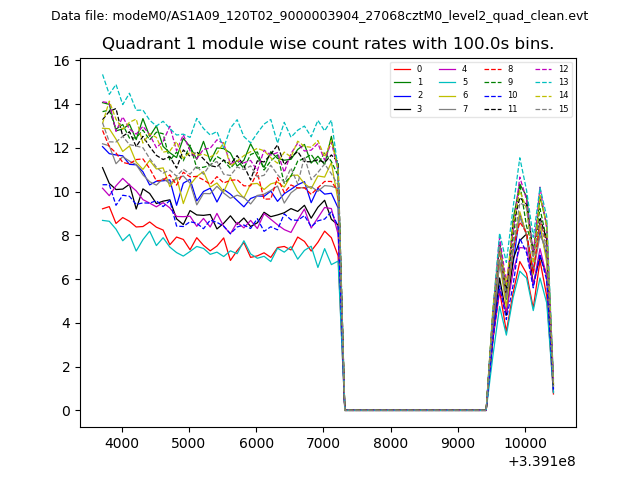
| Module-wise count rates for Quadrant A Data is divided into 100 sec bins |
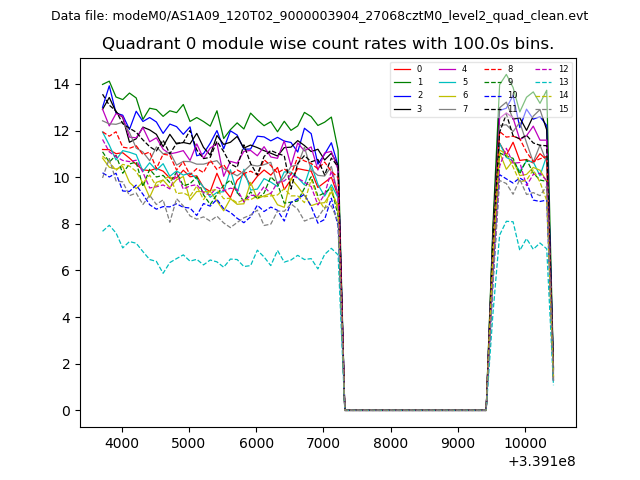 |
 |
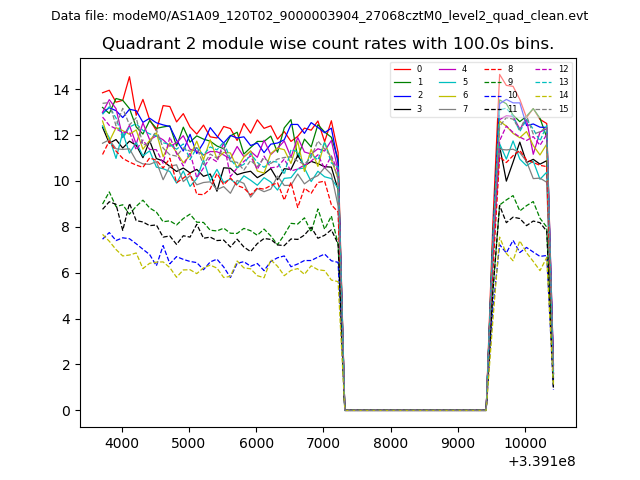
| Module-wise count rates for Quadrant B Data is divided into 100 sec bins |
 |
 |
| Module-wise count rates for Quadrant C Data is divided into 100 sec bins |
 |
 |
| Module-wise count rates for Quadrant D Data is divided into 100 sec bins |
 |
 |
| Parameter | Plot |
|---|---|
| CZT HV Monitor |  |
| D_VDD | 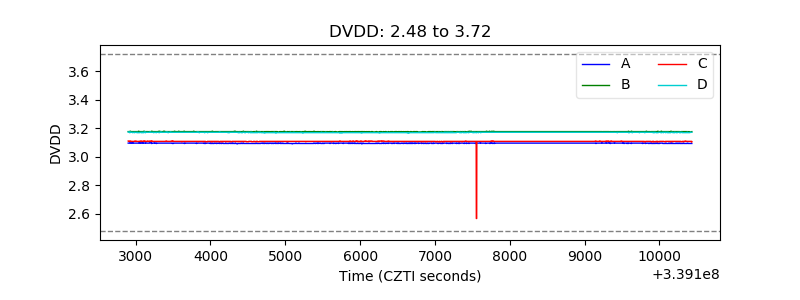 |
| Temperature 1 | 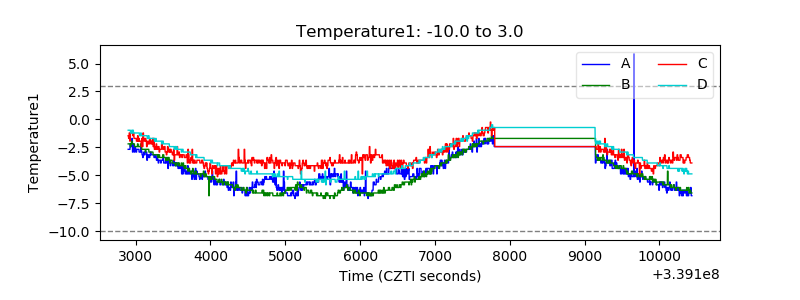 |
| Veto HV Monitor | 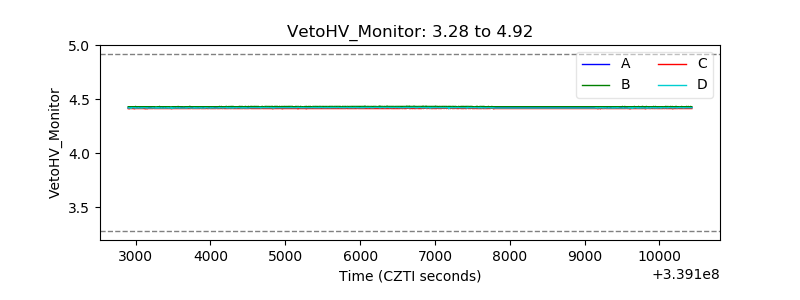 |
| Veto LLD | 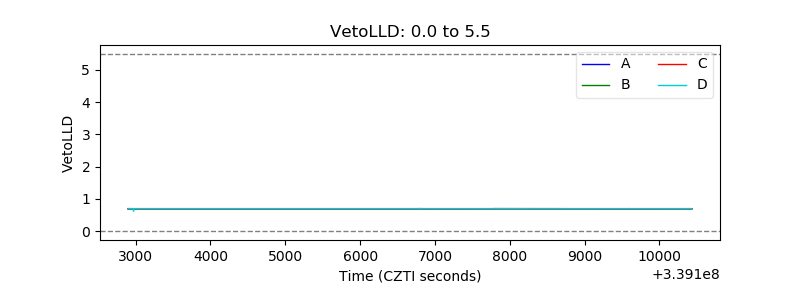 |
| Alpha Counter | 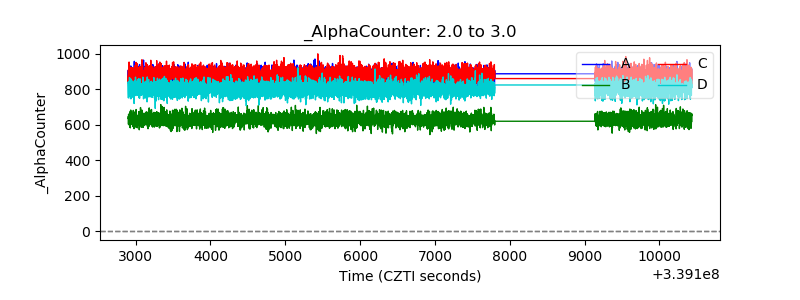 |
| _CPM_Rate | 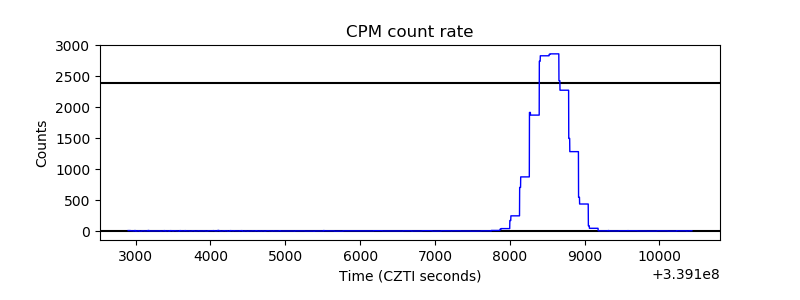 |
| CZT Counter | 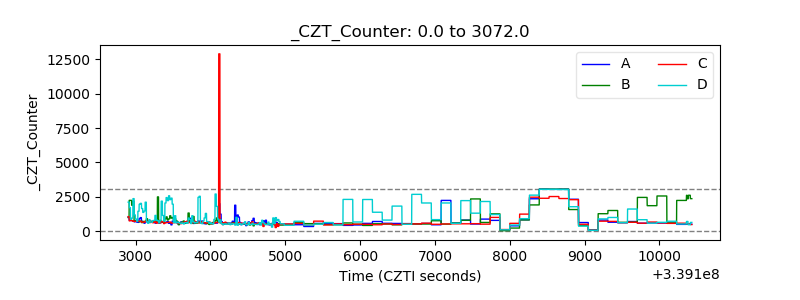 |
| +2.5 Volts monitor |  |
| +5 Volts monitor | 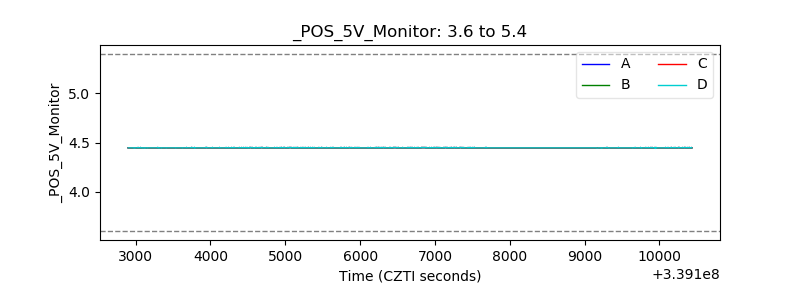 |
| _ROLL_ROT | 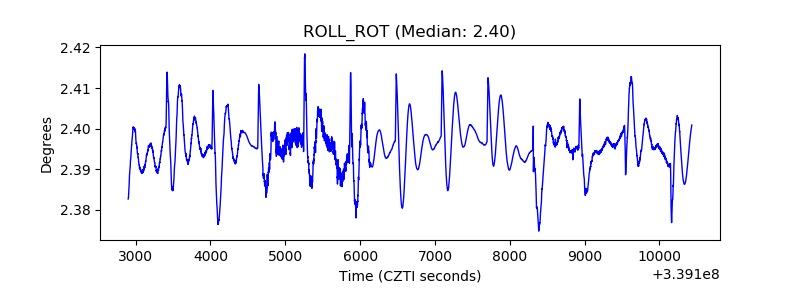 |
| _Roll_DEC | 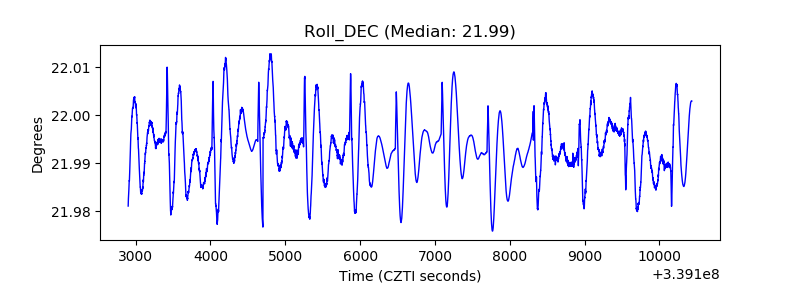 |
| _Roll_RA | 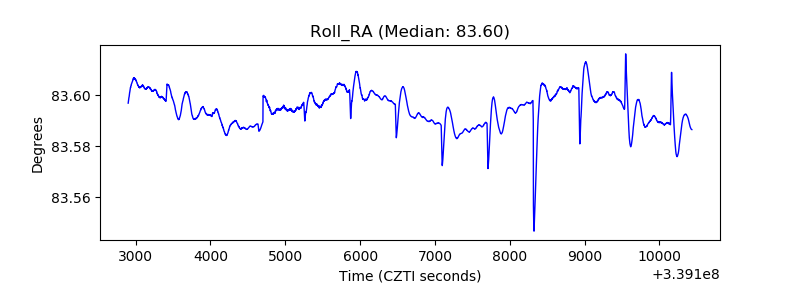 |
| Veto Counter | 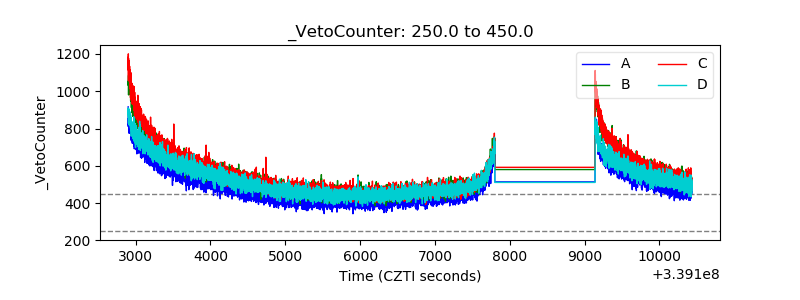 |