| Param | Original file | Final file |
|---|---|---|
| Filename | modeM0/AS1A09_120T02_9000003904_27072cztM0_level2.evt | modeM0/AS1A09_120T02_9000003904_27072cztM0_level2_quad_clean.evt |
| Size (bytes) | 607,991,040 | 113,466,240 |
| Size | 579.8 MB | 108.2 MB |
| Events in quadrant A | 4,174,869 | 741,102 |
| Events in quadrant B | 4,782,873 | 749,970 |
| Events in quadrant C | 3,679,655 | 733,002 |
| Events in quadrant D | 5,272,557 | 695,486 |
| Mode M9 | |||
|---|---|---|---|
| Quadrant | BADHDUFLAG | Total packets | Discarded packets |
| A | 0 | 3 | 0 |
| B | 0 | 3 | 0 |
| C | 0 | 3 | 0 |
| D | 0 | 3 | 0 |
| Mode M0 | |||
|---|---|---|---|
| Quadrant | BADHDUFLAG | Total packets | Discarded packets |
| A | 0 | 17109 | 0 |
| B | 0 | 19353 | 0 |
| C | 0 | 15560 | 0 |
| D | 0 | 20747 | 0 |
| Quadrant | Total seconds | Saturated seconds | Saturation percentage |
|---|---|---|---|
| A | 7426 | 136 | 1.831403% |
| B | 7427 | 344 | 4.631749% |
| C | 7426 | 149 | 2.006464% |
| D | 7427 | 383 | 5.156860% |
Noise dominated data is calculated using 1-second bins in cleaned event files. If a bin has >2000 counts, and if more than 50% of those come from <1% of pixels, then it is considered to be noise-dominated and hence unusable.
| Quadrant | # 1 sec bins | Bins with >0 counts | Bins with >2000 counts | High rate bins dominated by noise | Noise dominated (total time) | Noise dominated (detector-on time) | Marked lightcurve |
|---|---|---|---|---|---|---|---|
| A | 7661 | 7429 | 19 | 19 | 0.25% | 0.26% | 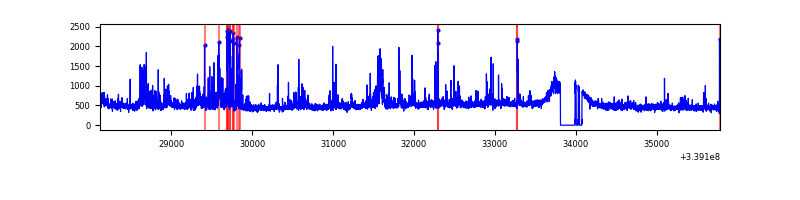 |
| B | 7662 | 7430 | 149 | 149 | 1.94% | 2.01% | 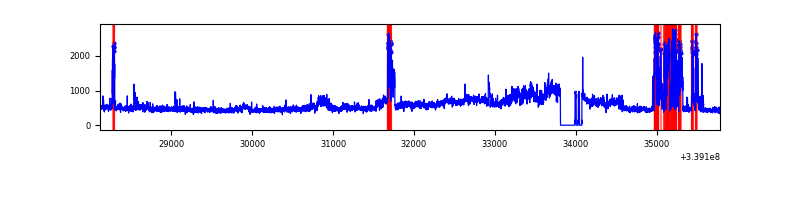 |
| C | 7662 | 7430 | 0 | 0 | 0.00% | 0.00% | 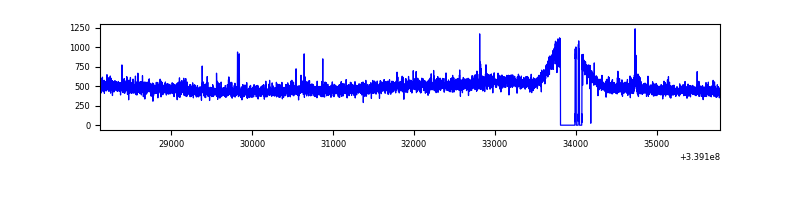 |
| D | 7662 | 7430 | 277 | 277 | 3.62% | 3.73% | 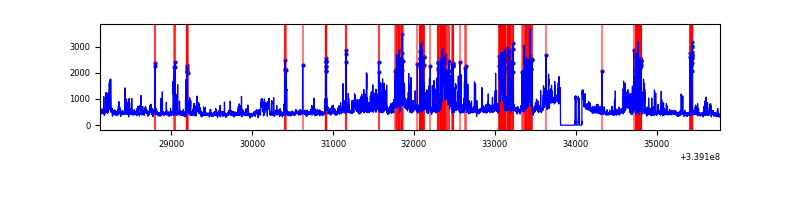 |
Top three noisy pixels from each quadrant. If the there are fewer than three noisy pixels in the level2.evt file, extra rows are filled as -1
| Pixel properties | Quadrant properties | ||||||
|---|---|---|---|---|---|---|---|
| Quadrant | DetID | PixID | Counts | Sigma | Mean | Median | Sigma |
| A | 14 | 235 | 567691 | 2999.97 | 930 | 913 | 188.9 |
| A | 6 | 16 | 16138 | 80.59 | 930 | 913 | 188.9 |
| A | 13 | 254 | 12104 | 59.23 | 930 | 913 | 188.9 |
| B | 0 | 189 | 1038055 | 5801.29 | 925 | 904 | 178.8 |
| B | 7 | 205 | 104530 | 579.63 | 925 | 904 | 178.8 |
| B | 12 | 111 | 21630 | 115.93 | 925 | 904 | 178.8 |
| C | 14 | 238 | 142473 | 661.09 | 900 | 912 | 214.1 |
| C | 15 | 208 | 29482 | 133.42 | 900 | 912 | 214.1 |
| C | 13 | 61 | 6139 | 24.41 | 900 | 912 | 214.1 |
| D | 1 | 52 | 1417294 | 6611.9 | 887 | 864 | 214.2 |
| D | 2 | 250 | 347400 | 1617.63 | 887 | 864 | 214.2 |
| D | 13 | 85 | 58002 | 266.72 | 887 | 864 | 214.2 |
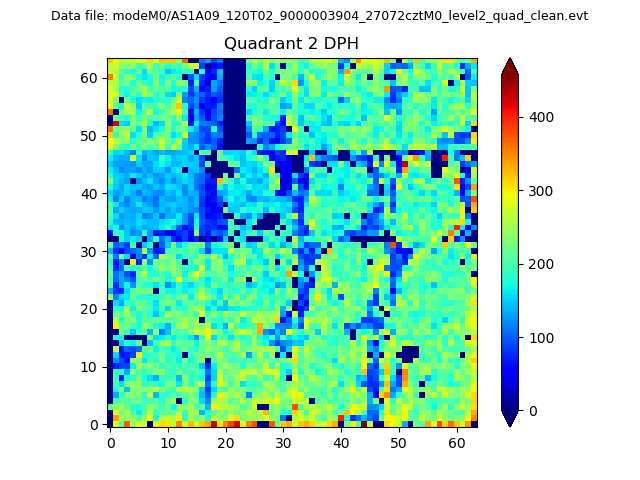
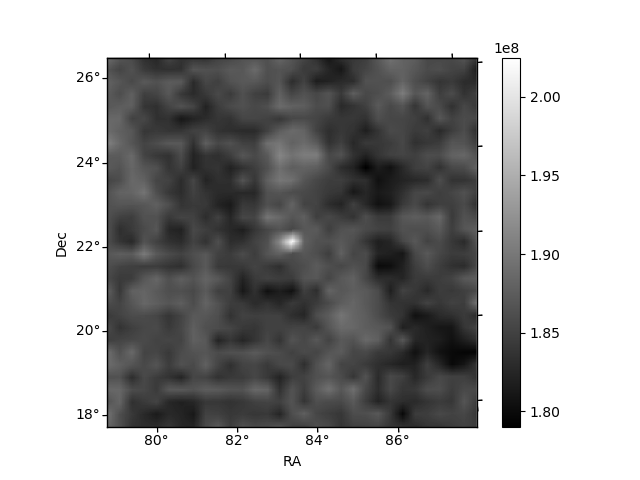
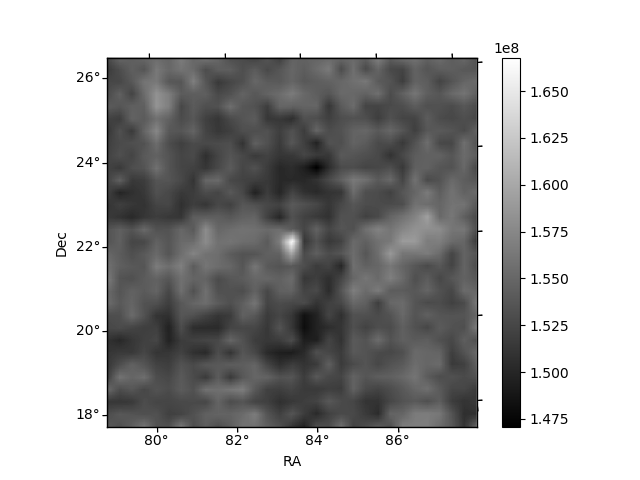
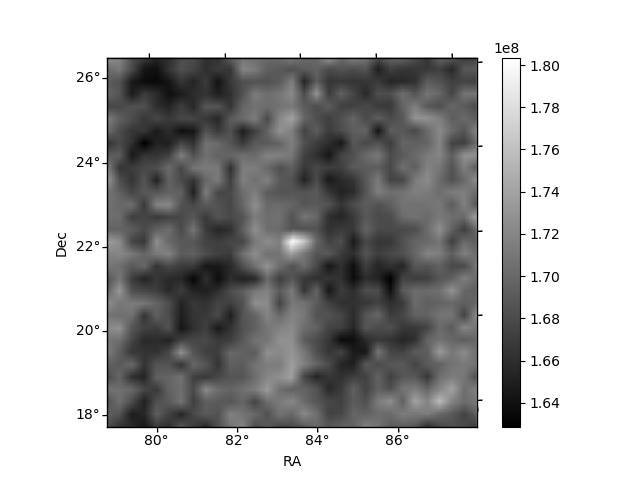
Histogram calculated using DETX and DETY for each event in the final _common_clean file
| Quadrant A | 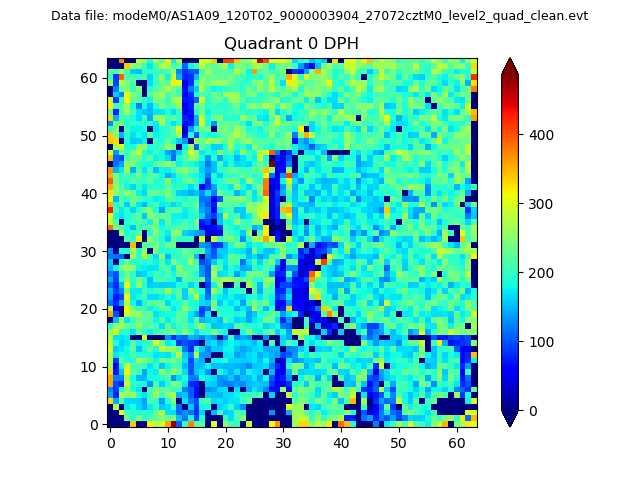 |
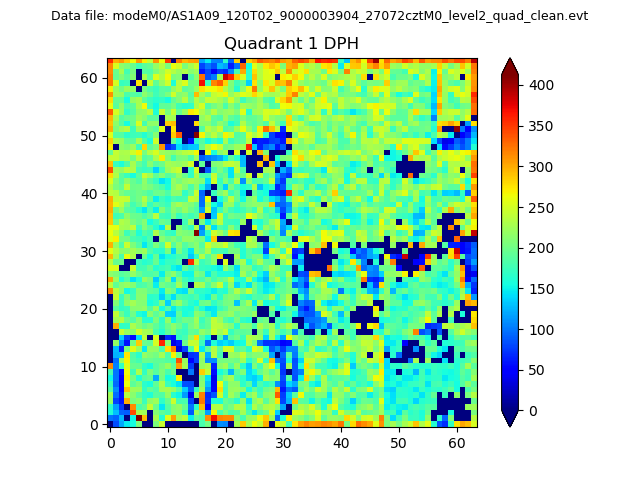 |
Quadrant B |
|---|---|---|---|
| Quadrant D | 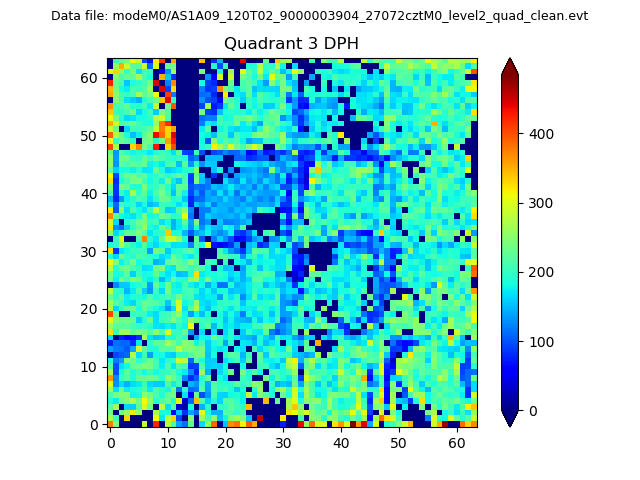 |
 |
Quadrant C |
| Plot type | Count rate plots | Images |
|---|---|---|
| Comparison with Poisson distribution Blue bars denote a histogram of data divided into 1 sec bins. Red curve is a Poisson curve with rate = median count rate of data. |
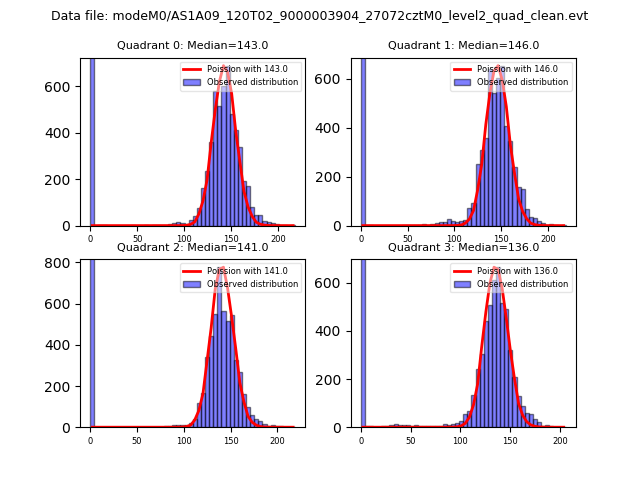 |
 |
| Quadrant-wise count rates Data is divided into 100 sec bins |
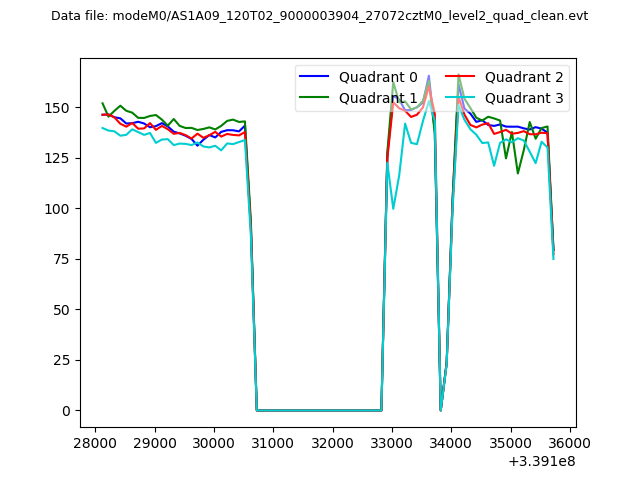 |
|
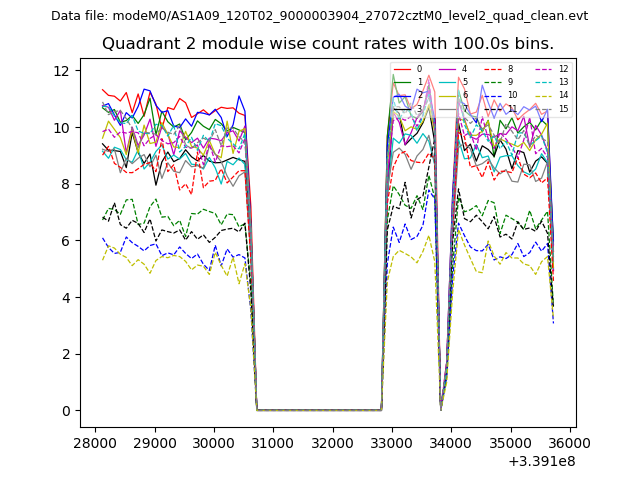
| Module-wise count rates for Quadrant A Data is divided into 100 sec bins |
 |
 |
| Module-wise count rates for Quadrant B Data is divided into 100 sec bins |
 |
 |
| Module-wise count rates for Quadrant C Data is divided into 100 sec bins |
 |
 |
| Module-wise count rates for Quadrant D Data is divided into 100 sec bins |
 |
 |
| Parameter | Plot |
|---|---|
| CZT HV Monitor | 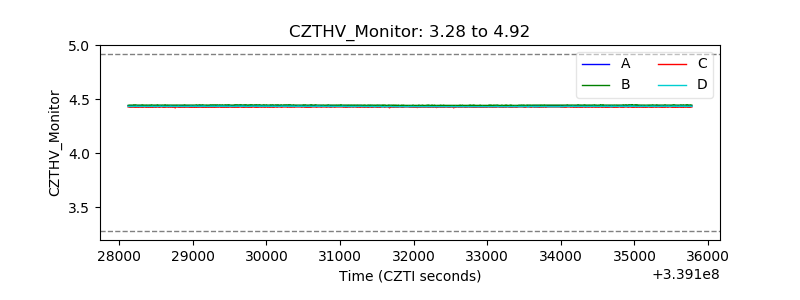 |
| D_VDD |  |
| Temperature 1 | 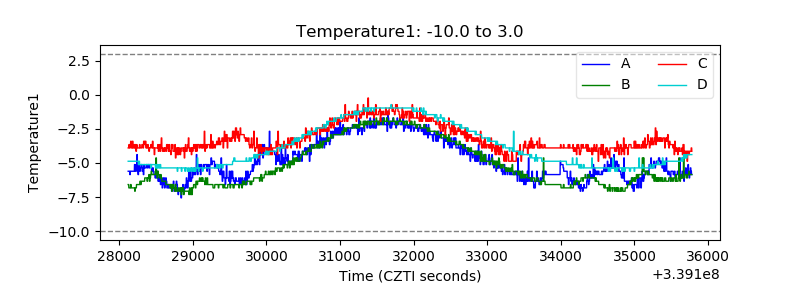 |
| Veto HV Monitor | 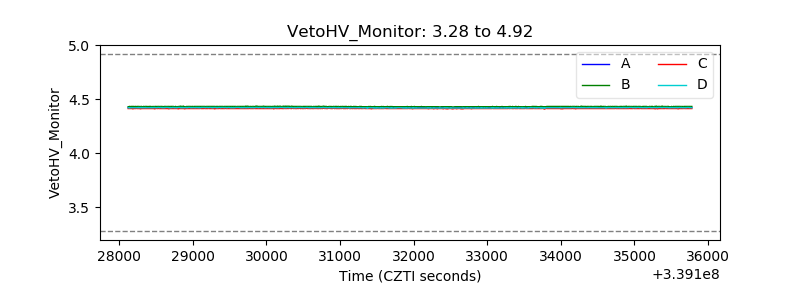 |
| Veto LLD |  |
| Alpha Counter | 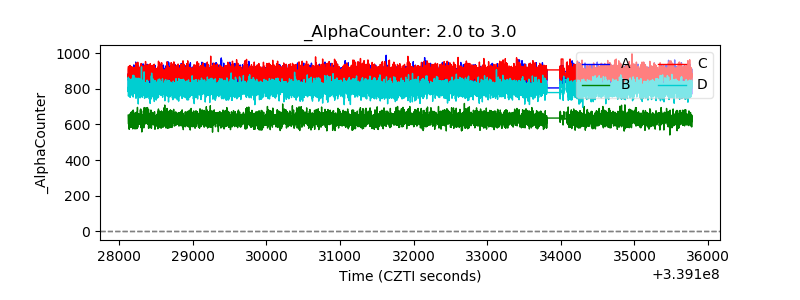 |
| _CPM_Rate | 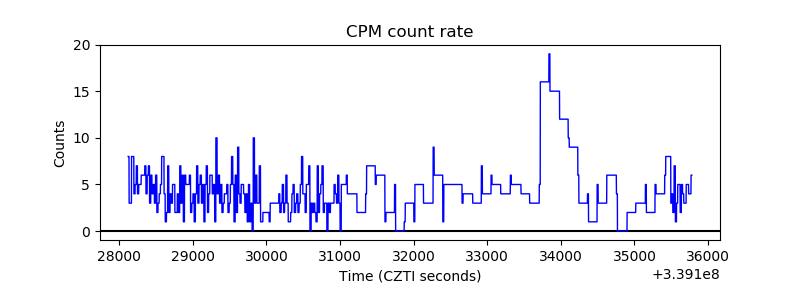 |
| CZT Counter | 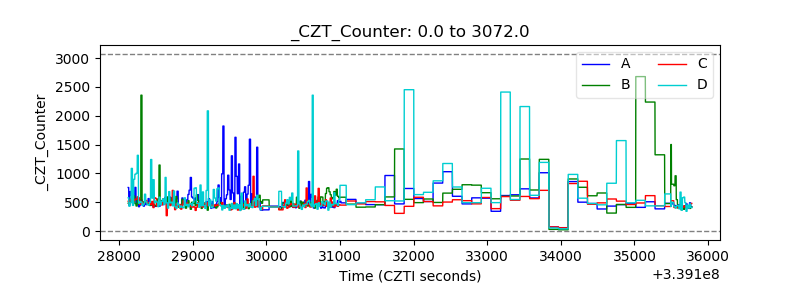 |
| +2.5 Volts monitor |  |
| +5 Volts monitor |  |
| _ROLL_ROT | 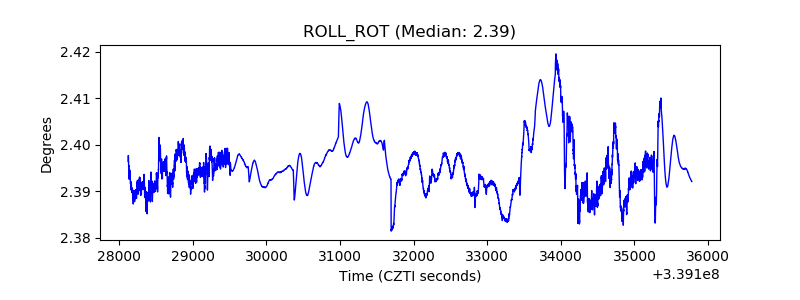 |
| _Roll_DEC | 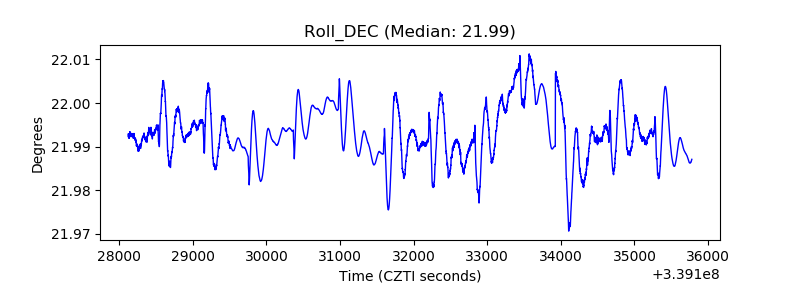 |
| _Roll_RA | 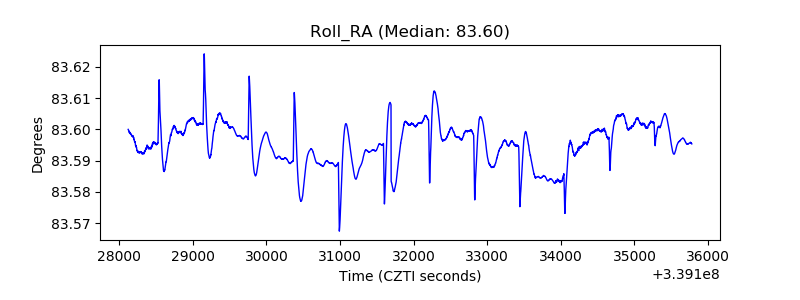 |
| Veto Counter | 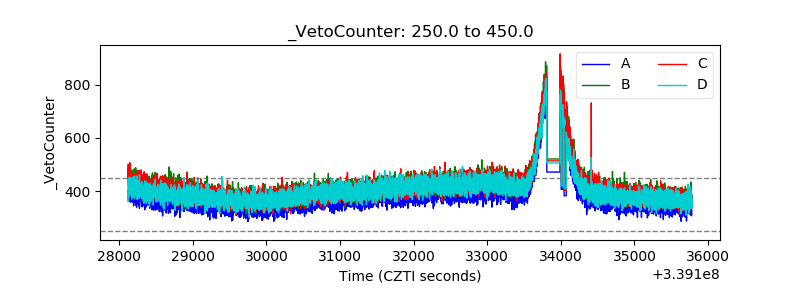 |