| Param | Original file | Final file |
|---|---|---|
| Filename | modeM0/AS1A09_120T02_9000003904_27073cztM0_level2.evt | modeM0/AS1A09_120T02_9000003904_27073cztM0_level2_quad_clean.evt |
| Size (bytes) | 547,865,280 | 108,221,760 |
| Size | 522.5 MB | 103.2 MB |
| Events in quadrant A | 3,729,552 | 702,810 |
| Events in quadrant B | 4,002,160 | 714,768 |
| Events in quadrant C | 3,521,820 | 694,228 |
| Events in quadrant D | 4,850,771 | 664,809 |
| Mode M9 | |||
|---|---|---|---|
| Quadrant | BADHDUFLAG | Total packets | Discarded packets |
| A | 0 | 1 | 0 |
| B | 0 | 1 | 0 |
| C | 0 | 1 | 0 |
| D | 0 | 1 | 0 |
| Mode M0 | |||
|---|---|---|---|
| Quadrant | BADHDUFLAG | Total packets | Discarded packets |
| A | 0 | 15567 | 0 |
| B | 0 | 16391 | 0 |
| C | 0 | 14943 | 0 |
| D | 0 | 19303 | 0 |
| Quadrant | Total seconds | Saturated seconds | Saturation percentage |
|---|---|---|---|
| A | 7189 | 177 | 2.462095% |
| B | 7189 | 278 | 3.867019% |
| C | 7188 | 178 | 2.476349% |
| D | 7189 | 217 | 3.018500% |
Noise dominated data is calculated using 1-second bins in cleaned event files. If a bin has >2000 counts, and if more than 50% of those come from <1% of pixels, then it is considered to be noise-dominated and hence unusable.
| Quadrant | # 1 sec bins | Bins with >0 counts | Bins with >2000 counts | High rate bins dominated by noise | Noise dominated (total time) | Noise dominated (detector-on time) | Marked lightcurve |
|---|---|---|---|---|---|---|---|
| A | 7339 | 7190 | 16 | 16 | 0.22% | 0.22% | 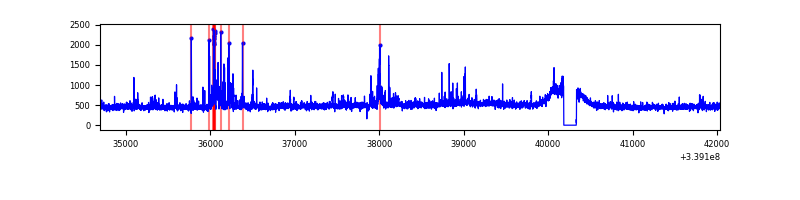 |
| B | 7339 | 7190 | 126 | 126 | 1.72% | 1.75% | 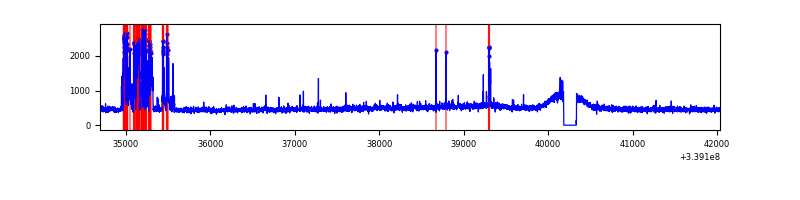 |
| C | 7339 | 7190 | 0 | 0 | 0.00% | 0.00% | 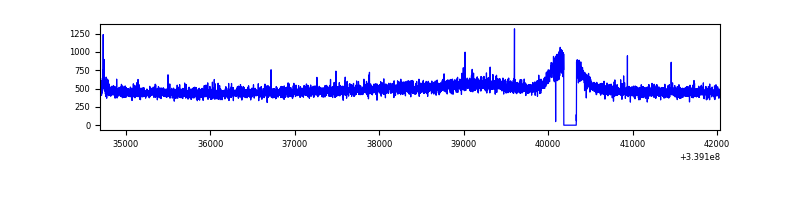 |
| D | 7339 | 7190 | 104 | 104 | 1.42% | 1.45% | 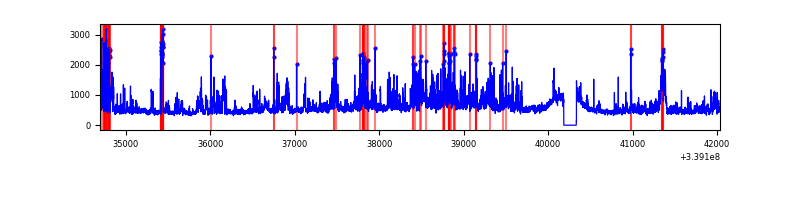 |
Top three noisy pixels from each quadrant. If the there are fewer than three noisy pixels in the level2.evt file, extra rows are filled as -1
| Pixel properties | Quadrant properties | ||||||
|---|---|---|---|---|---|---|---|
| Quadrant | DetID | PixID | Counts | Sigma | Mean | Median | Sigma |
| A | 14 | 235 | 238242 | 1307.99 | 895 | 880 | 181.5 |
| A | 6 | 16 | 40292 | 217.18 | 895 | 880 | 181.5 |
| A | 13 | 254 | 11230 | 57.03 | 895 | 880 | 181.5 |
| B | 0 | 189 | 486612 | 2785.44 | 888 | 867 | 174.4 |
| B | 10 | 246 | 24982 | 138.28 | 888 | 867 | 174.4 |
| B | 12 | 111 | 20892 | 114.83 | 888 | 867 | 174.4 |
| C | 14 | 238 | 137637 | 670.25 | 863 | 871 | 204.1 |
| C | 15 | 208 | 13572 | 62.24 | 863 | 871 | 204.1 |
| C | 13 | 61 | 6031 | 25.29 | 863 | 871 | 204.1 |
| D | 1 | 52 | 1267502 | 6082.05 | 863 | 840 | 208.3 |
| D | 2 | 250 | 130995 | 624.96 | 863 | 840 | 208.3 |
| D | 13 | 85 | 96712 | 460.34 | 863 | 840 | 208.3 |
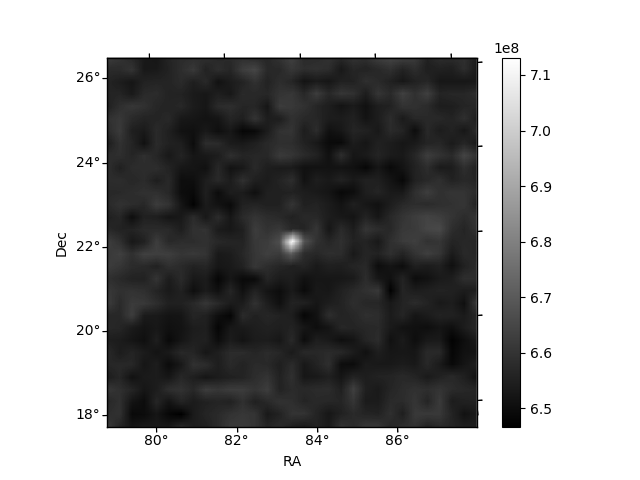
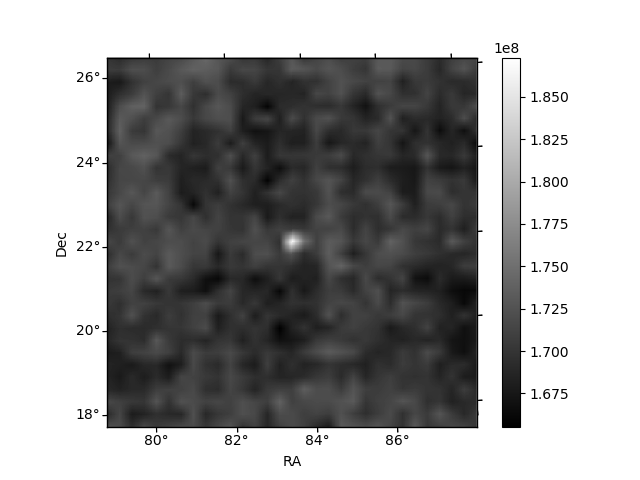
Histogram calculated using DETX and DETY for each event in the final _common_clean file
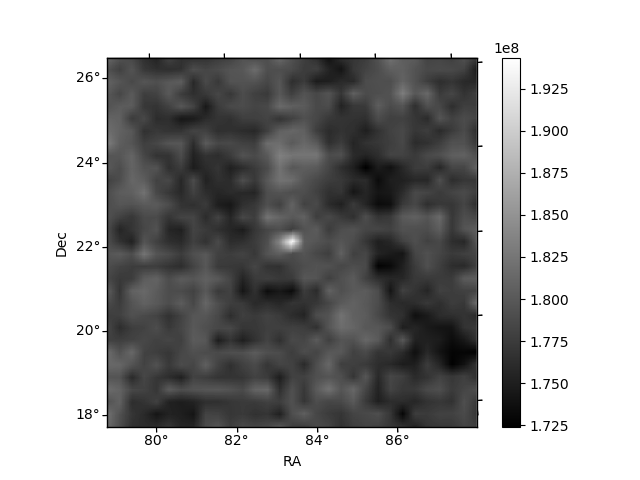
| Quadrant A | 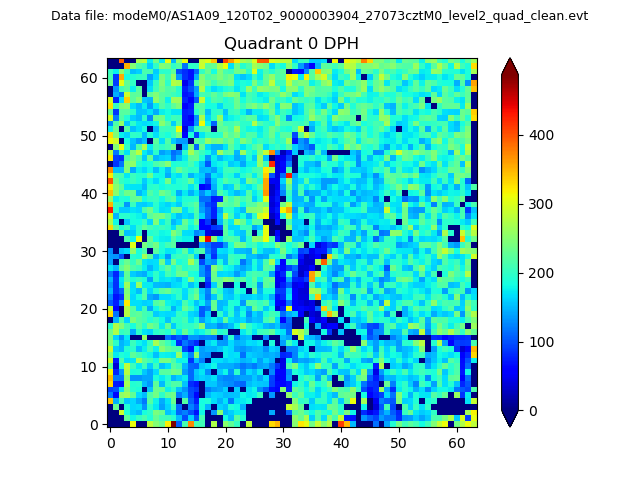 |
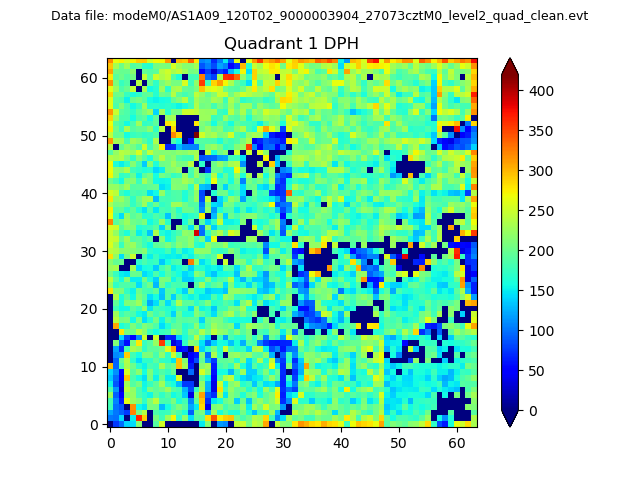 |
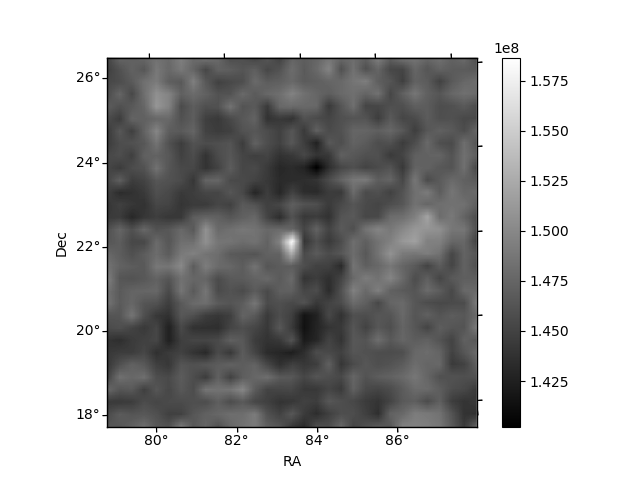
Quadrant B |
|---|---|---|---|
| Quadrant D | 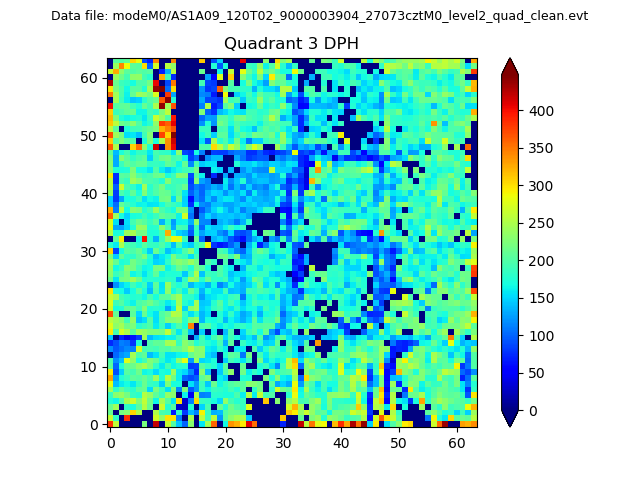 |
 |
Quadrant C |
| Plot type | Count rate plots | Images |
|---|---|---|
| Comparison with Poisson distribution Blue bars denote a histogram of data divided into 1 sec bins. Red curve is a Poisson curve with rate = median count rate of data. |
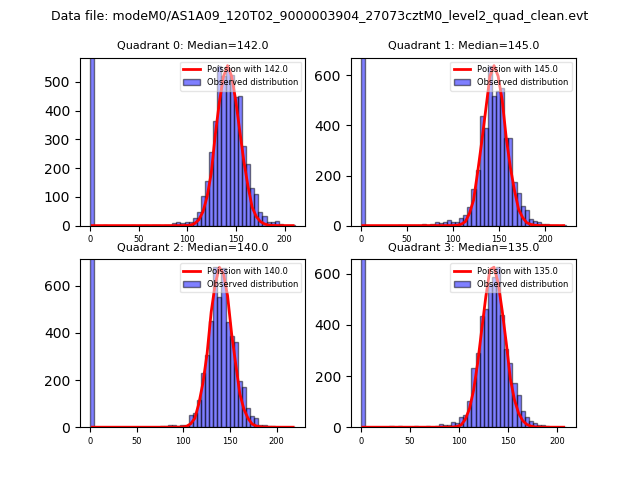 |
 |
| Quadrant-wise count rates Data is divided into 100 sec bins |
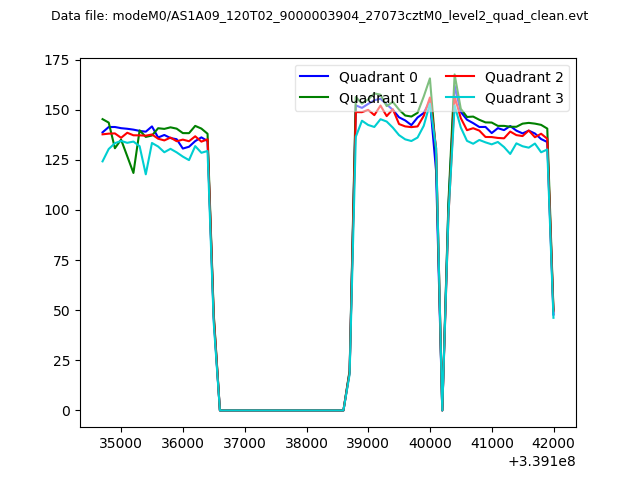 |
|
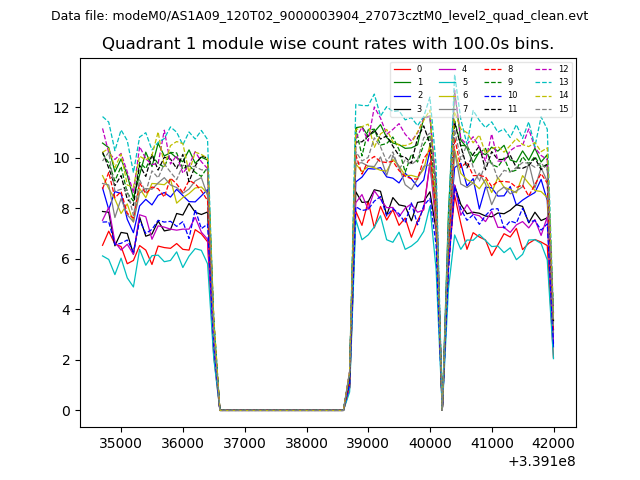
| Module-wise count rates for Quadrant A Data is divided into 100 sec bins |
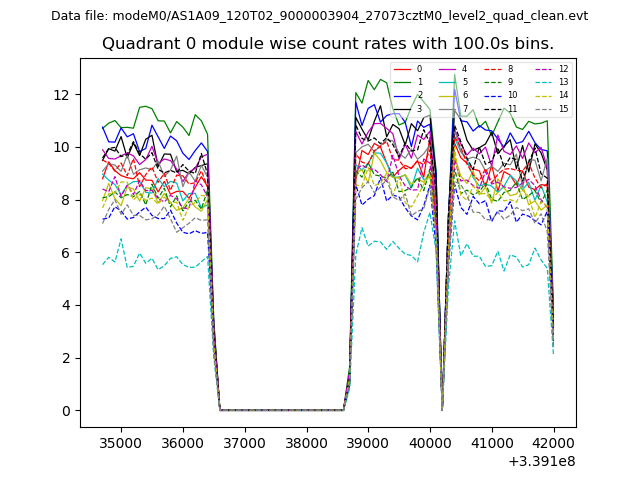 |
 |
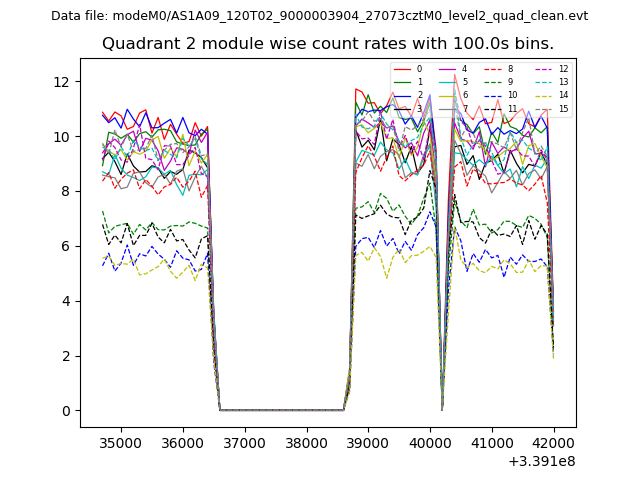
| Module-wise count rates for Quadrant B Data is divided into 100 sec bins |
 |
 |
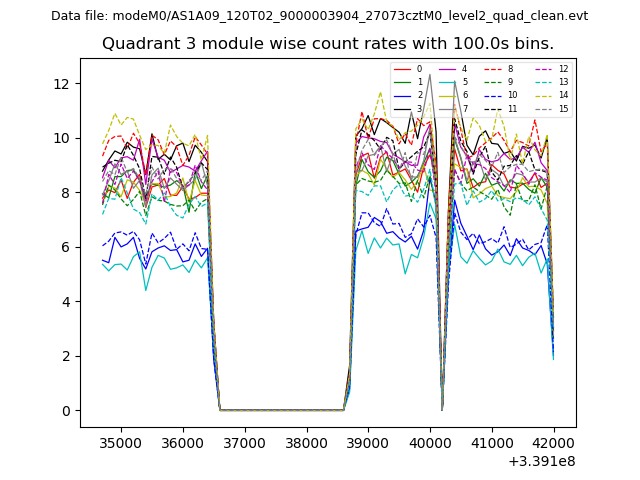
| Module-wise count rates for Quadrant C Data is divided into 100 sec bins |
 |
 |
| Module-wise count rates for Quadrant D Data is divided into 100 sec bins |
 |
 |
| Parameter | Plot |
|---|---|
| CZT HV Monitor | 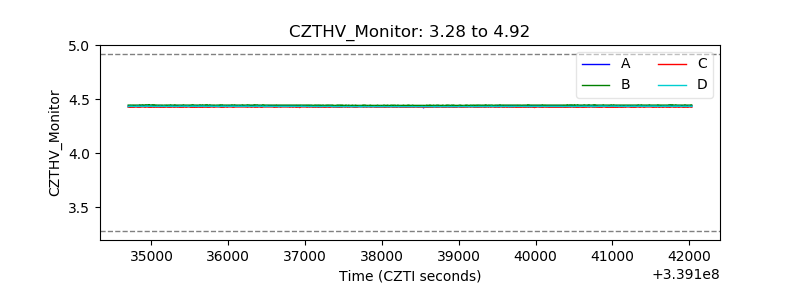 |
| D_VDD |  |
| Temperature 1 |  |
| Veto HV Monitor | 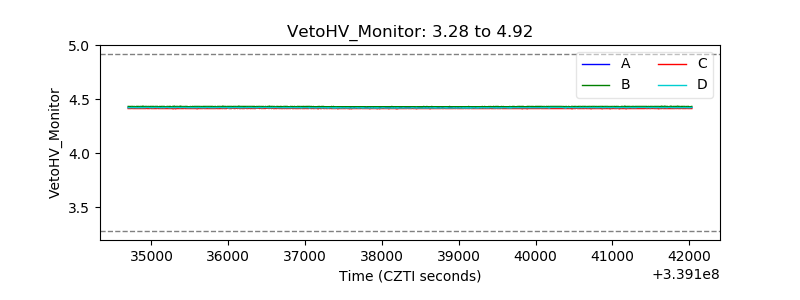 |
| Veto LLD | 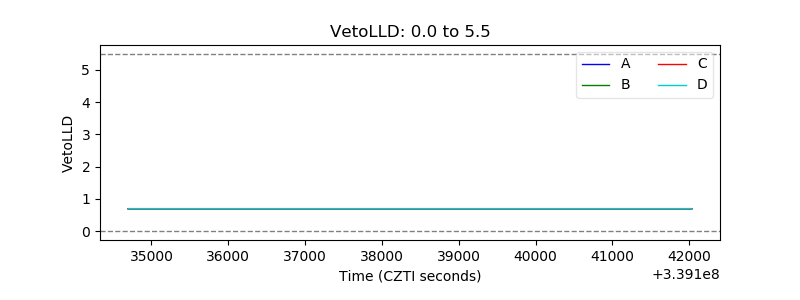 |
| Alpha Counter | 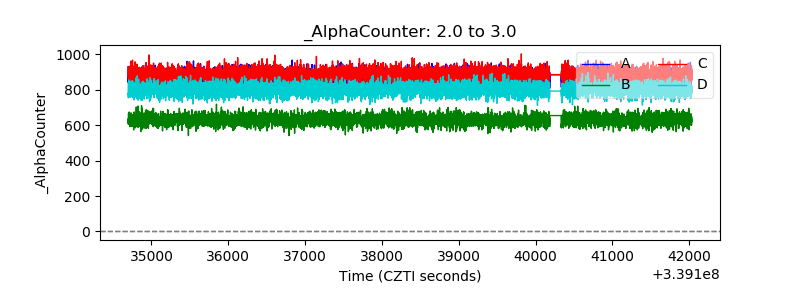 |
| _CPM_Rate | 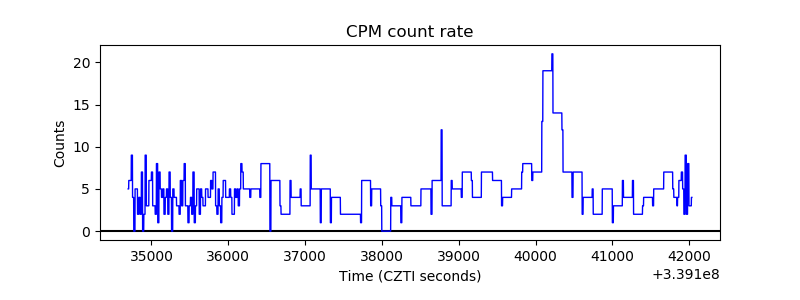 |
| CZT Counter |  |
| +2.5 Volts monitor |  |
| +5 Volts monitor |  |
| _ROLL_ROT | 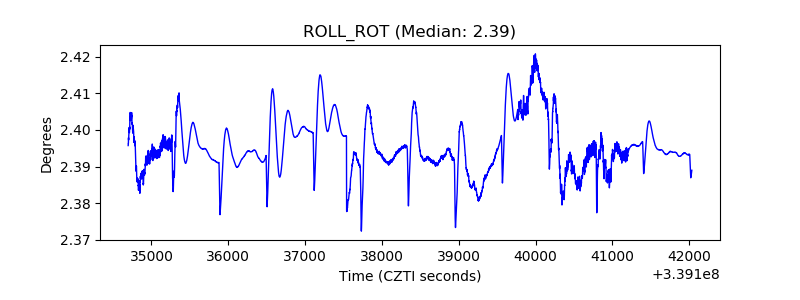 |
| _Roll_DEC | 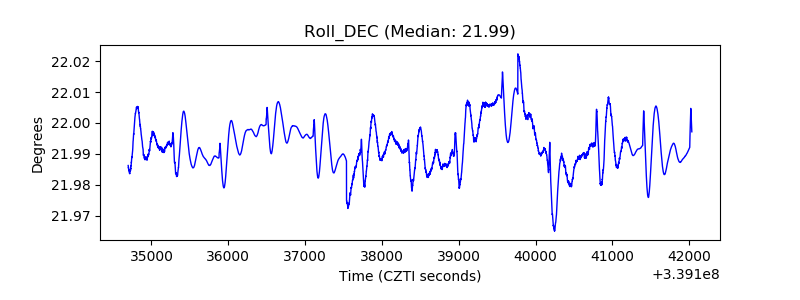 |
| _Roll_RA |  |
| Veto Counter | 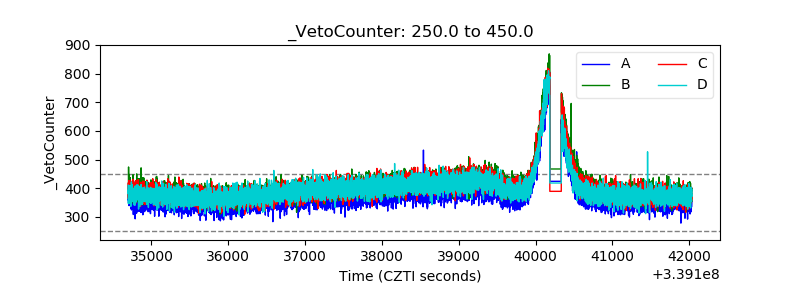 |