| Param | Original file | Final file |
|---|---|---|
| Filename | modeM0/AS1A09_120T02_9000003904_27076cztM0_level2.evt | modeM0/AS1A09_120T02_9000003904_27076cztM0_level2_quad_clean.evt |
| Size (bytes) | 257,616,000 | 33,779,520 |
| Size | 245.7 MB | 32.2 MB |
| Events in quadrant A | 1,731,942 | 192,832 |
| Events in quadrant B | 1,767,559 | 198,058 |
| Events in quadrant C | 1,691,015 | 190,998 |
| Events in quadrant D | 2,362,193 | 182,491 |
| Mode M0 | |||
|---|---|---|---|
| Quadrant | BADHDUFLAG | Total packets | Discarded packets |
| A | 0 | 7435 | 0 |
| B | 0 | 7535 | 0 |
| C | 0 | 7315 | 0 |
| D | 0 | 9385 | 0 |
| Quadrant | Total seconds | Saturated seconds | Saturation percentage |
|---|---|---|---|
| A | 3638 | 3 | 0.082463% |
| B | 3639 | 15 | 0.412201% |
| C | 3639 | 17 | 0.467161% |
| D | 3639 | 32 | 0.879362% |
Noise dominated data is calculated using 1-second bins in cleaned event files. If a bin has >2000 counts, and if more than 50% of those come from <1% of pixels, then it is considered to be noise-dominated and hence unusable.
| Quadrant | # 1 sec bins | Bins with >0 counts | Bins with >2000 counts | High rate bins dominated by noise | Noise dominated (total time) | Noise dominated (detector-on time) | Marked lightcurve |
|---|---|---|---|---|---|---|---|
| A | 3638 | 3638 | 0 | 0 | 0.00% | 0.00% | 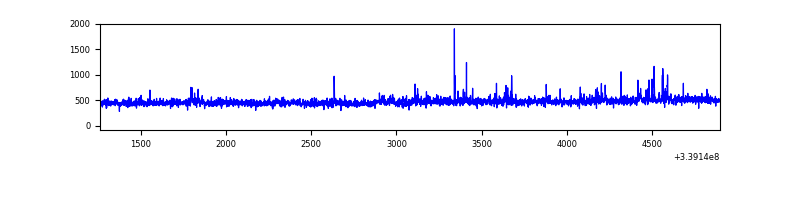 |
| B | 3639 | 3639 | 12 | 12 | 0.33% | 0.33% | 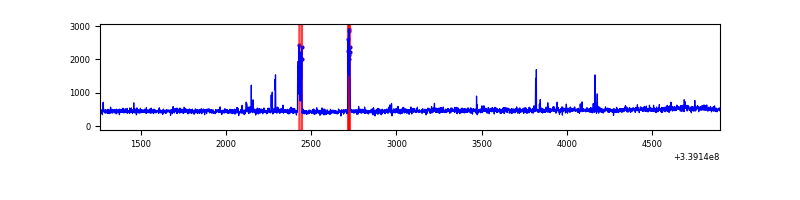 |
| C | 3639 | 3639 | 0 | 0 | 0.00% | 0.00% | 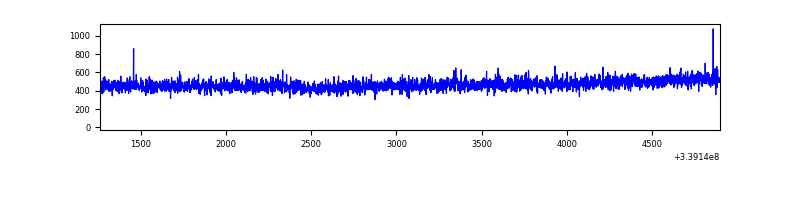 |
| D | 3639 | 3639 | 30 | 30 | 0.82% | 0.82% | 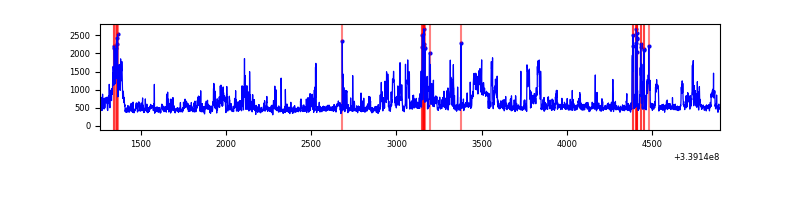 |
Top three noisy pixels from each quadrant. If the there are fewer than three noisy pixels in the level2.evt file, extra rows are filled as -1
| Pixel properties | Quadrant properties | ||||||
|---|---|---|---|---|---|---|---|
| Quadrant | DetID | PixID | Counts | Sigma | Mean | Median | Sigma |
| A | 14 | 235 | 45419 | 507.77 | 433 | 424 | 88.6 |
| A | 6 | 16 | 11609 | 126.22 | 433 | 424 | 88.6 |
| A | 5 | 203 | 5933 | 62.17 | 433 | 424 | 88.6 |
| B | 0 | 189 | 71001 | 838.54 | 428 | 419 | 84.2 |
| B | 12 | 111 | 9682 | 110.05 | 428 | 419 | 84.2 |
| B | 11 | 111 | 8939 | 101.22 | 428 | 419 | 84.2 |
| C | 14 | 238 | 67655 | 677.99 | 415 | 418 | 99.2 |
| C | 13 | 61 | 2959 | 25.62 | 415 | 418 | 99.2 |
| C | 15 | 208 | 2804 | 24.05 | 415 | 418 | 99.2 |
| D | 1 | 52 | 652138 | 6434.19 | 418 | 407 | 101.3 |
| D | 2 | 250 | 71645 | 703.29 | 418 | 407 | 101.3 |
| D | 13 | 85 | 40775 | 398.53 | 418 | 407 | 101.3 |
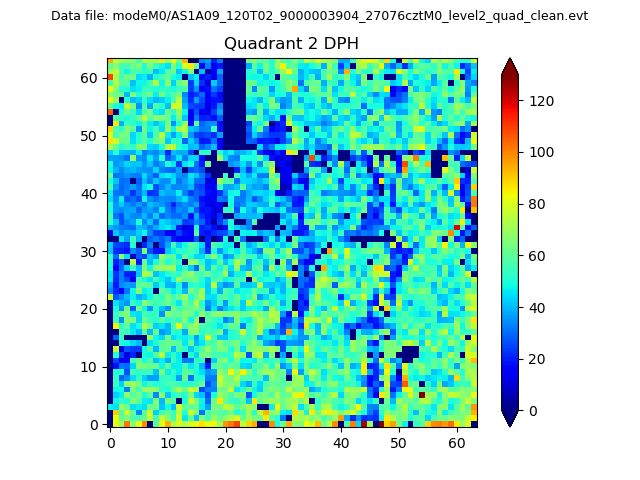
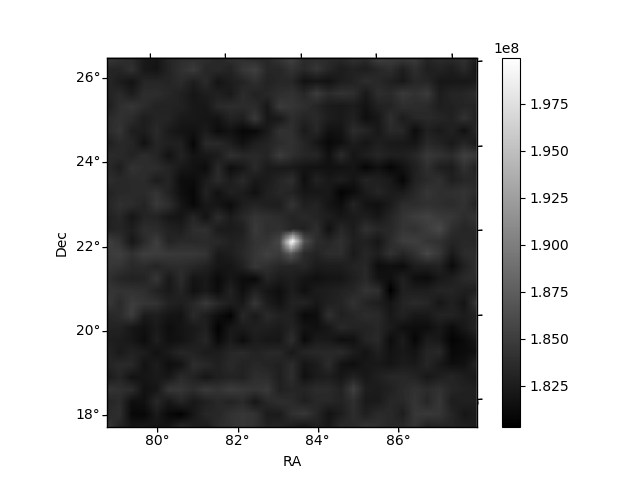
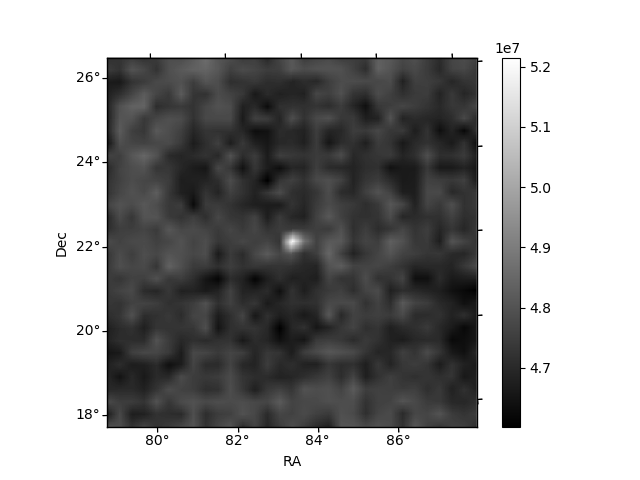
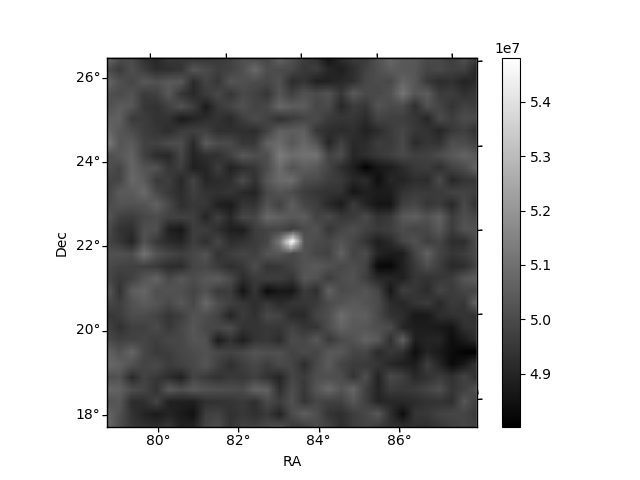
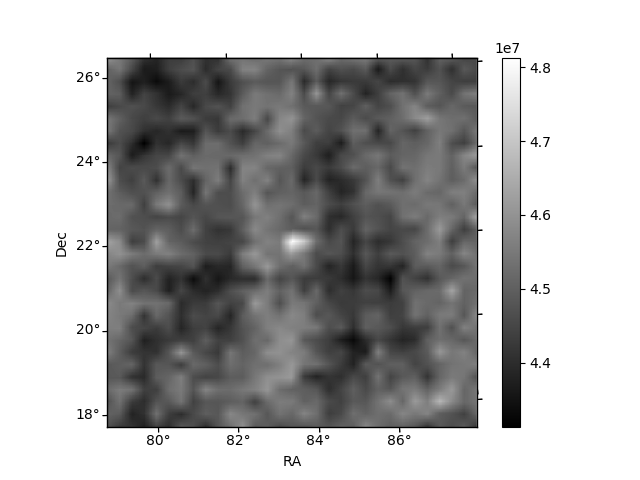
Histogram calculated using DETX and DETY for each event in the final _common_clean file
| Quadrant A | 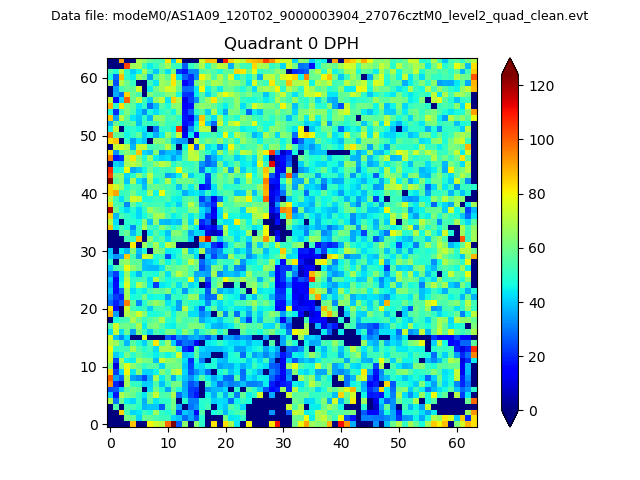 |
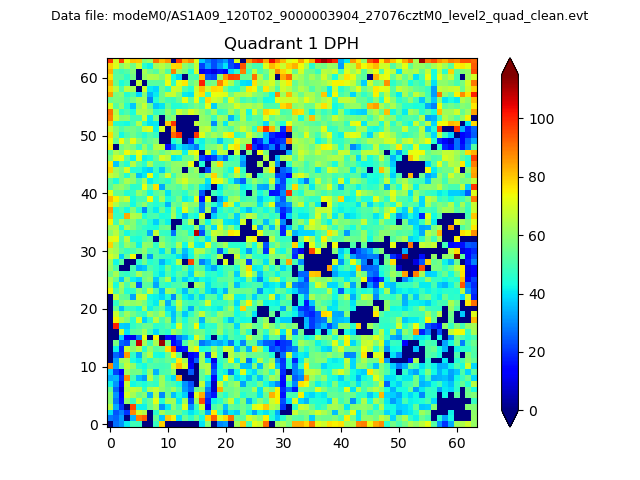 |
Quadrant B |
|---|---|---|---|
| Quadrant D | 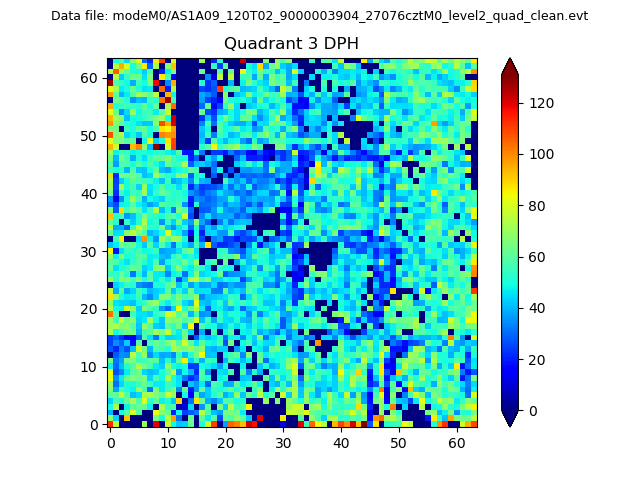 |
 |
Quadrant C |
| Plot type | Count rate plots | Images |
|---|---|---|
| Comparison with Poisson distribution Blue bars denote a histogram of data divided into 1 sec bins. Red curve is a Poisson curve with rate = median count rate of data. |
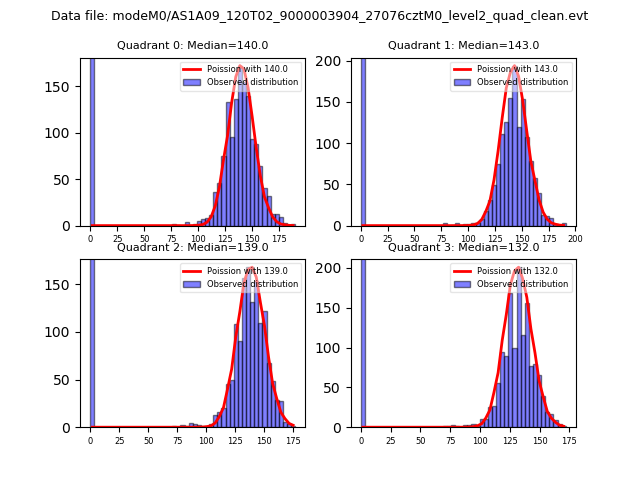 |
 |
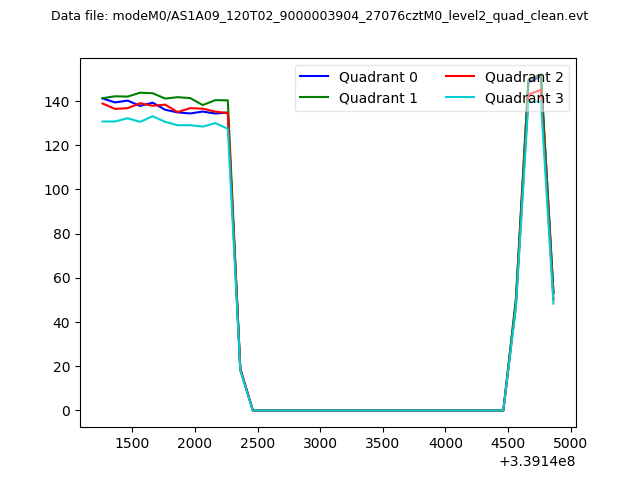
| Quadrant-wise count rates Data is divided into 100 sec bins |
 |
|
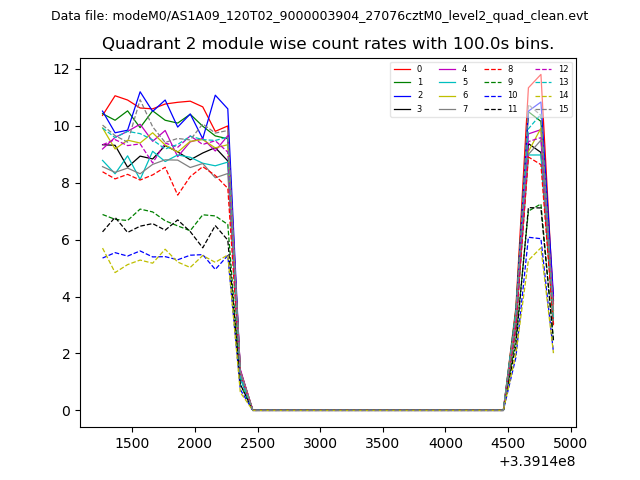
| Module-wise count rates for Quadrant A Data is divided into 100 sec bins |
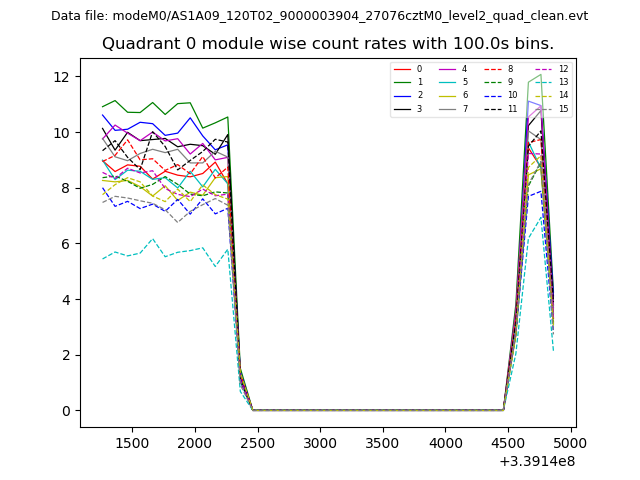 |
 |
| Module-wise count rates for Quadrant B Data is divided into 100 sec bins |
 |
 |
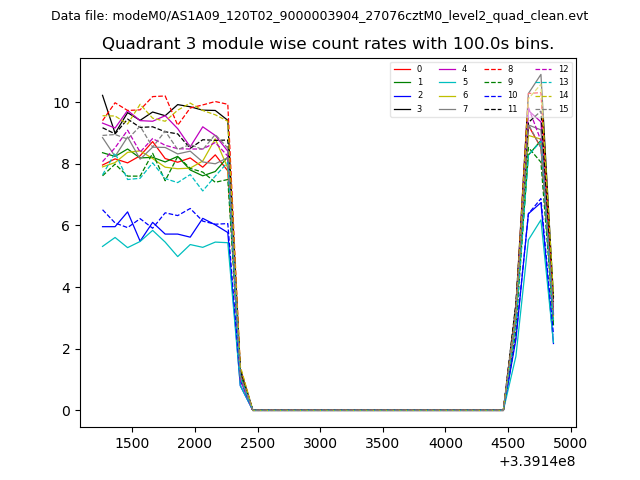
| Module-wise count rates for Quadrant C Data is divided into 100 sec bins |
 |
 |
| Module-wise count rates for Quadrant D Data is divided into 100 sec bins |
 |
 |
| Parameter | Plot |
|---|---|
| CZT HV Monitor | 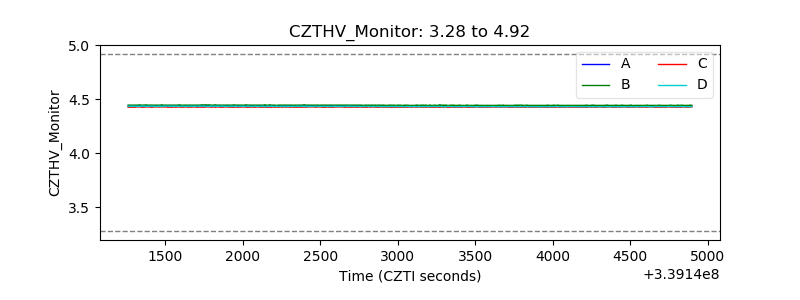 |
| D_VDD | 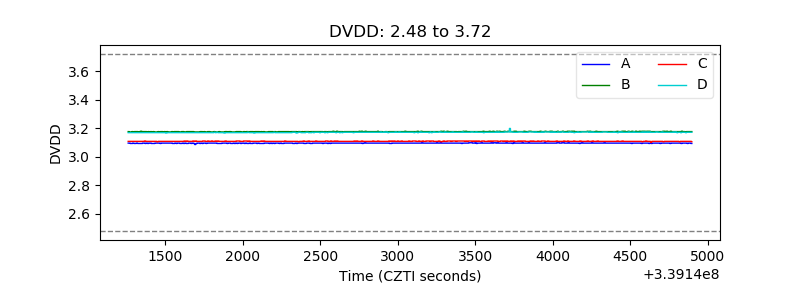 |
| Temperature 1 | 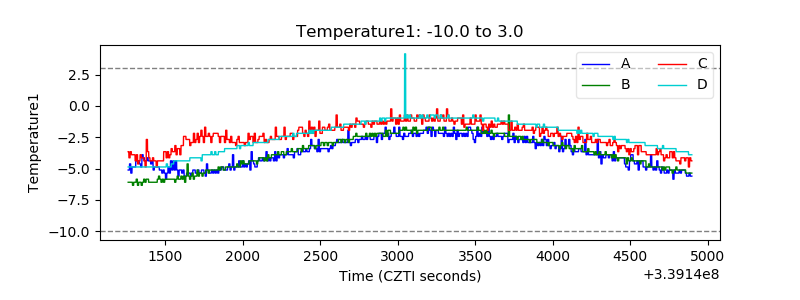 |
| Veto HV Monitor | 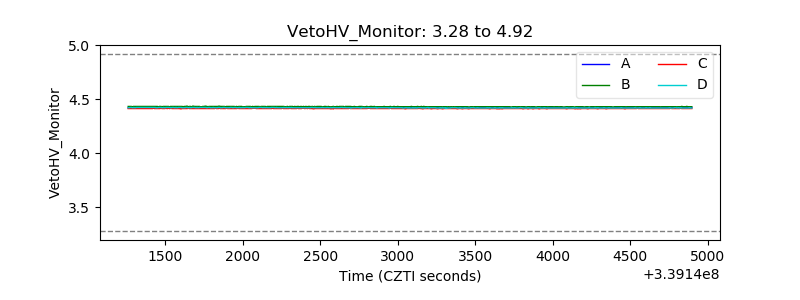 |
| Veto LLD |  |
| Alpha Counter | 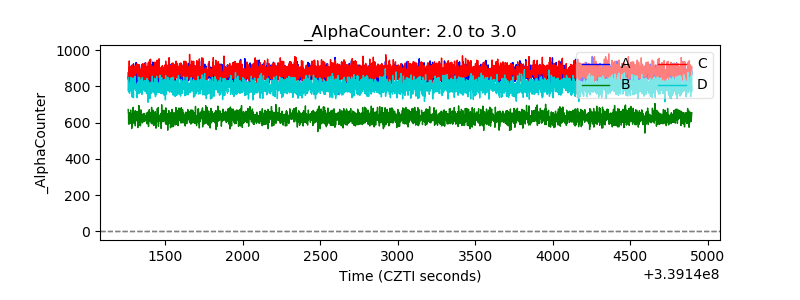 |
| _CPM_Rate | 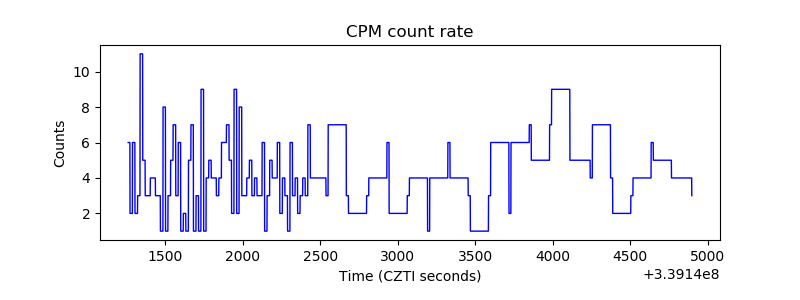 |
| CZT Counter | 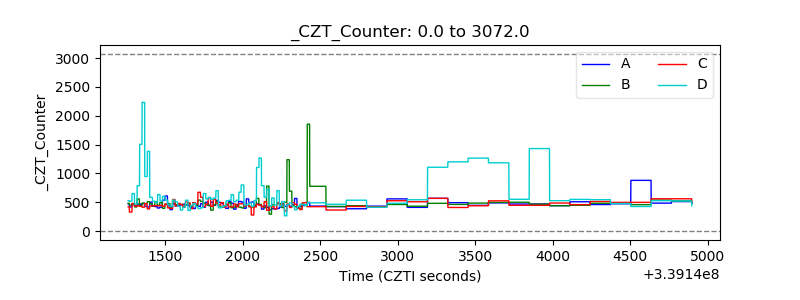 |
| +2.5 Volts monitor |  |
| +5 Volts monitor | 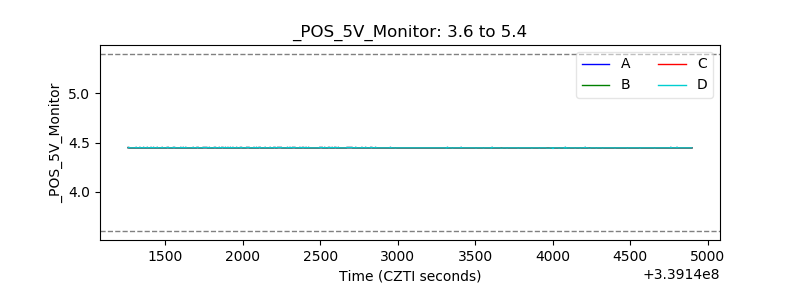 |
| _ROLL_ROT |  |
| _Roll_DEC | 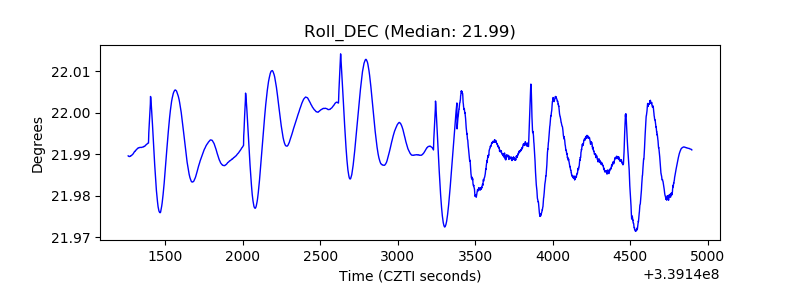 |
| _Roll_RA | 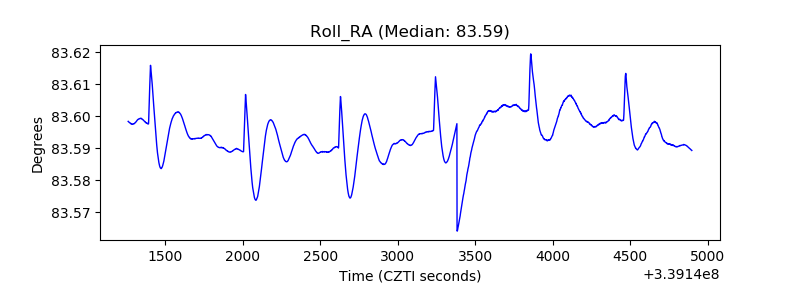 |
| Veto Counter | 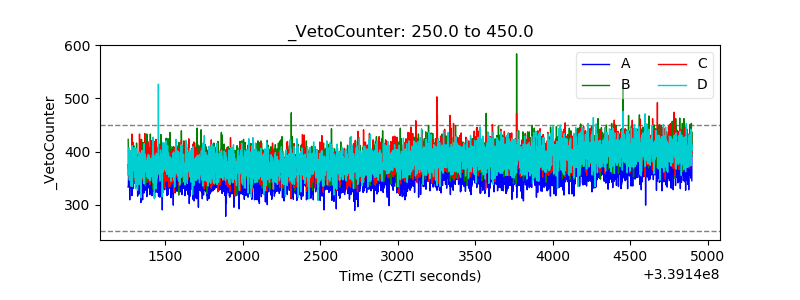 |