| Param | Original file | Final file |
|---|---|---|
| Filename | modeM0/AS1T03_241T01_9000003902cztM0_level2.fits | modeM0/AS1T03_241T01_9000003902cztM0_level2_quad_clean.evt |
| Size (bytes) | 94,449,600 | 85,870,080 |
| Size | 90.1 MB | 81.9 MB |
| Events in quadrant A | 473,118 | 347,202 |
| Events in quadrant B | 579,262 | 549,891 |
| Events in quadrant C | 593,794 | 529,464 |
| Events in quadrant D | 512,672 | 473,236 |
| Mode M9 | |||
|---|---|---|---|
| Quadrant | BADHDUFLAG | Total packets | Discarded packets |
| A | 0 | 19 | 0 |
| B | 0 | 19 | 0 |
| C | 0 | 19 | 0 |
| D | 0 | 19 | 0 |
| Mode M0 | |||
|---|---|---|---|
| Quadrant | BADHDUFLAG | Total packets | Discarded packets |
| A | 0 | 49017 | 0 |
| B | 0 | 21733 | 0 |
| C | 0 | 21168 | 0 |
| D | 0 | 25275 | 0 |
| Mode SS | |||
|---|---|---|---|
| Quadrant | BADHDUFLAG | Total packets | Discarded packets |
| A | 0 | 206 | 0 |
| B | 0 | 206 | 0 |
| C | 0 | 206 | 0 |
| D | 0 | 206 | 0 |
| Quadrant | Total seconds | Saturated seconds | Saturation percentage |
|---|---|---|---|
| A | 10099 | 3995 | 39.558372% |
| B | 10099 | 85 | 0.841667% |
| C | 10099 | 140 | 1.386276% |
| D | 10099 | 415 | 4.109318% |
Noise dominated data is calculated using 1-second bins in cleaned event files. If a bin has >2000 counts, and if more than 50% of those come from <1% of pixels, then it is considered to be noise-dominated and hence unusable.
| Quadrant | # 1 sec bins | Bins with >0 counts | Bins with >2000 counts | High rate bins dominated by noise | Noise dominated (total time) | Noise dominated (detector-on time) | Marked lightcurve |
|---|---|---|---|---|---|---|---|
| A | 12038 | 10072 | 0 | 0 | 0.00% | 0.00% | 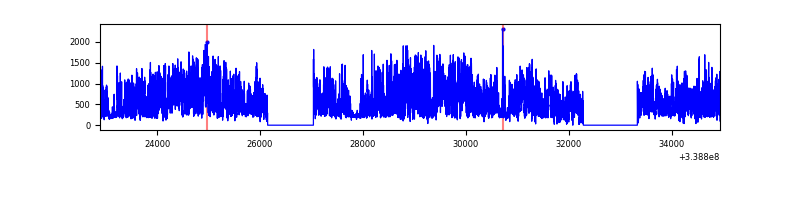 |
| B | 12039 | 10097 | 0 | 0 | 0.00% | 0.00% | 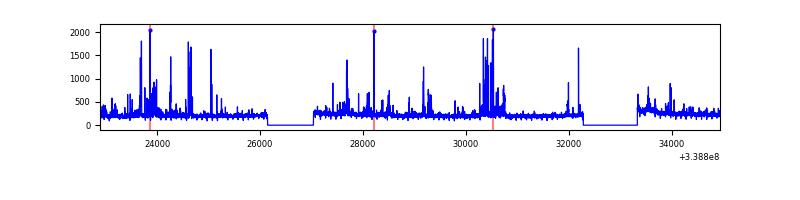 |
| C | 12039 | 10097 | 0 | 0 | 0.00% | 0.00% |  |
| D | 12039 | 10092 | 0 | 0 | 0.00% | 0.00% |  |
Top three noisy pixels from each quadrant. If the there are fewer than three noisy pixels in the level2.evt file, extra rows are filled as -1
| Pixel properties | Quadrant properties | ||||||
|---|---|---|---|---|---|---|---|
| Quadrant | DetID | PixID | Counts | Sigma | Mean | Median | Sigma |
| A | 14 | 188 | 462 | 10.81 | 123 | 116 | 32.0 |
| A | 0 | 29 | 410 | 9.19 | 123 | 116 | 32.0 |
| A | 14 | 204 | 400 | 8.87 | 123 | 116 | 32.0 |
| B | 2 | 9 | 493 | 10.94 | 153 | 146 | 31.7 |
| B | 2 | 8 | 401 | 8.04 | 153 | 146 | 31.7 |
| B | 5 | 128 | 385 | 7.53 | 153 | 146 | 31.7 |
| C | 12 | 241 | 462 | 7.75 | 156 | 147 | 40.7 |
| C | 1 | 81 | 458 | 7.65 | 156 | 147 | 40.7 |
| C | 1 | 80 | 453 | 7.53 | 156 | 147 | 40.7 |
| D | 10 | 189 | 401 | 6.52 | 146 | 133 | 41.1 |
| D | 6 | 83 | 377 | 5.94 | 146 | 133 | 41.1 |
| D | 6 | 62 | 356 | 5.43 | 146 | 133 | 41.1 |
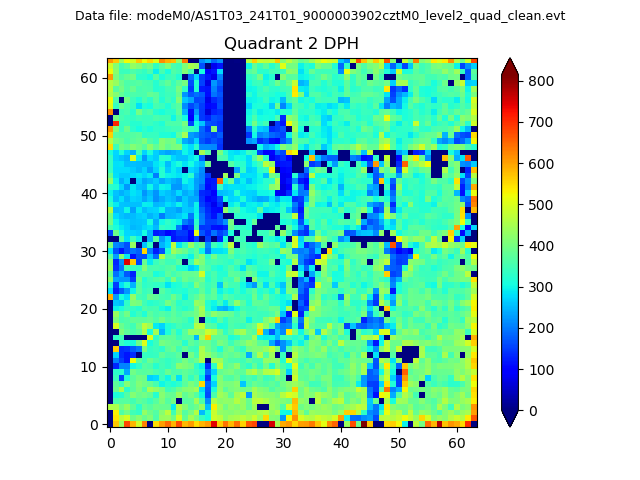
Histogram calculated using DETX and DETY for each event in the final _common_clean file
| Quadrant A | 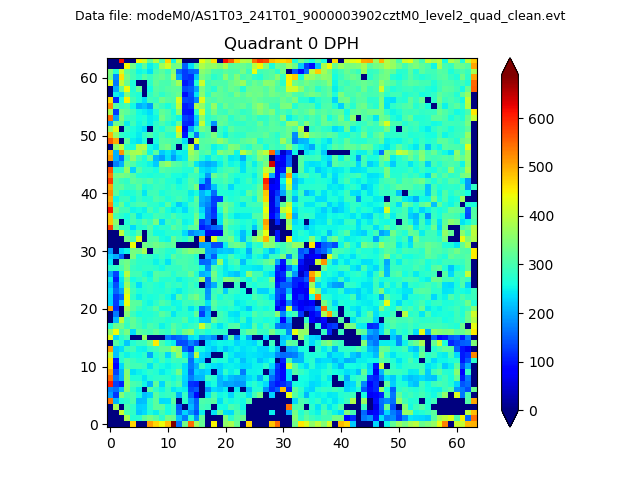 |
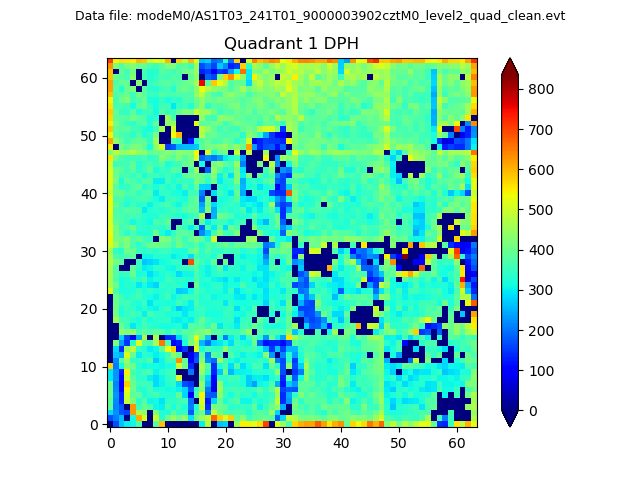 |
Quadrant B |
|---|---|---|---|
| Quadrant D |  |
 |
Quadrant C |
| Plot type | Count rate plots | Images |
|---|---|---|
| Comparison with Poisson distribution Blue bars denote a histogram of data divided into 1 sec bins. Red curve is a Poisson curve with rate = median count rate of data. |
 |
 |
| Quadrant-wise count rates Data is divided into 100 sec bins |
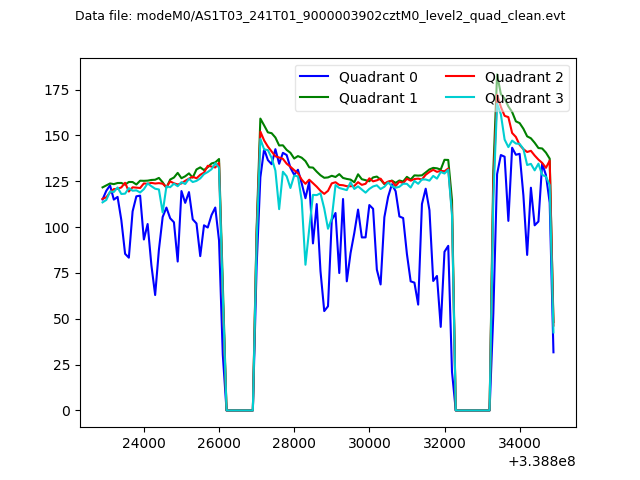 |
|
| Module-wise count rates for Quadrant A Data is divided into 100 sec bins |
 |
 |
| Module-wise count rates for Quadrant B Data is divided into 100 sec bins |
 |
 |
| Module-wise count rates for Quadrant C Data is divided into 100 sec bins |
 |
 |
| Module-wise count rates for Quadrant D Data is divided into 100 sec bins |
 |
 |
| Parameter | Plot |
|---|---|
| CZT HV Monitor | 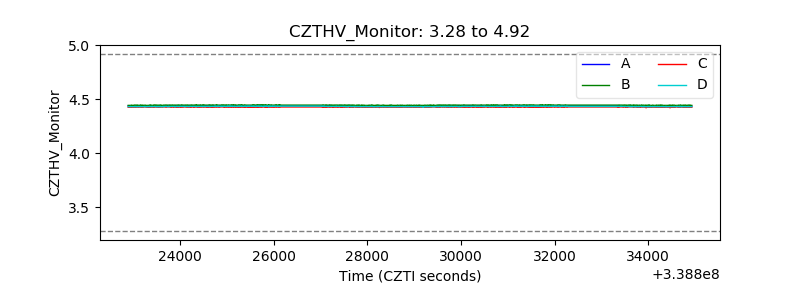 |
| D_VDD | 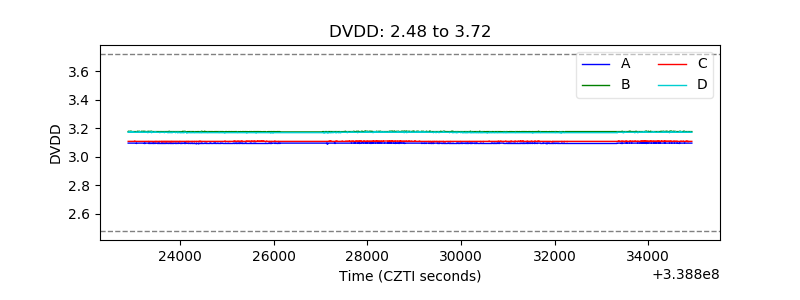 |
| Temperature 1 |  |
| Veto HV Monitor |  |
| Veto LLD | 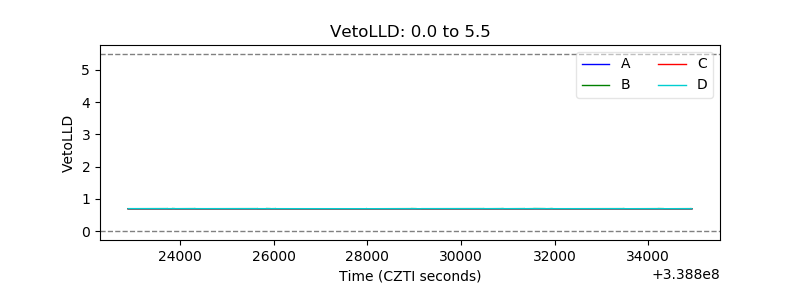 |
| Alpha Counter |  |
| _CPM_Rate | 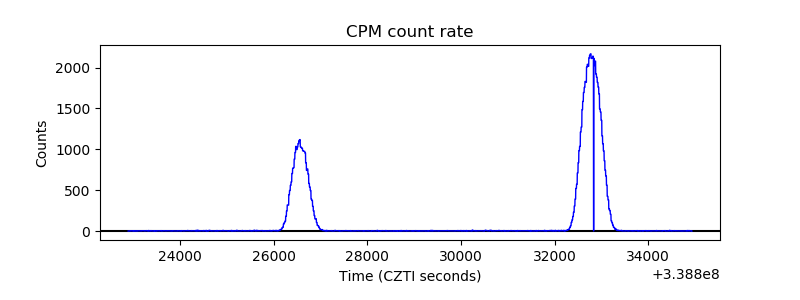 |
| CZT Counter |  |
| +2.5 Volts monitor | 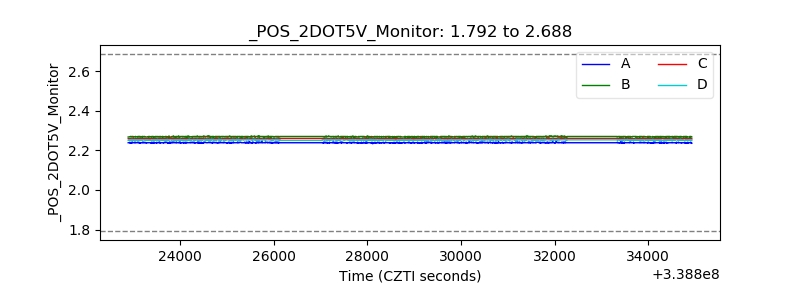 |
| +5 Volts monitor | 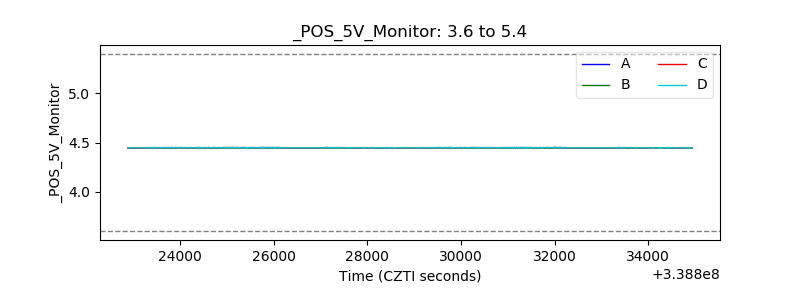 |
| _ROLL_ROT |  |
| _Roll_DEC |  |
| _Roll_RA |  |
| Veto Counter |  |