| Param | Original file | Final file |
|---|---|---|
| Filename | modeM0/AS1T03_241T01_9000003902_27019cztM0_level2.evt | modeM0/AS1T03_241T01_9000003902_27019cztM0_level2_quad_clean.evt |
| Size (bytes) | 456,690,240 | 88,801,920 |
| Size | 435.5 MB | 84.7 MB |
| Events in quadrant A | 6,026,876 | 528,807 |
| Events in quadrant B | 2,408,961 | 630,631 |
| Events in quadrant C | 2,256,901 | 609,500 |
| Events in quadrant D | 2,814,871 | 585,862 |
| Mode M9 | |||
|---|---|---|---|
| Quadrant | BADHDUFLAG | Total packets | Discarded packets |
| A | 0 | 9 | 0 |
| B | 0 | 9 | 0 |
| C | 0 | 9 | 0 |
| D | 0 | 9 | 0 |
| Mode M0 | |||
|---|---|---|---|
| Quadrant | BADHDUFLAG | Total packets | Discarded packets |
| A | 0 | 21158 | 0 |
| B | 0 | 10229 | 0 |
| C | 0 | 9767 | 0 |
| D | 0 | 11739 | 0 |
| Quadrant | Total seconds | Saturated seconds | Saturation percentage |
|---|---|---|---|
| A | 4758 | 1482 | 31.147541% |
| B | 4757 | 47 | 0.988018% |
| C | 4757 | 69 | 1.450494% |
| D | 4757 | 258 | 5.423586% |
Noise dominated data is calculated using 1-second bins in cleaned event files. If a bin has >2000 counts, and if more than 50% of those come from <1% of pixels, then it is considered to be noise-dominated and hence unusable.
| Quadrant | # 1 sec bins | Bins with >0 counts | Bins with >2000 counts | High rate bins dominated by noise | Noise dominated (total time) | Noise dominated (detector-on time) | Marked lightcurve |
|---|---|---|---|---|---|---|---|
| A | 5647 | 4757 | 1067 | 1067 | 18.89% | 22.43% | 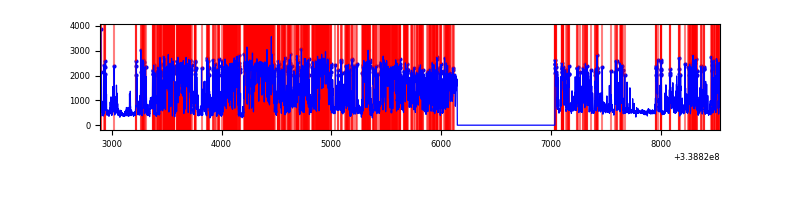 |
| B | 5647 | 4757 | 11 | 11 | 0.19% | 0.23% | 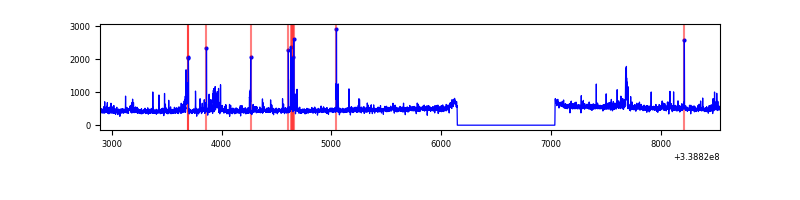 |
| C | 5647 | 4757 | 0 | 0 | 0.00% | 0.00% | 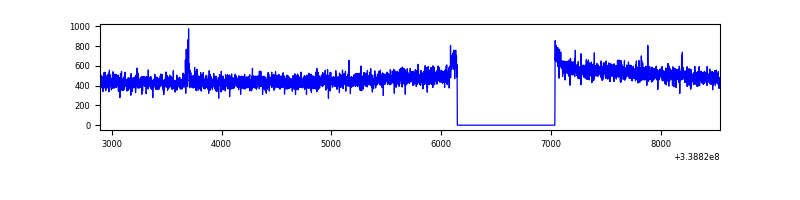 |
| D | 5647 | 4757 | 201 | 201 | 3.56% | 4.23% | 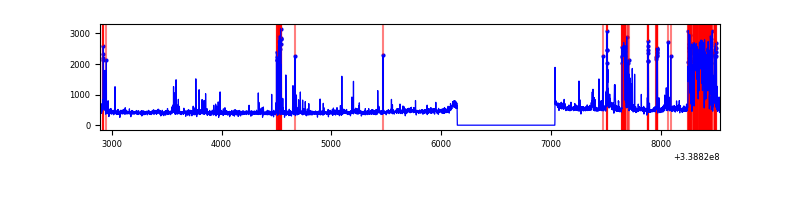 |
Top three noisy pixels from each quadrant. If the there are fewer than three noisy pixels in the level2.evt file, extra rows are filled as -1
| Pixel properties | Quadrant properties | ||||||
|---|---|---|---|---|---|---|---|
| Quadrant | DetID | PixID | Counts | Sigma | Mean | Median | Sigma |
| A | 14 | 235 | 4059372 | 39774.32 | 502 | 490 | 102.0 |
| A | 8 | 192 | 12335 | 116.07 | 502 | 490 | 102.0 |
| A | 0 | 13 | 8719 | 80.64 | 502 | 490 | 102.0 |
| B | 0 | 189 | 77263 | 699.81 | 569 | 554 | 109.6 |
| B | 3 | 64 | 75726 | 685.78 | 569 | 554 | 109.6 |
| B | 10 | 245 | 13784 | 120.7 | 569 | 554 | 109.6 |
| C | 14 | 238 | 89499 | 682.62 | 554 | 557 | 130.3 |
| C | 10 | 22 | 3935 | 25.93 | 554 | 557 | 130.3 |
| C | 13 | 61 | 3728 | 24.34 | 554 | 557 | 130.3 |
| D | 2 | 250 | 458650 | 3490.16 | 545 | 530 | 131.3 |
| D | 12 | 233 | 206513 | 1569.27 | 545 | 530 | 131.3 |
| D | 1 | 52 | 62277 | 470.42 | 545 | 530 | 131.3 |
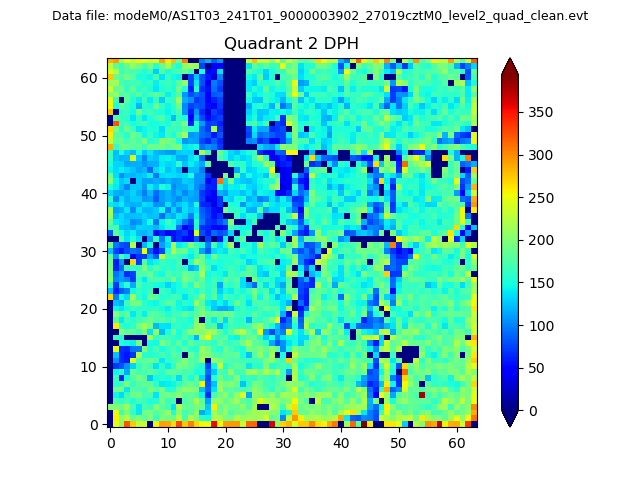
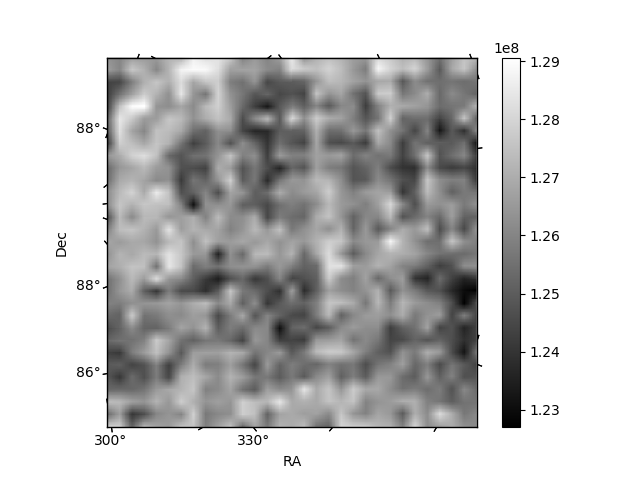
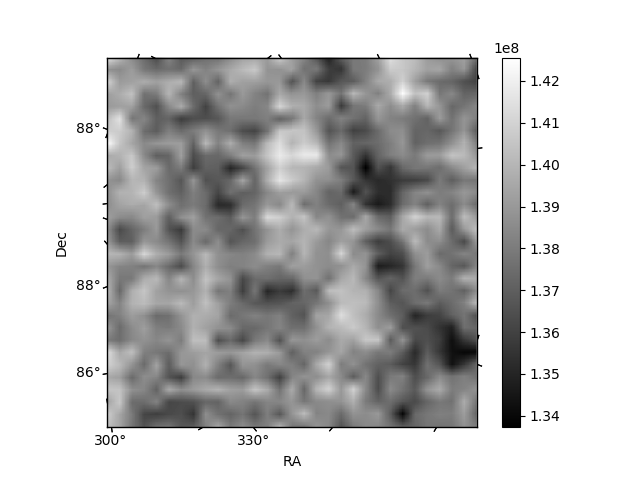
Histogram calculated using DETX and DETY for each event in the final _common_clean file
| Quadrant A | 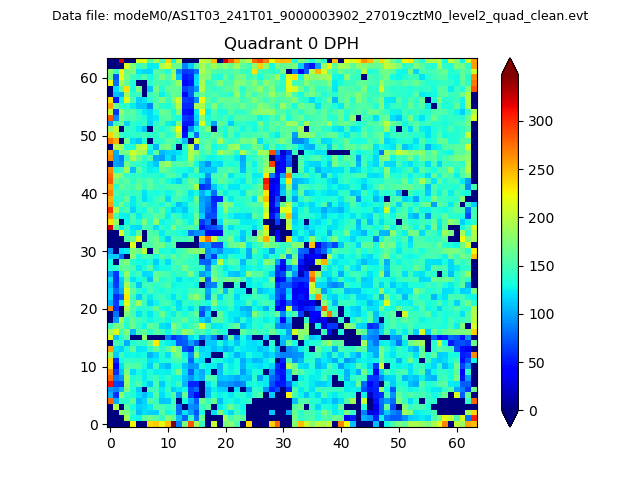 |
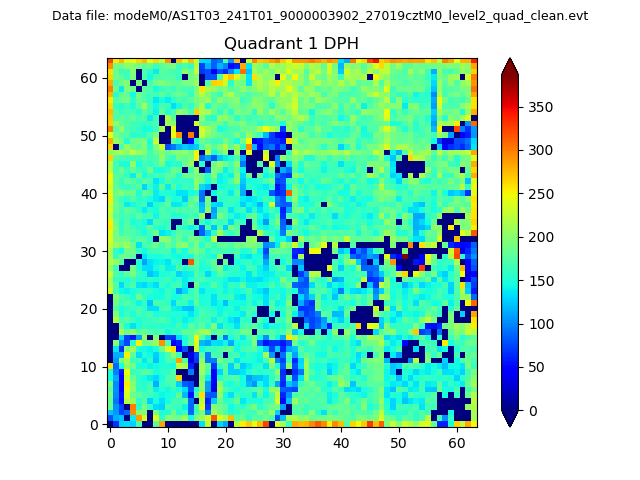 |
Quadrant B |
|---|---|---|---|
| Quadrant D | 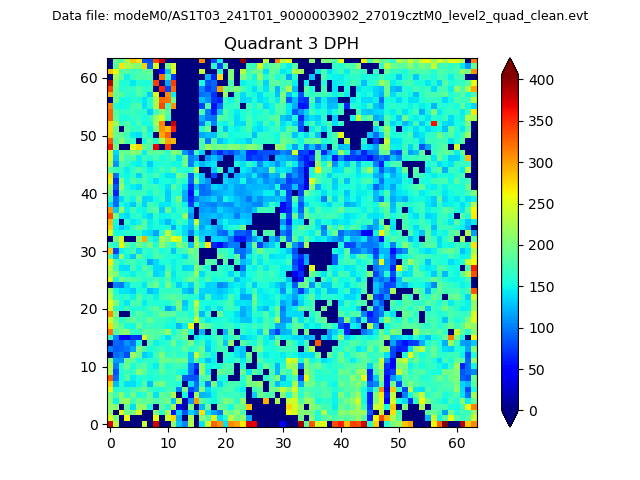 |
 |
Quadrant C |
| Plot type | Count rate plots | Images |
|---|---|---|
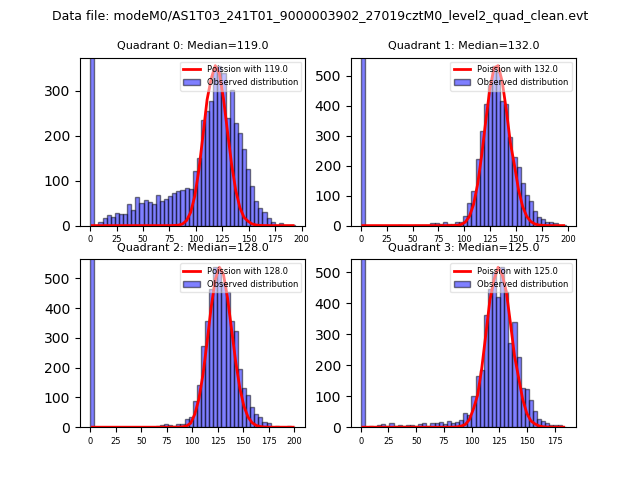
| Comparison with Poisson distribution Blue bars denote a histogram of data divided into 1 sec bins. Red curve is a Poisson curve with rate = median count rate of data. |
 |
 |
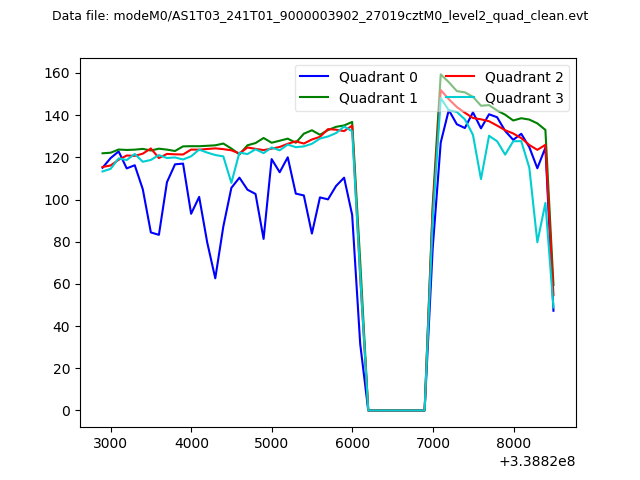
| Quadrant-wise count rates Data is divided into 100 sec bins |
 |
|
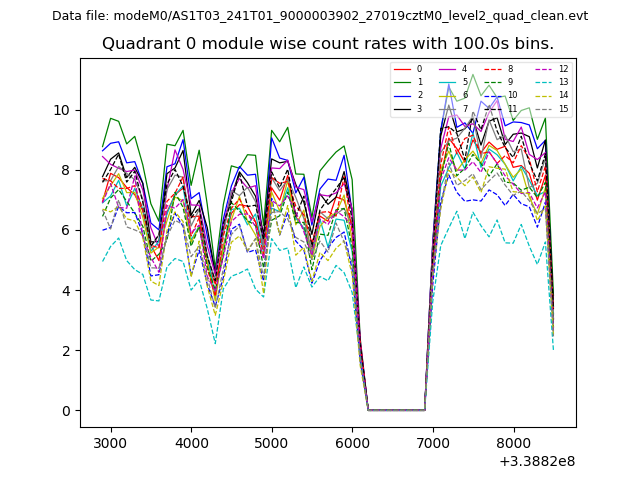
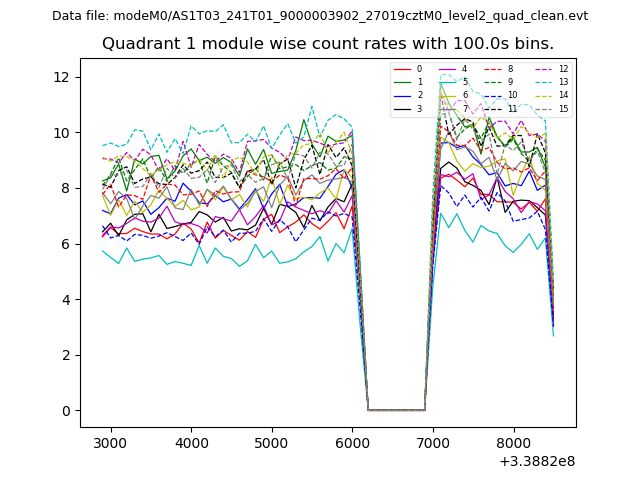
| Module-wise count rates for Quadrant A Data is divided into 100 sec bins |
 |
 |
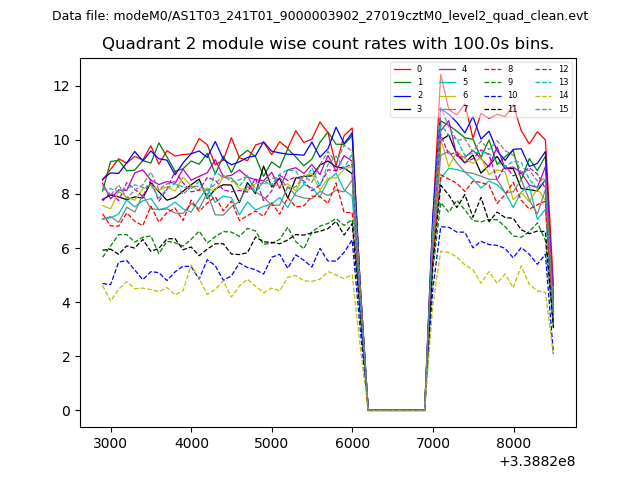
| Module-wise count rates for Quadrant B Data is divided into 100 sec bins |
 |
 |
| Module-wise count rates for Quadrant C Data is divided into 100 sec bins |
 |
 |
| Module-wise count rates for Quadrant D Data is divided into 100 sec bins |
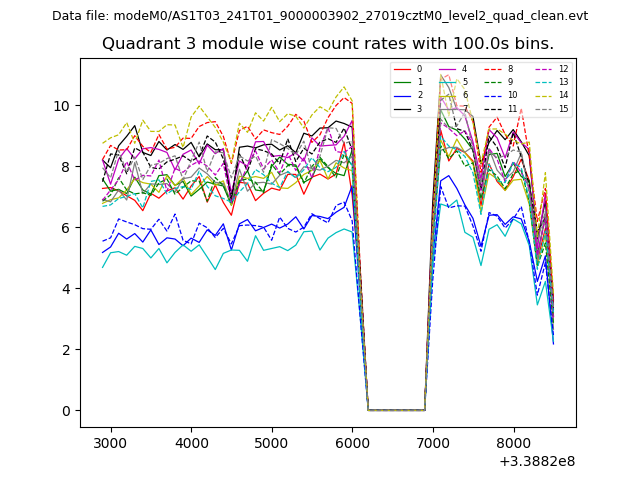 |
 |
| Parameter | Plot |
|---|---|
| CZT HV Monitor | 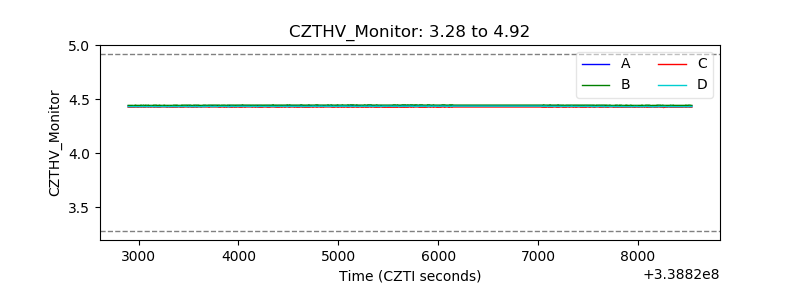 |
| D_VDD | 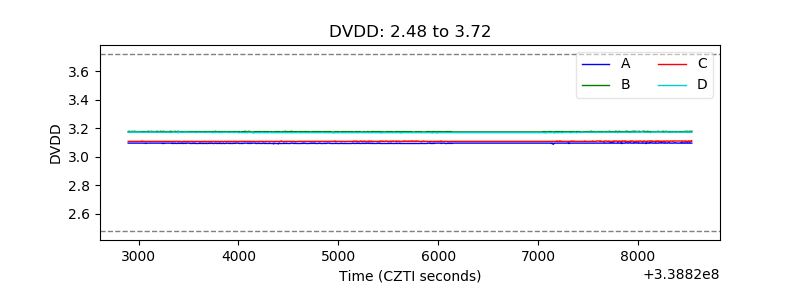 |
| Temperature 1 | 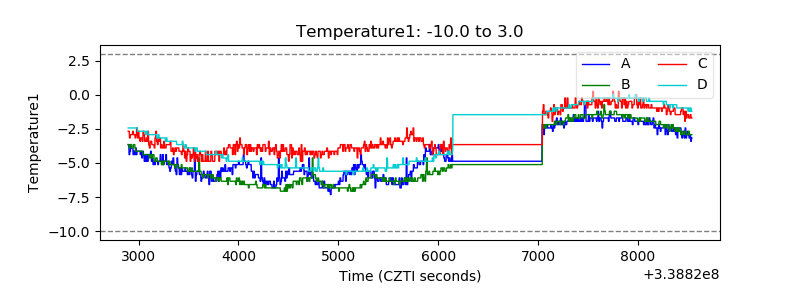 |
| Veto HV Monitor |  |
| Veto LLD |  |
| Alpha Counter | 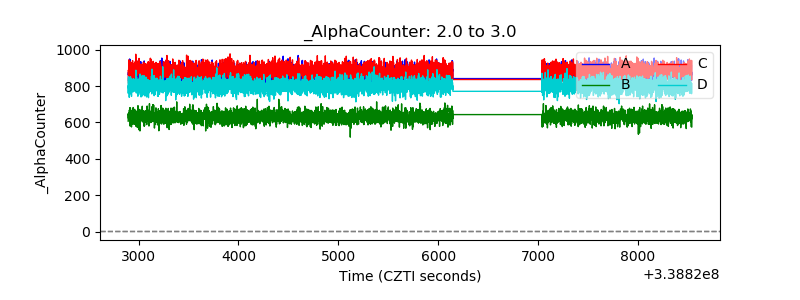 |
| _CPM_Rate | 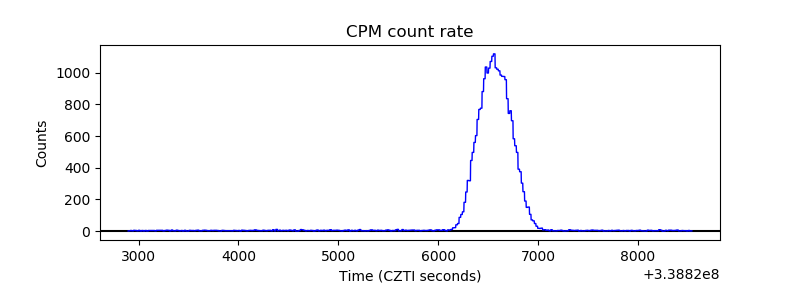 |
| CZT Counter | 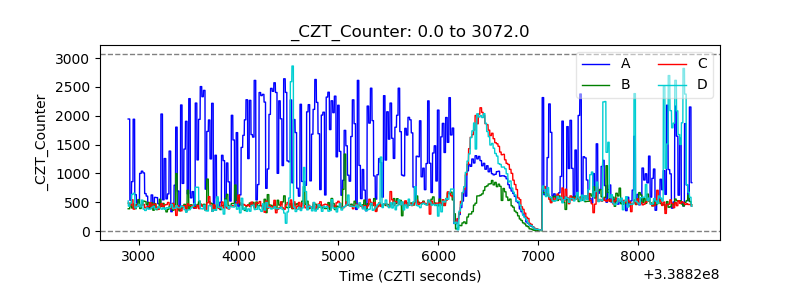 |
| +2.5 Volts monitor |  |
| +5 Volts monitor |  |
| _ROLL_ROT | 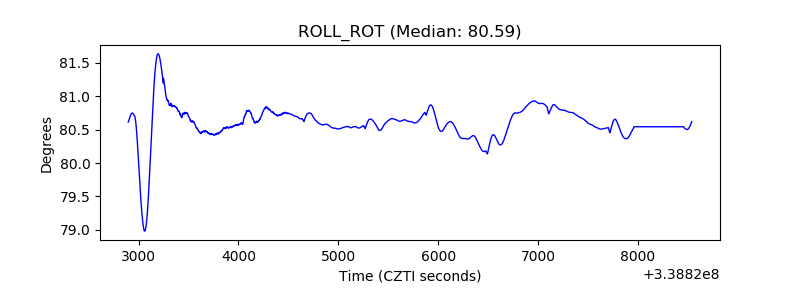 |
| _Roll_DEC | 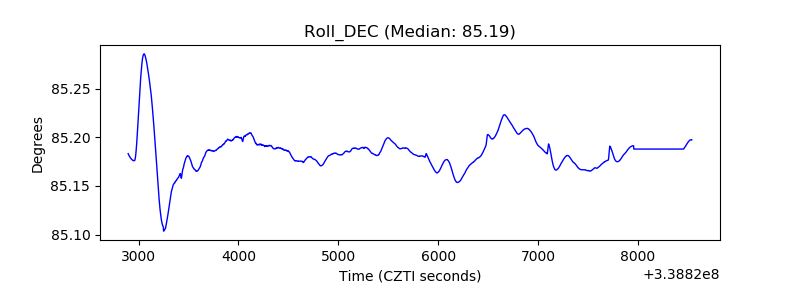 |
| _Roll_RA | 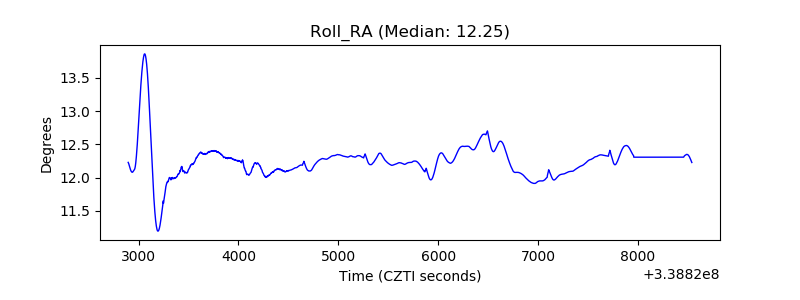 |
| Veto Counter | 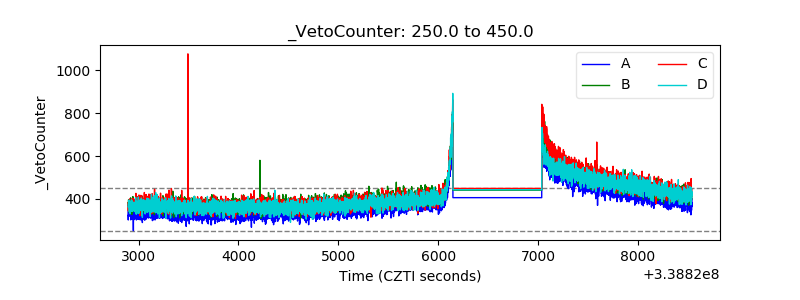 |