| Param | Original file | Final file |
|---|---|---|
| Filename | modeM0/AS1T03_241T01_9000003902_27020cztM0_level2.evt | modeM0/AS1T03_241T01_9000003902_27020cztM0_level2_quad_clean.evt |
| Size (bytes) | 611,444,160 | 108,711,360 |
| Size | 583.1 MB | 103.7 MB |
| Events in quadrant A | 8,511,443 | 589,273 |
| Events in quadrant B | 2,936,145 | 794,970 |
| Events in quadrant C | 2,838,689 | 765,813 |
| Events in quadrant D | 3,836,238 | 733,887 |
| Mode M9 | |||
|---|---|---|---|
| Quadrant | BADHDUFLAG | Total packets | Discarded packets |
| A | 0 | 10 | 0 |
| B | 0 | 10 | 0 |
| C | 0 | 10 | 0 |
| D | 0 | 10 | 0 |
| Mode M0 | |||
|---|---|---|---|
| Quadrant | BADHDUFLAG | Total packets | Discarded packets |
| A | 0 | 29277 | 0 |
| B | 0 | 12562 | 0 |
| C | 0 | 12348 | 0 |
| D | 0 | 15501 | 0 |
| Quadrant | Total seconds | Saturated seconds | Saturation percentage |
|---|---|---|---|
| A | 5821 | 2552 | 43.841264% |
| B | 5822 | 40 | 0.687049% |
| C | 5822 | 79 | 1.356922% |
| D | 5822 | 297 | 5.101340% |
Noise dominated data is calculated using 1-second bins in cleaned event files. If a bin has >2000 counts, and if more than 50% of those come from <1% of pixels, then it is considered to be noise-dominated and hence unusable.
| Quadrant | # 1 sec bins | Bins with >0 counts | Bins with >2000 counts | High rate bins dominated by noise | Noise dominated (total time) | Noise dominated (detector-on time) | Marked lightcurve |
|---|---|---|---|---|---|---|---|
| A | 6871 | 5821 | 1897 | 1897 | 27.61% | 32.59% | 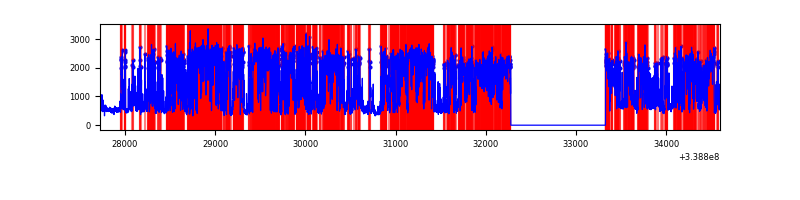 |
| B | 6872 | 5822 | 8 | 8 | 0.12% | 0.14% | 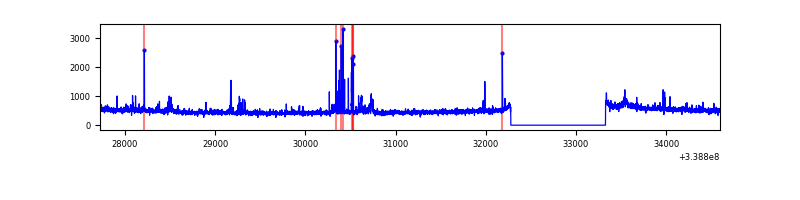 |
| C | 6872 | 5822 | 5 | 5 | 0.07% | 0.09% | 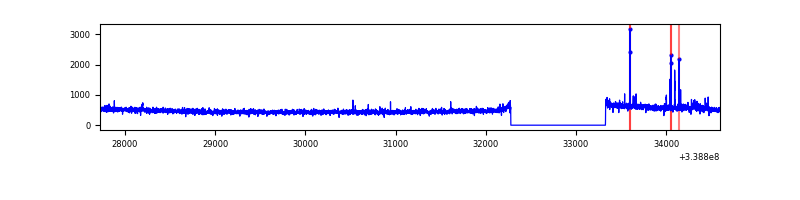 |
| D | 6872 | 5822 | 250 | 250 | 3.64% | 4.29% | 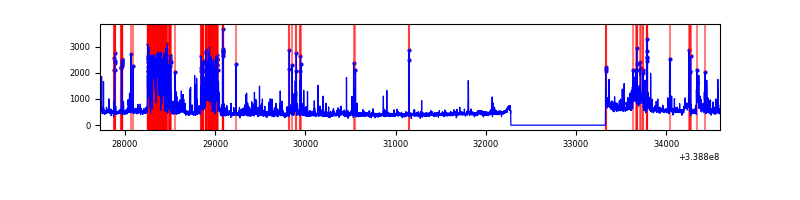 |
Top three noisy pixels from each quadrant. If the there are fewer than three noisy pixels in the level2.evt file, extra rows are filled as -1
| Pixel properties | Quadrant properties | ||||||
|---|---|---|---|---|---|---|---|
| Quadrant | DetID | PixID | Counts | Sigma | Mean | Median | Sigma |
| A | 14 | 235 | 6327112 | 57092.92 | 553 | 542 | 110.8 |
| A | 6 | 16 | 30776 | 272.84 | 553 | 542 | 110.8 |
| A | 0 | 13 | 9113 | 77.35 | 553 | 542 | 110.8 |
| B | 3 | 64 | 95055 | 717.49 | 701 | 683 | 131.5 |
| B | 0 | 189 | 64689 | 486.62 | 701 | 683 | 131.5 |
| B | 12 | 111 | 15812 | 115.02 | 701 | 683 | 131.5 |
| C | 14 | 238 | 110159 | 686.06 | 685 | 689 | 159.6 |
| C | 15 | 208 | 51613 | 319.15 | 685 | 689 | 159.6 |
| C | 13 | 61 | 4643 | 24.78 | 685 | 689 | 159.6 |
| D | 2 | 250 | 759548 | 4712.11 | 678 | 659 | 161.1 |
| D | 1 | 52 | 231519 | 1433.46 | 678 | 659 | 161.1 |
| D | 12 | 233 | 129378 | 799.24 | 678 | 659 | 161.1 |
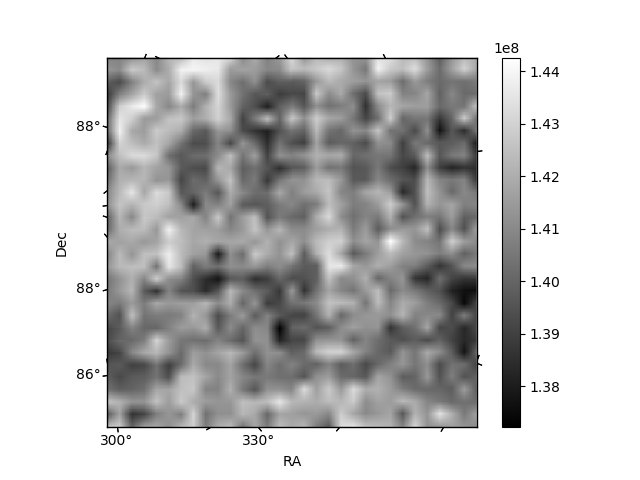
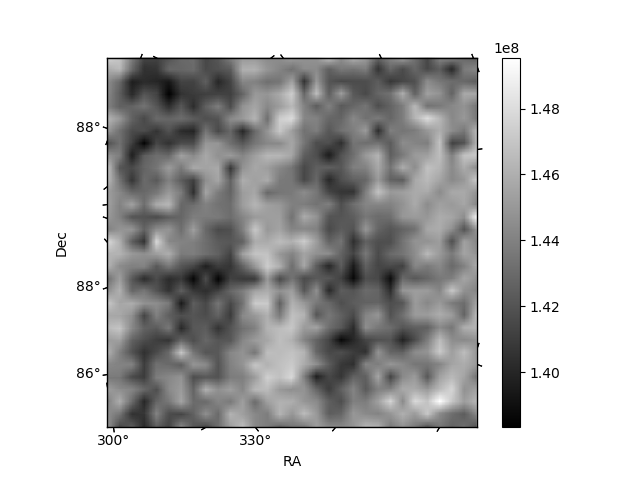
Histogram calculated using DETX and DETY for each event in the final _common_clean file
| Quadrant A | 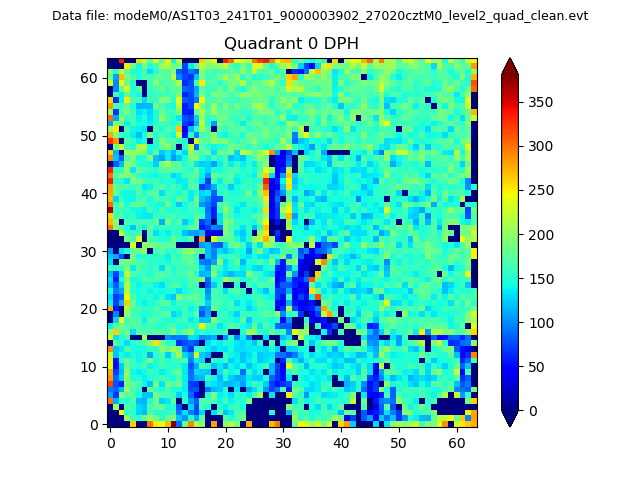 |
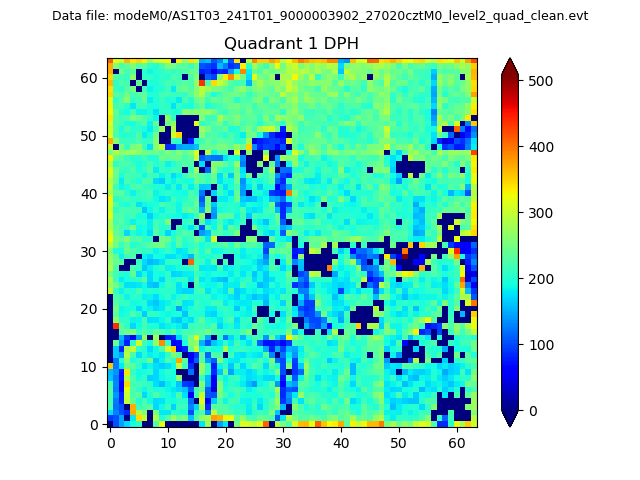 |
Quadrant B |
|---|---|---|---|
| Quadrant D | 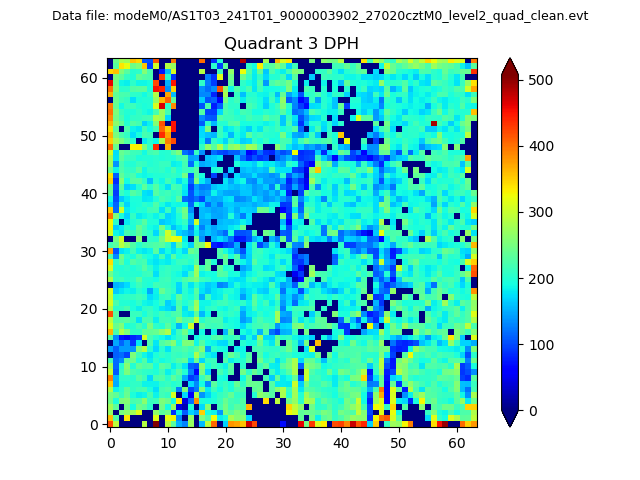 |
 |
Quadrant C |
| Plot type | Count rate plots | Images |
|---|---|---|
| Comparison with Poisson distribution Blue bars denote a histogram of data divided into 1 sec bins. Red curve is a Poisson curve with rate = median count rate of data. |
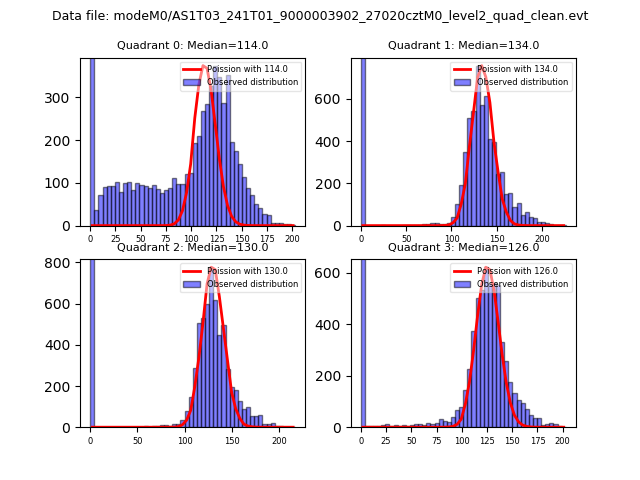 |
 |
| Quadrant-wise count rates Data is divided into 100 sec bins |
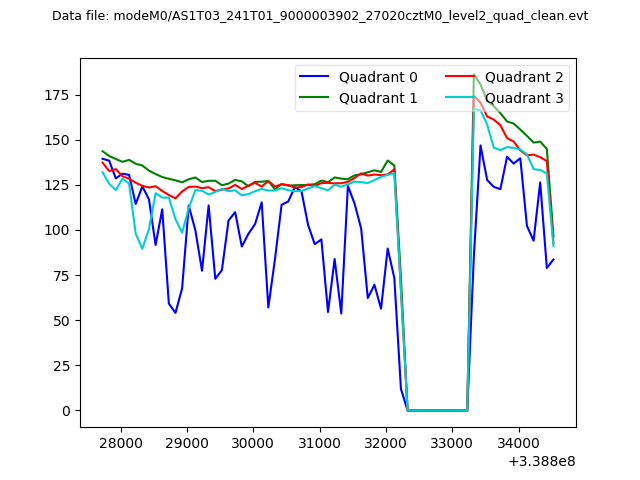 |
|
| Module-wise count rates for Quadrant A Data is divided into 100 sec bins |
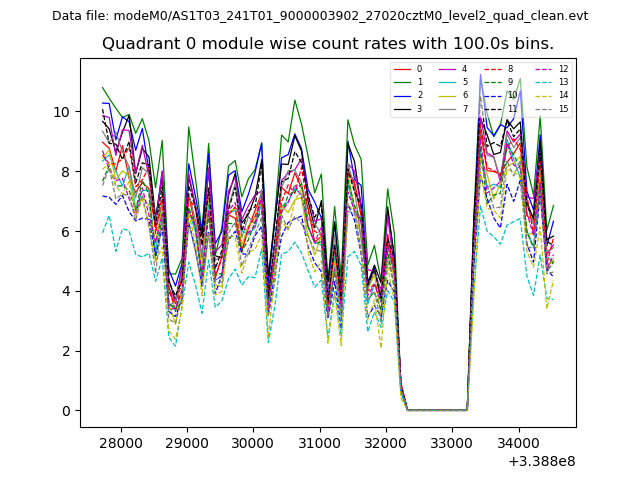 |
 |
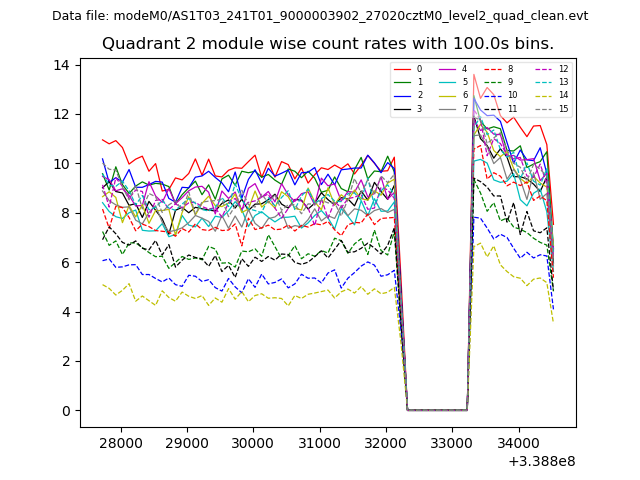
| Module-wise count rates for Quadrant B Data is divided into 100 sec bins |
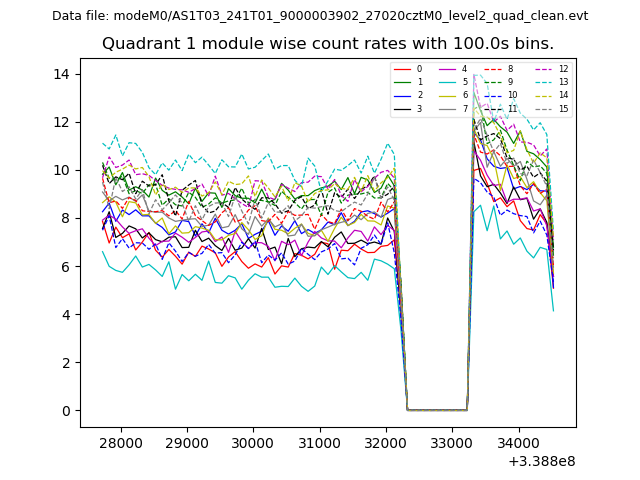 |
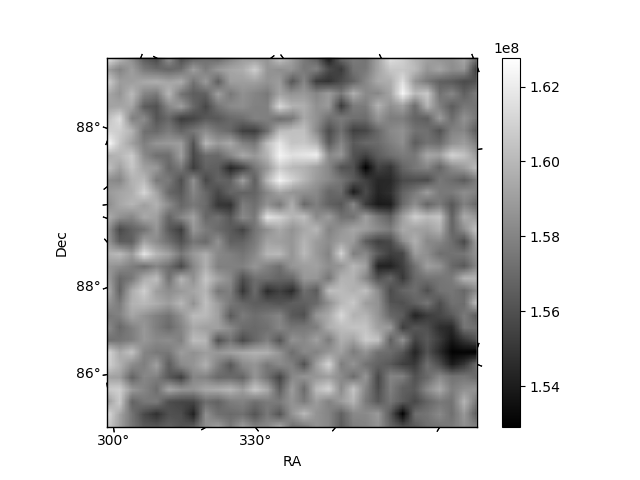 |
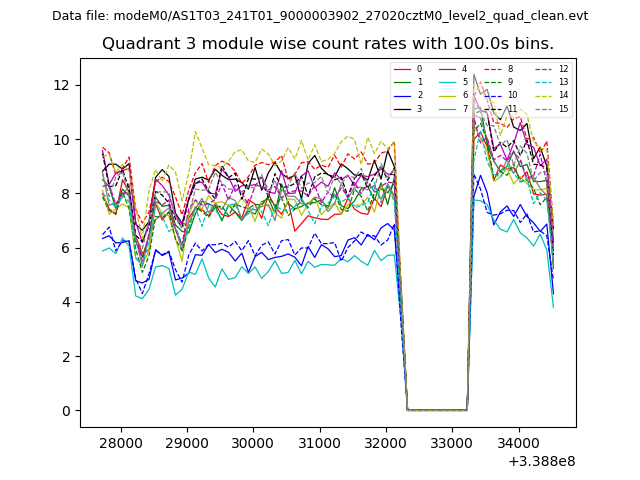
| Module-wise count rates for Quadrant C Data is divided into 100 sec bins |
 |
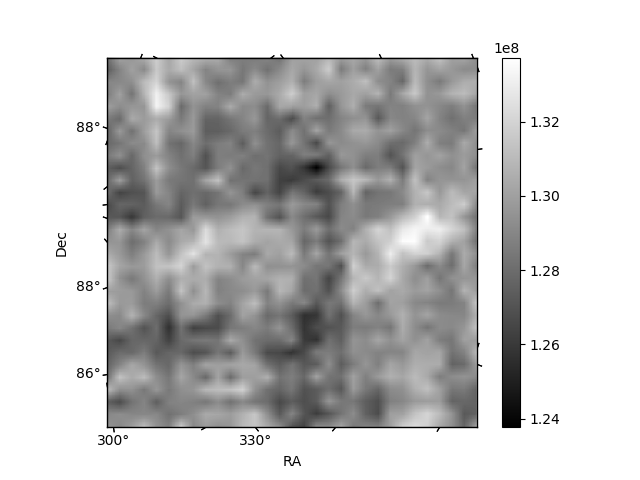 |
| Module-wise count rates for Quadrant D Data is divided into 100 sec bins |
 |
 |
| Parameter | Plot |
|---|---|
| CZT HV Monitor | 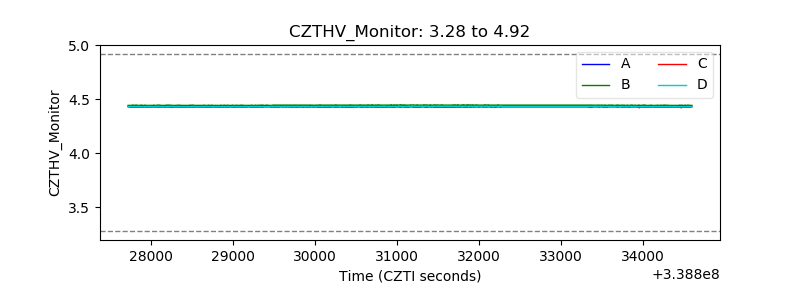 |
| D_VDD | 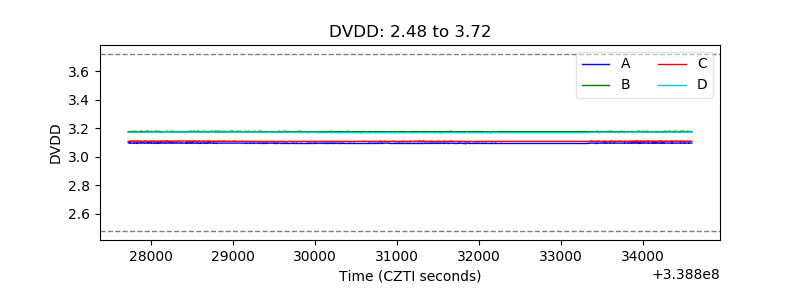 |
| Temperature 1 |  |
| Veto HV Monitor | 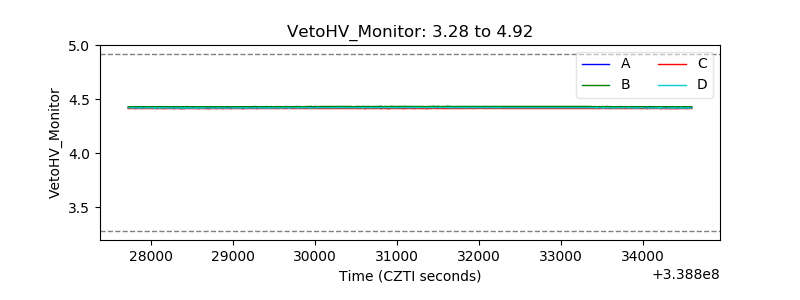 |
| Veto LLD | 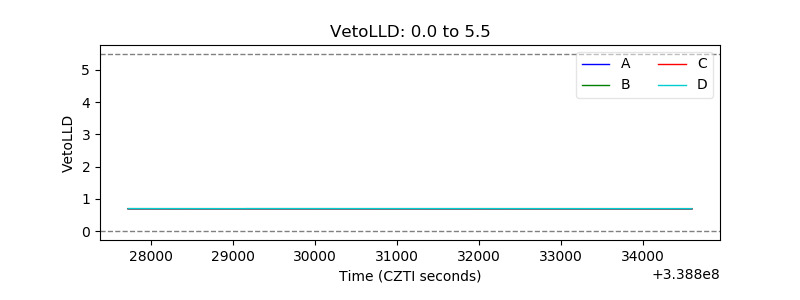 |
| Alpha Counter | 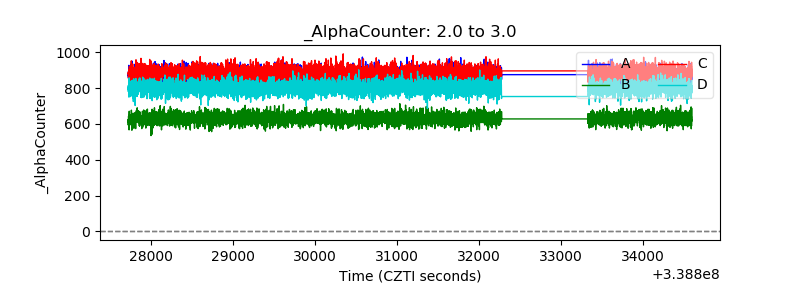 |
| _CPM_Rate | 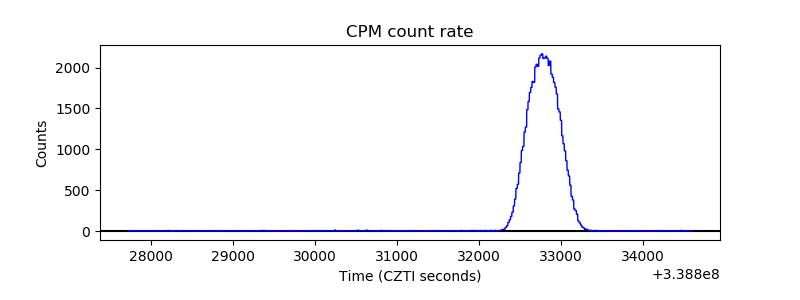 |
| CZT Counter |  |
| +2.5 Volts monitor |  |
| +5 Volts monitor |  |
| _ROLL_ROT | 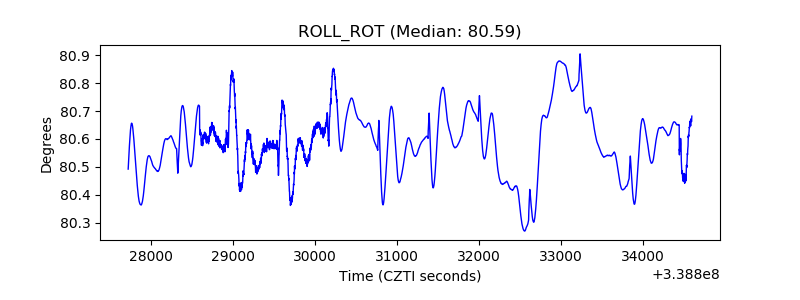 |
| _Roll_DEC | 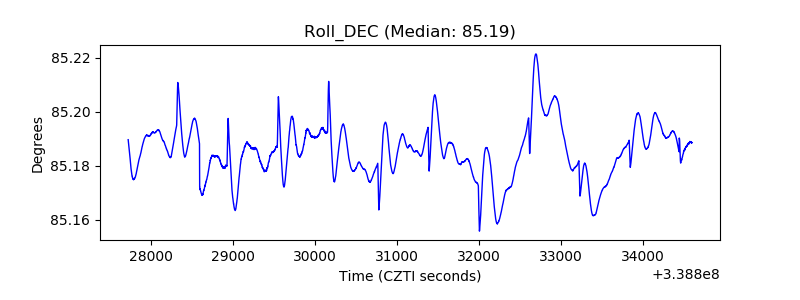 |
| _Roll_RA |  |
| Veto Counter | 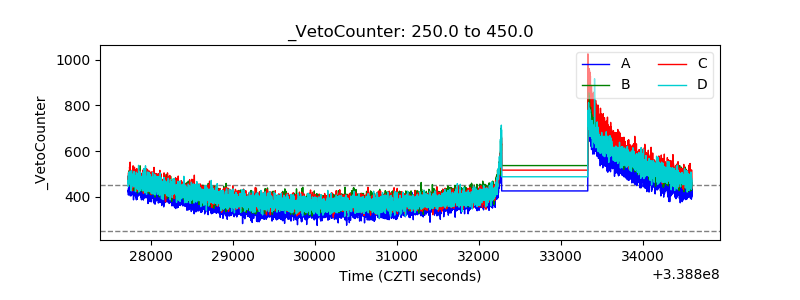 |