| Param | Original file | Final file |
|---|---|---|
| Filename | modeM0/AS1T03_241T01_9000003902_27022cztM0_level2.evt | modeM0/AS1T03_241T01_9000003902_27022cztM0_level2_quad_clean.evt |
| Size (bytes) | 163,788,480 | 31,619,520 |
| Size | 156.2 MB | 30.2 MB |
| Events in quadrant A | 1,994,752 | 183,283 |
| Events in quadrant B | 832,528 | 232,042 |
| Events in quadrant C | 878,864 | 219,941 |
| Events in quadrant D | 1,149,505 | 210,088 |
| Mode M0 | |||
|---|---|---|---|
| Quadrant | BADHDUFLAG | Total packets | Discarded packets |
| A | 0 | 6973 | 0 |
| B | 0 | 3384 | 0 |
| C | 0 | 3587 | 0 |
| D | 0 | 4419 | 0 |
| Quadrant | Total seconds | Saturated seconds | Saturation percentage |
|---|---|---|---|
| A | 1504 | 570 | 37.898936% |
| B | 1504 | 5 | 0.332447% |
| C | 1504 | 22 | 1.462766% |
| D | 1505 | 49 | 3.255814% |
Noise dominated data is calculated using 1-second bins in cleaned event files. If a bin has >2000 counts, and if more than 50% of those come from <1% of pixels, then it is considered to be noise-dominated and hence unusable.
| Quadrant | # 1 sec bins | Bins with >0 counts | Bins with >2000 counts | High rate bins dominated by noise | Noise dominated (total time) | Noise dominated (detector-on time) | Marked lightcurve |
|---|---|---|---|---|---|---|---|
| A | 1503 | 1503 | 347 | 347 | 23.09% | 23.09% | 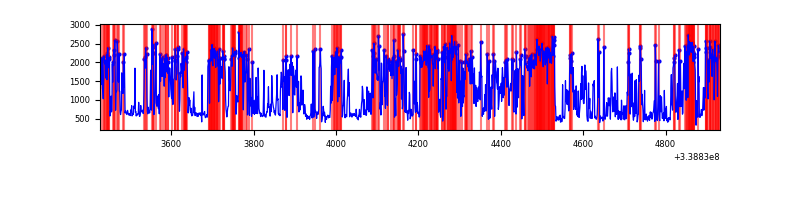 |
| B | 1504 | 1504 | 0 | 0 | 0.00% | 0.00% | 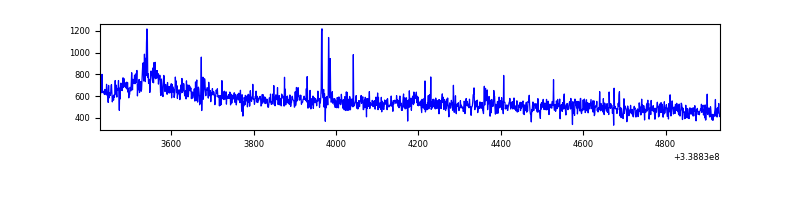 |
| C | 1504 | 1504 | 5 | 5 | 0.33% | 0.33% | 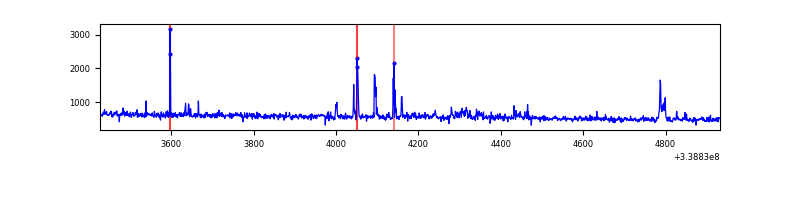 |
| D | 1505 | 1505 | 39 | 39 | 2.59% | 2.59% | 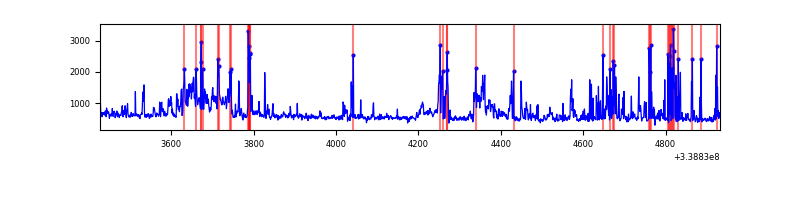 |
Top three noisy pixels from each quadrant. If the there are fewer than three noisy pixels in the level2.evt file, extra rows are filled as -1
| Pixel properties | Quadrant properties | ||||||
|---|---|---|---|---|---|---|---|
| Quadrant | DetID | PixID | Counts | Sigma | Mean | Median | Sigma |
| A | 14 | 235 | 1319759 | 36279.42 | 173 | 169 | 36.4 |
| A | 0 | 13 | 5537 | 147.58 | 173 | 169 | 36.4 |
| A | 13 | 254 | 2079 | 52.51 | 173 | 169 | 36.4 |
| B | 3 | 64 | 18365 | 453.9 | 204 | 200 | 40.0 |
| B | 0 | 219 | 7709 | 187.63 | 204 | 200 | 40.0 |
| B | 0 | 189 | 6051 | 146.2 | 204 | 200 | 40.0 |
| C | 15 | 208 | 60235 | 1235.63 | 201 | 203 | 48.6 |
| C | 14 | 238 | 32282 | 660.28 | 201 | 203 | 48.6 |
| C | 13 | 61 | 1397 | 24.58 | 201 | 203 | 48.6 |
| D | 1 | 52 | 205767 | 4152.92 | 203 | 197 | 49.5 |
| D | 11 | 176 | 95827 | 1931.91 | 203 | 197 | 49.5 |
| D | 2 | 250 | 56896 | 1145.43 | 203 | 197 | 49.5 |
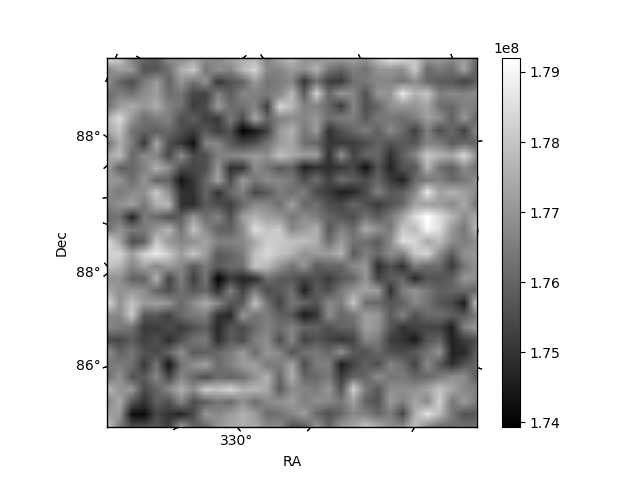
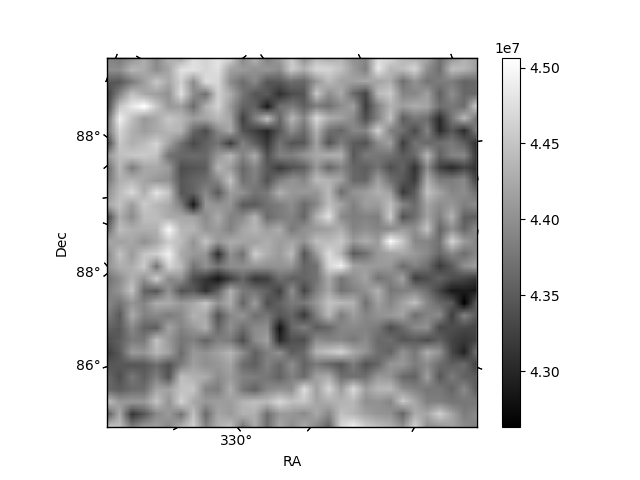
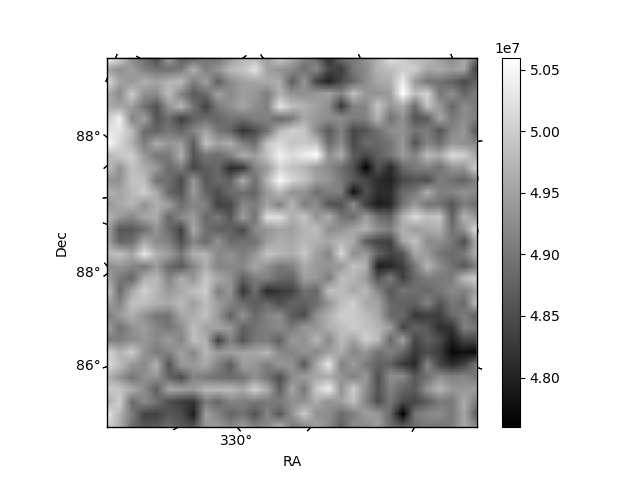
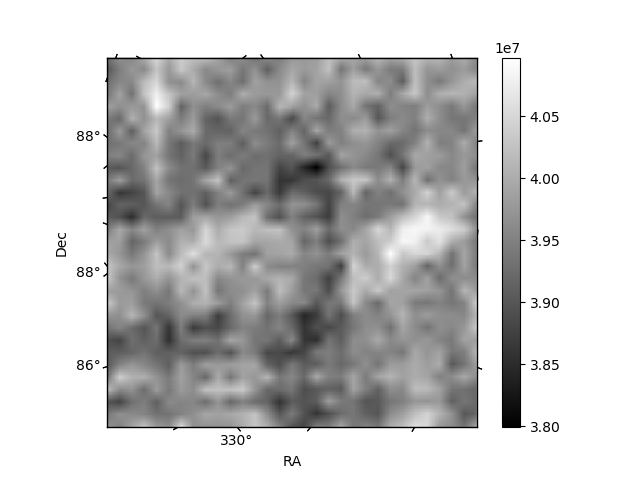
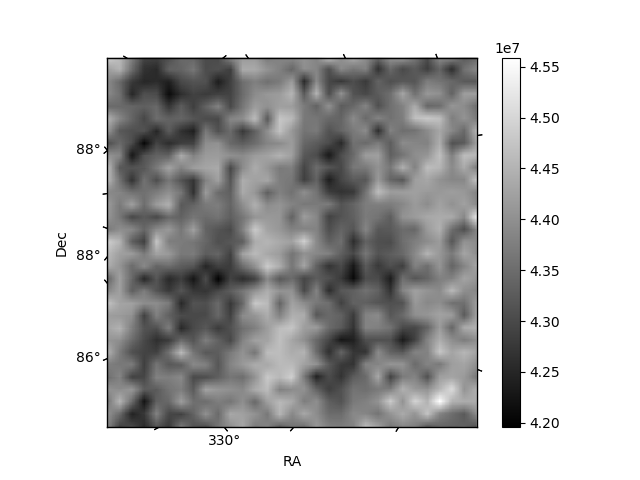
Histogram calculated using DETX and DETY for each event in the final _common_clean file
| Quadrant A | 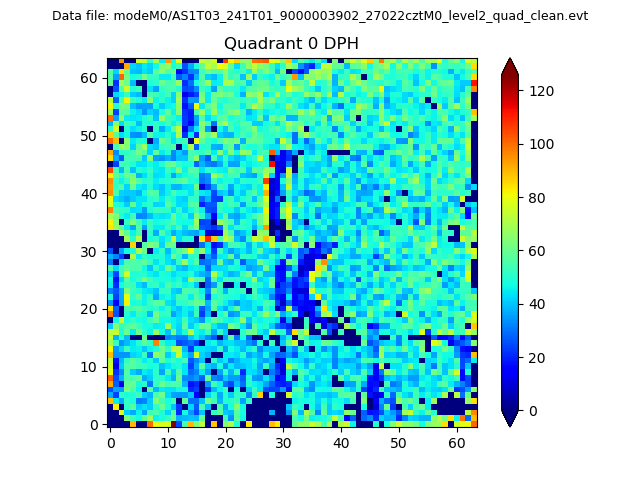 |
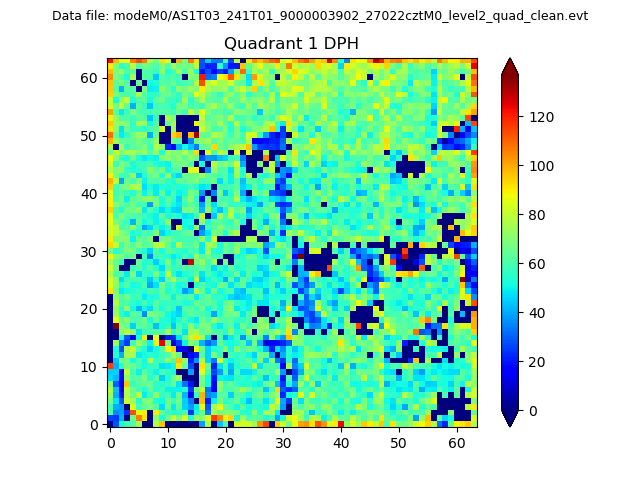 |
Quadrant B |
|---|---|---|---|
| Quadrant D | 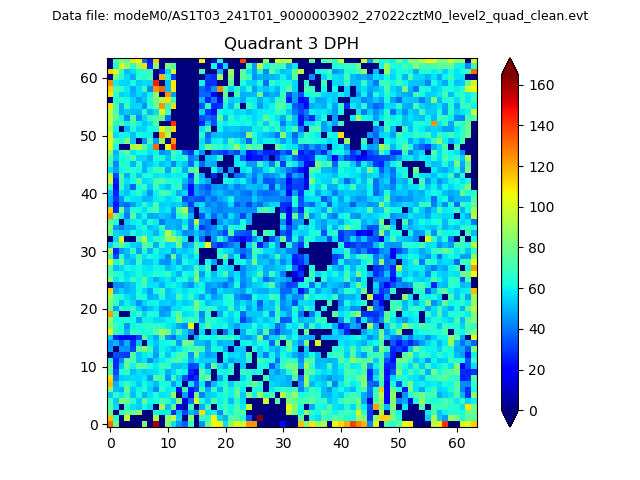 |
 |
Quadrant C |
| Plot type | Count rate plots | Images |
|---|---|---|
| Comparison with Poisson distribution Blue bars denote a histogram of data divided into 1 sec bins. Red curve is a Poisson curve with rate = median count rate of data. |
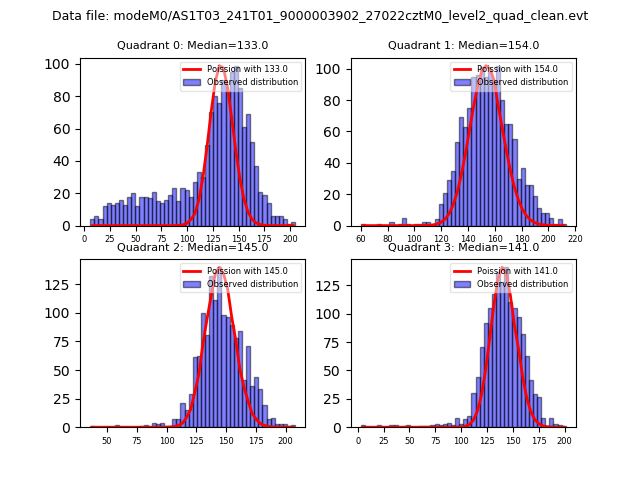 |
 |
| Quadrant-wise count rates Data is divided into 100 sec bins |
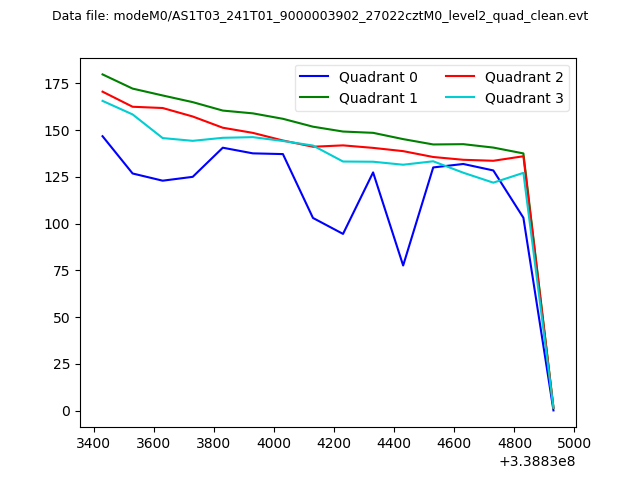 |
|
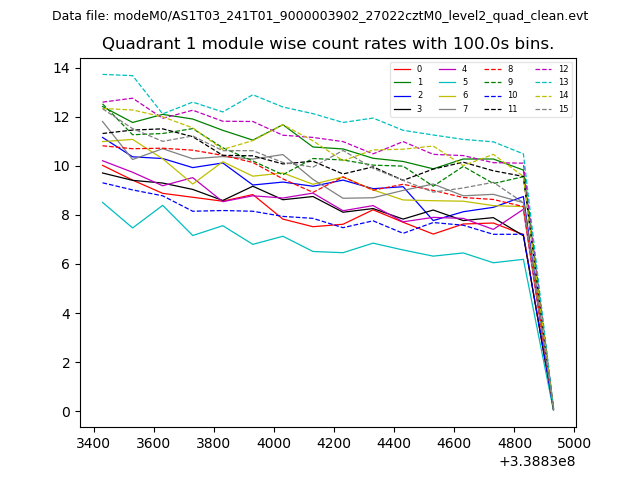
| Module-wise count rates for Quadrant A Data is divided into 100 sec bins |
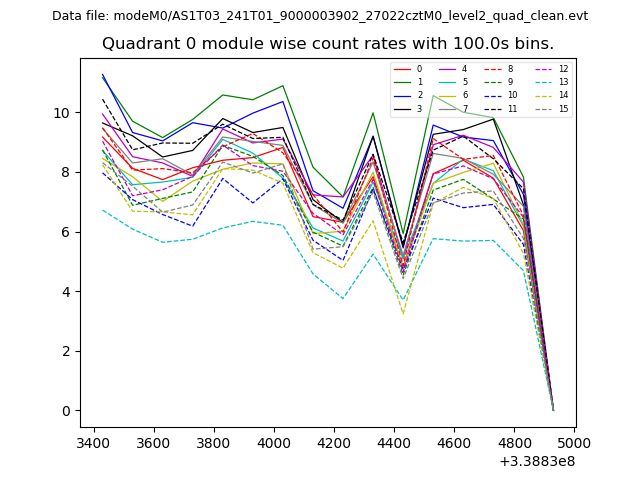 |
 |
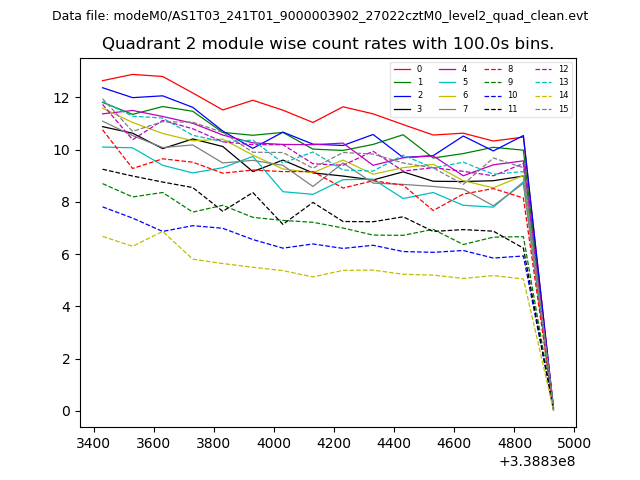
| Module-wise count rates for Quadrant B Data is divided into 100 sec bins |
 |
 |
| Module-wise count rates for Quadrant C Data is divided into 100 sec bins |
 |
 |
| Module-wise count rates for Quadrant D Data is divided into 100 sec bins |
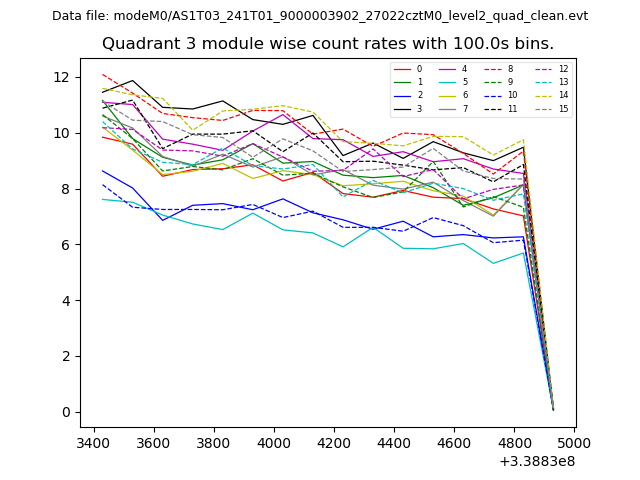 |
 |
| Parameter | Plot |
|---|---|
| CZT HV Monitor | 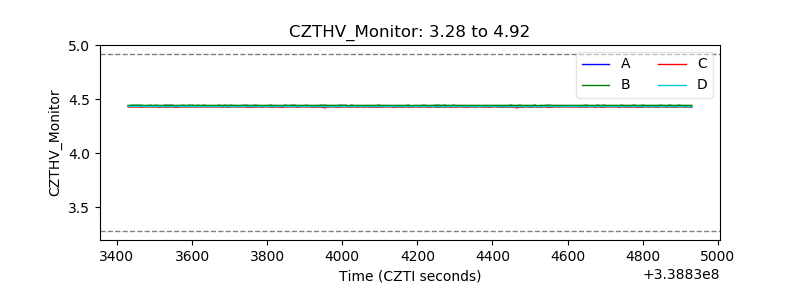 |
| D_VDD | 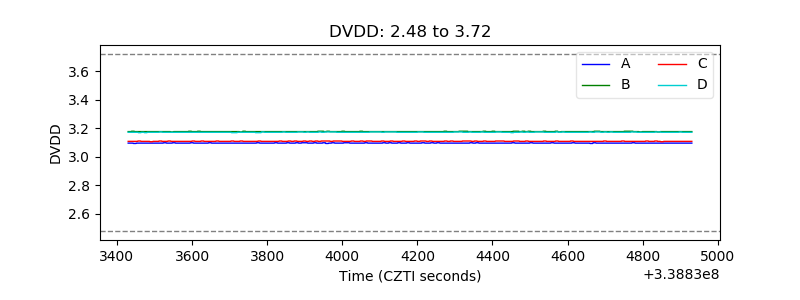 |
| Temperature 1 |  |
| Veto HV Monitor | 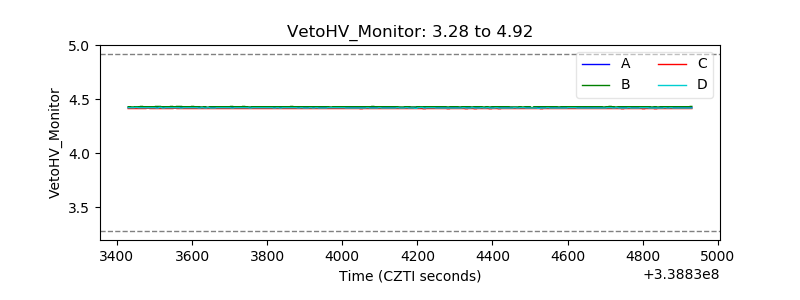 |
| Veto LLD | 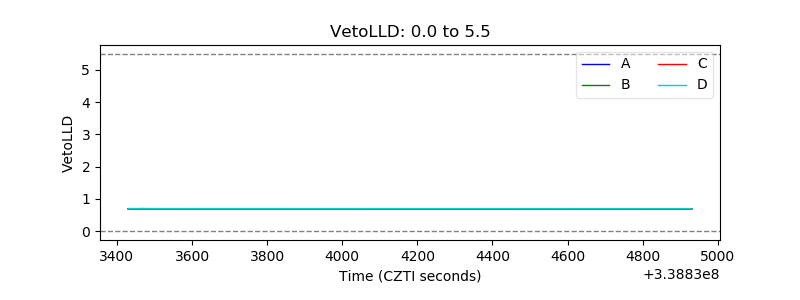 |
| Alpha Counter | 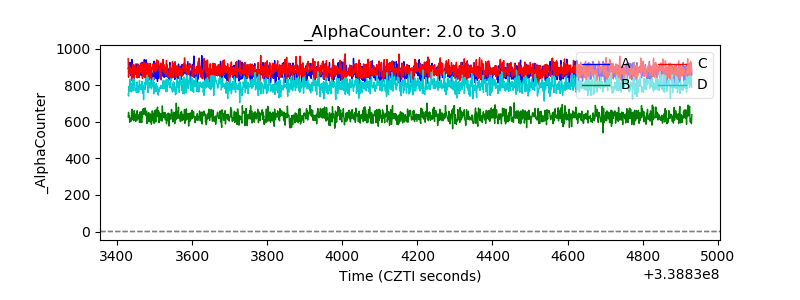 |
| _CPM_Rate | 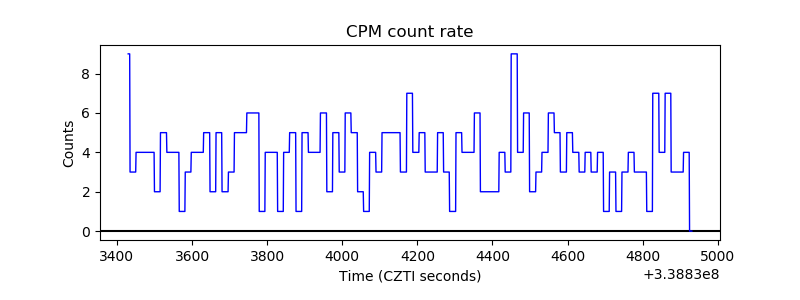 |
| CZT Counter | 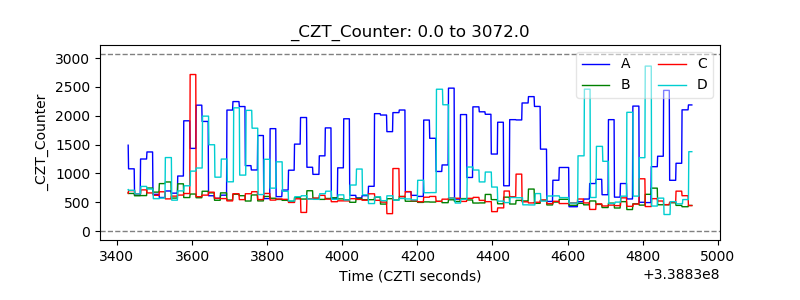 |
| +2.5 Volts monitor | 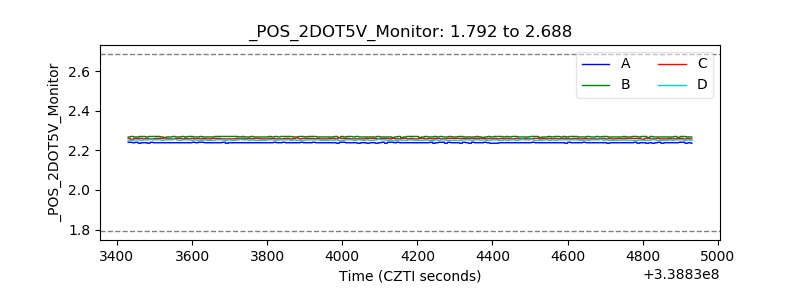 |
| +5 Volts monitor | 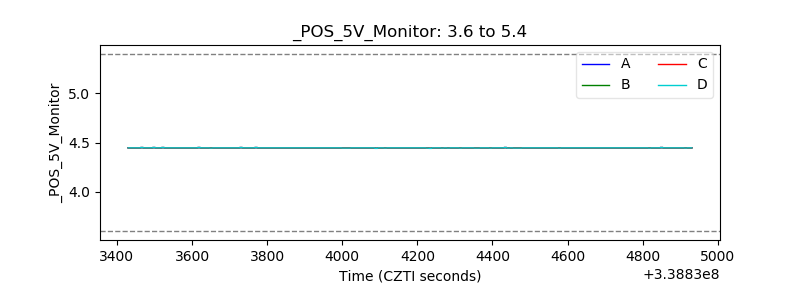 |
| _ROLL_ROT | 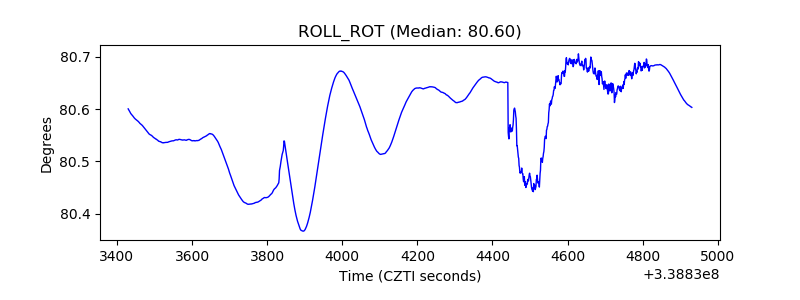 |
| _Roll_DEC | 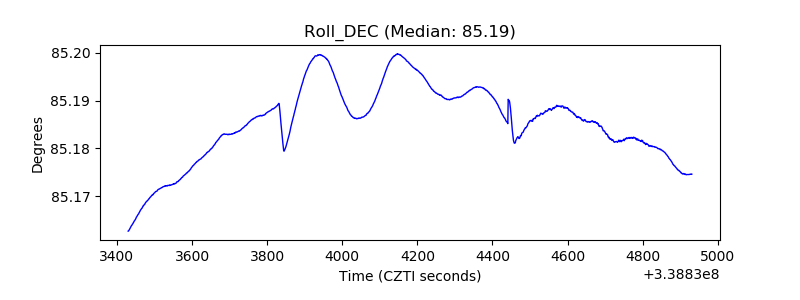 |
| _Roll_RA | 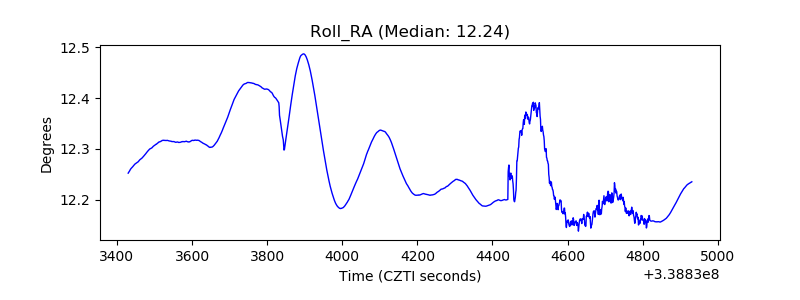 |
| Veto Counter | 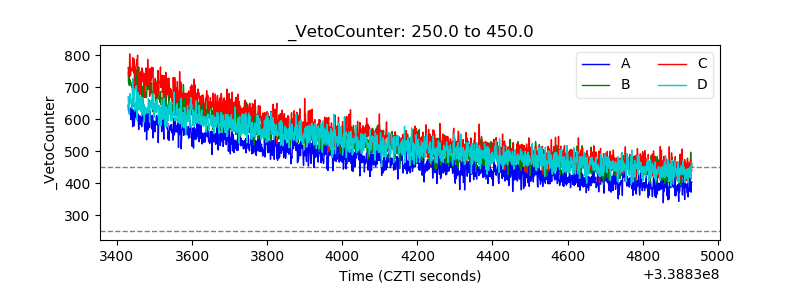 |