| Param | Original file | Final file |
|---|---|---|
| Filename | modeM0/AS1T03_236T01_9000003908cztM0_level2.fits | modeM0/AS1T03_236T01_9000003908cztM0_level2_quad_clean.evt |
| Size (bytes) | 483,255,360 | 401,362,560 |
| Size | 460.9 MB | 382.8 MB |
| Events in quadrant A | 2,972,212 | 2,269,275 |
| Events in quadrant B | 2,850,676 | 2,276,567 |
| Events in quadrant C | 3,030,124 | 2,336,746 |
| Events in quadrant D | 2,576,964 | 2,067,039 |
| Mode M0 | |||
|---|---|---|---|
| Quadrant | BADHDUFLAG | Total packets | Discarded packets |
| A | 0 | 117764 | 0 |
| B | 0 | 118692 | 0 |
| C | 0 | 100104 | 0 |
| D | 0 | 137849 | 0 |
| Mode M9 | |||
|---|---|---|---|
| Quadrant | BADHDUFLAG | Total packets | Discarded packets |
| A | 0 | 99 | 0 |
| B | 0 | 99 | 0 |
| C | 0 | 99 | 0 |
| D | 0 | 99 | 0 |
| Mode SS | |||
|---|---|---|---|
| Quadrant | BADHDUFLAG | Total packets | Discarded packets |
| A | 0 | 952 | 0 |
| B | 0 | 952 | 0 |
| C | 0 | 952 | 0 |
| D | 0 | 952 | 0 |
| Quadrant | Total seconds | Saturated seconds | Saturation percentage |
|---|---|---|---|
| A | 46680 | 1421 | 3.044130% |
| B | 46680 | 2581 | 5.529135% |
| C | 46680 | 760 | 1.628106% |
| D | 46680 | 2726 | 5.839760% |
Noise dominated data is calculated using 1-second bins in cleaned event files. If a bin has >2000 counts, and if more than 50% of those come from <1% of pixels, then it is considered to be noise-dominated and hence unusable.
| Quadrant | # 1 sec bins | Bins with >0 counts | Bins with >2000 counts | High rate bins dominated by noise | Noise dominated (total time) | Noise dominated (detector-on time) | Marked lightcurve |
|---|---|---|---|---|---|---|---|
| A | 56590 | 46679 | 0 | 0 | 0.00% | 0.00% |  |
| B | 56590 | 46673 | 0 | 0 | 0.00% | 0.00% |  |
| C | 56590 | 46680 | 0 | 0 | 0.00% | 0.00% |  |
| D | 56589 | 46644 | 0 | 0 | 0.00% | 0.00% |  |
Top three noisy pixels from each quadrant. If the there are fewer than three noisy pixels in the level2.evt file, extra rows are filled as -1
| Pixel properties | Quadrant properties | ||||||
|---|---|---|---|---|---|---|---|
| Quadrant | DetID | PixID | Counts | Sigma | Mean | Median | Sigma |
| A | 0 | 29 | 2468 | 9.29 | 775 | 730 | 187.1 |
| A | 7 | 110 | 2412 | 8.99 | 775 | 730 | 187.1 |
| A | 14 | 95 | 2179 | 7.75 | 775 | 730 | 187.1 |
| B | 2 | 9 | 2304 | 10.63 | 754 | 723 | 148.8 |
| B | 5 | 255 | 1916 | 8.02 | 754 | 723 | 148.8 |
| B | 3 | 17 | 1909 | 7.97 | 754 | 723 | 148.8 |
| C | 12 | 241 | 2036 | 6.35 | 801 | 757 | 201.4 |
| C | 3 | 187 | 2029 | 6.31 | 801 | 757 | 201.4 |
| C | 3 | 126 | 2025 | 6.29 | 801 | 757 | 201.4 |
| D | 10 | 189 | 1914 | 6.35 | 736 | 675 | 195.2 |
| D | 3 | 14 | 1841 | 5.97 | 736 | 675 | 195.2 |
| D | 6 | 231 | 1806 | 5.79 | 736 | 675 | 195.2 |
Histogram calculated using DETX and DETY for each event in the final _common_clean file
| Quadrant A |  |
 |
Quadrant B |
|---|---|---|---|
| Quadrant D |  |
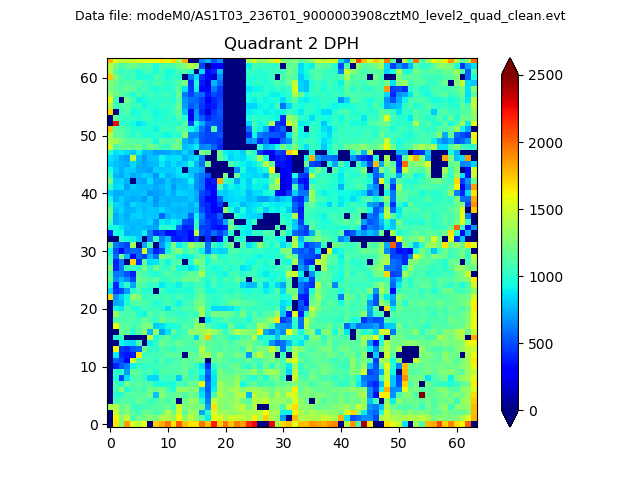 |
Quadrant C |
| Plot type | Count rate plots | Images |
|---|---|---|
| Comparison with Poisson distribution Blue bars denote a histogram of data divided into 1 sec bins. Red curve is a Poisson curve with rate = median count rate of data. |
 |
 |
| Quadrant-wise count rates Data is divided into 100 sec bins |
 |
|
| Module-wise count rates for Quadrant A Data is divided into 100 sec bins |
 |
 |
| Module-wise count rates for Quadrant B Data is divided into 100 sec bins |
 |
 |
| Module-wise count rates for Quadrant C Data is divided into 100 sec bins |
 |
 |
| Module-wise count rates for Quadrant D Data is divided into 100 sec bins |
 |
 |
| Parameter | Plot |
|---|---|
| CZT HV Monitor |  |
| D_VDD |  |
| Temperature 1 |  |
| Veto HV Monitor |  |
| Veto LLD |  |
| Alpha Counter |  |
| _CPM_Rate |  |
| CZT Counter |  |
| +2.5 Volts monitor |  |
| +5 Volts monitor |  |
| _ROLL_ROT |  |
| _Roll_DEC |  |
| _Roll_RA |  |
| Veto Counter |  |