| Param | Original file | Final file |
|---|---|---|
| Filename | modeM0/AS1T03_236T01_9000003908_27076cztM0_level2.evt | modeM0/AS1T03_236T01_9000003908_27076cztM0_level2_quad_clean.evt |
| Size (bytes) | 593,032,320 | 71,861,760 |
| Size | 565.6 MB | 68.5 MB |
| Events in quadrant A | 3,813,783 | 425,267 |
| Events in quadrant B | 3,392,844 | 438,940 |
| Events in quadrant C | 3,357,716 | 430,119 |
| Events in quadrant D | 6,922,346 | 394,865 |
| Mode M0 | |||
|---|---|---|---|
| Quadrant | BADHDUFLAG | Total packets | Discarded packets |
| A | 0 | 15641 | 0 |
| B | 0 | 14296 | 0 |
| C | 0 | 14232 | 0 |
| D | 0 | 25341 | 0 |
| Mode M9 | |||
|---|---|---|---|
| Quadrant | BADHDUFLAG | Total packets | Discarded packets |
| A | 0 | 8 | 0 |
| B | 0 | 8 | 0 |
| C | 0 | 8 | 0 |
| D | 0 | 8 | 0 |
| Quadrant | Total seconds | Saturated seconds | Saturation percentage |
|---|---|---|---|
| A | 6991 | 112 | 1.602060% |
| B | 6991 | 78 | 1.115720% |
| C | 6991 | 90 | 1.287369% |
| D | 6991 | 950 | 13.588900% |
Noise dominated data is calculated using 1-second bins in cleaned event files. If a bin has >2000 counts, and if more than 50% of those come from <1% of pixels, then it is considered to be noise-dominated and hence unusable.
| Quadrant | # 1 sec bins | Bins with >0 counts | Bins with >2000 counts | High rate bins dominated by noise | Noise dominated (total time) | Noise dominated (detector-on time) | Marked lightcurve |
|---|---|---|---|---|---|---|---|
| A | 7741 | 6992 | 28 | 28 | 0.36% | 0.40% | 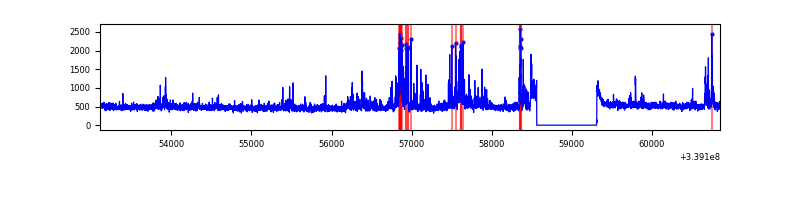 |
| B | 7741 | 6992 | 1 | 1 | 0.01% | 0.01% | 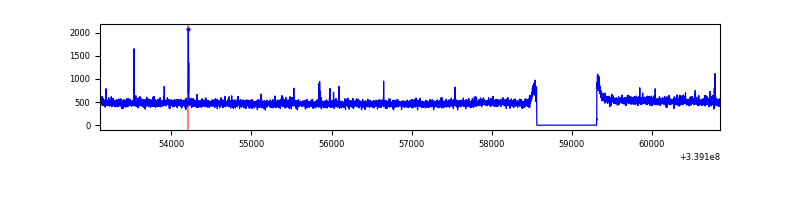 |
| C | 7741 | 6992 | 1 | 1 | 0.01% | 0.01% | 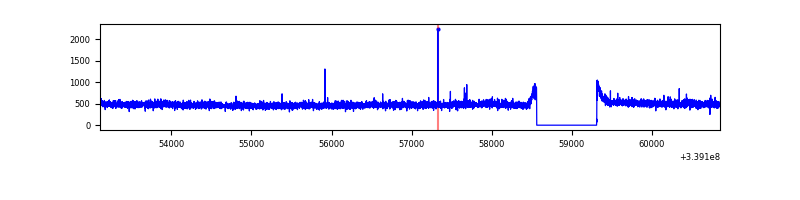 |
| D | 7741 | 6992 | 824 | 824 | 10.64% | 11.78% | 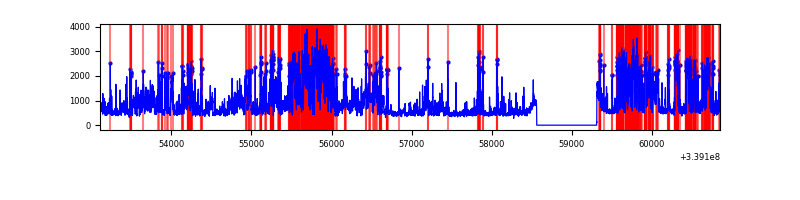 |
Top three noisy pixels from each quadrant. If the there are fewer than three noisy pixels in the level2.evt file, extra rows are filled as -1
| Pixel properties | Quadrant properties | ||||||
|---|---|---|---|---|---|---|---|
| Quadrant | DetID | PixID | Counts | Sigma | Mean | Median | Sigma |
| A | 14 | 235 | 488045 | 2810.91 | 855 | 834 | 173.3 |
| A | 6 | 16 | 24913 | 138.92 | 855 | 834 | 173.3 |
| A | 13 | 254 | 10854 | 57.81 | 855 | 834 | 173.3 |
| B | 3 | 112 | 23396 | 136.97 | 853 | 832 | 164.7 |
| B | 12 | 111 | 20902 | 121.83 | 853 | 832 | 164.7 |
| B | 11 | 111 | 18780 | 108.95 | 853 | 832 | 164.7 |
| C | 14 | 238 | 131290 | 664.91 | 825 | 829 | 196.2 |
| C | 15 | 208 | 6675 | 29.79 | 825 | 829 | 196.2 |
| C | 13 | 61 | 5742 | 25.04 | 825 | 829 | 196.2 |
| D | 1 | 52 | 3830544 | 19955.33 | 788 | 764 | 191.9 |
| D | 2 | 250 | 95360 | 492.9 | 788 | 764 | 191.9 |
| D | 2 | 234 | 27465 | 139.13 | 788 | 764 | 191.9 |
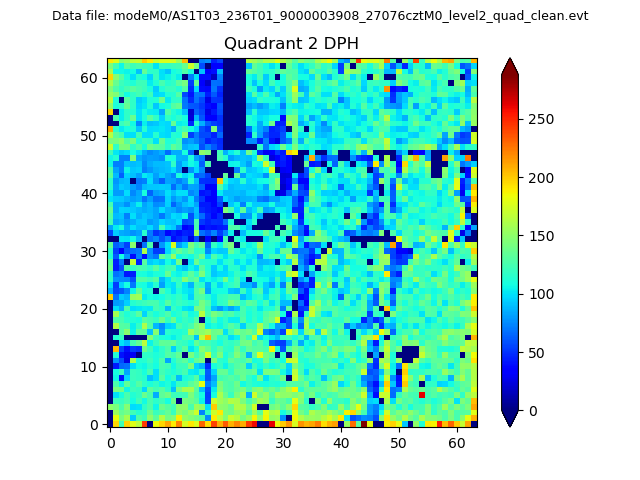
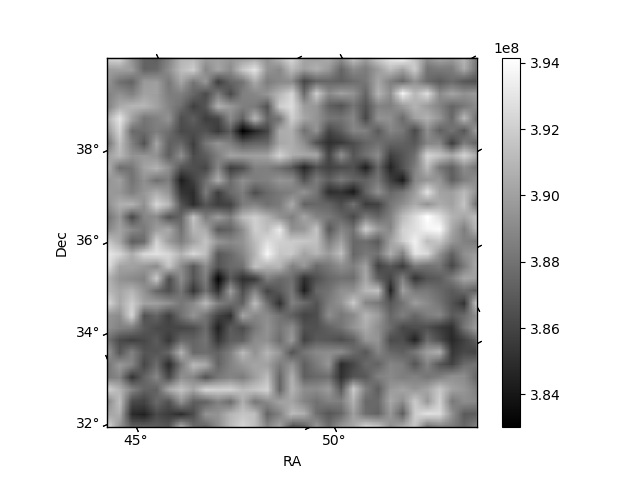
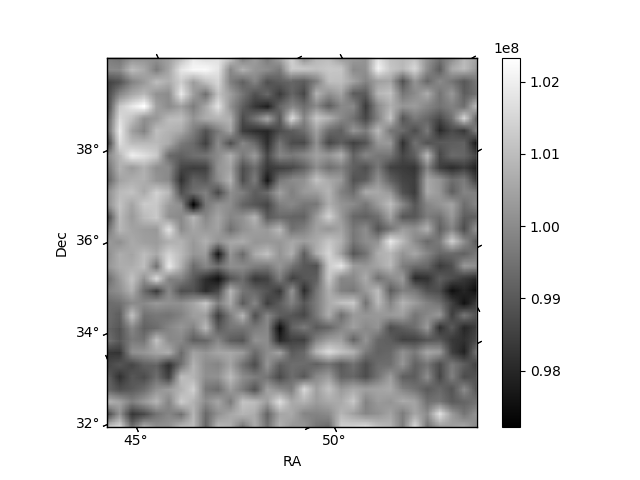
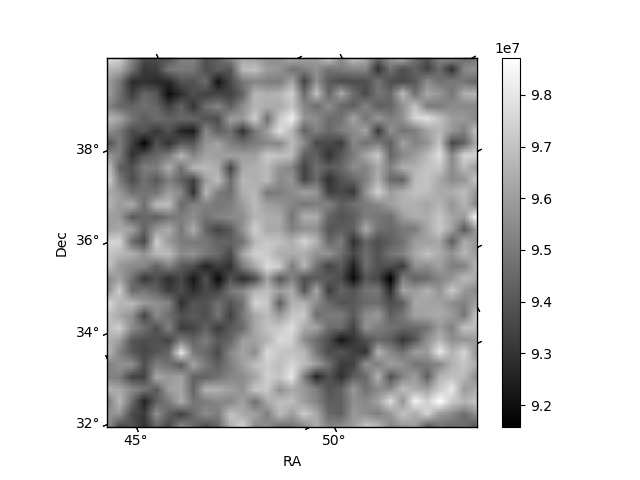
Histogram calculated using DETX and DETY for each event in the final _common_clean file
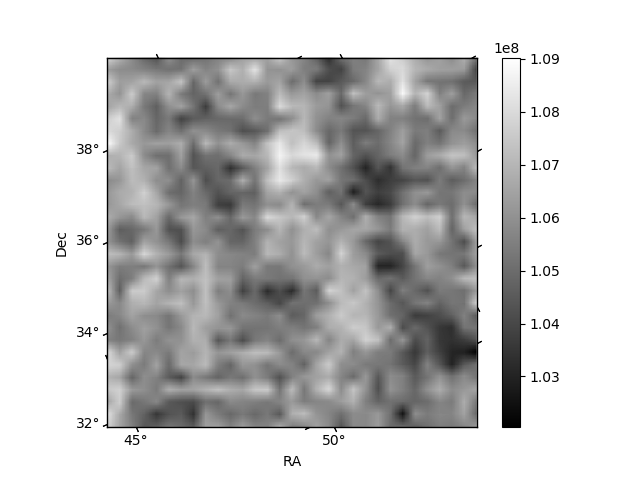
| Quadrant A | 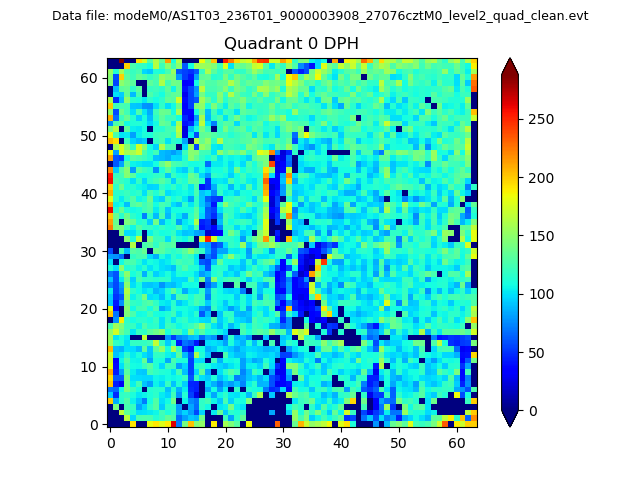 |
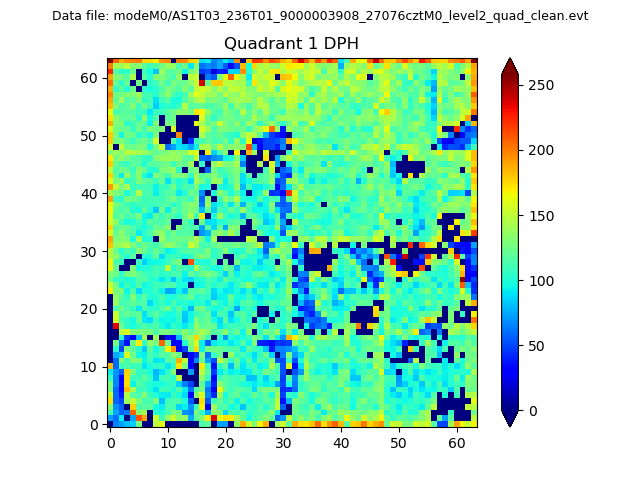 |
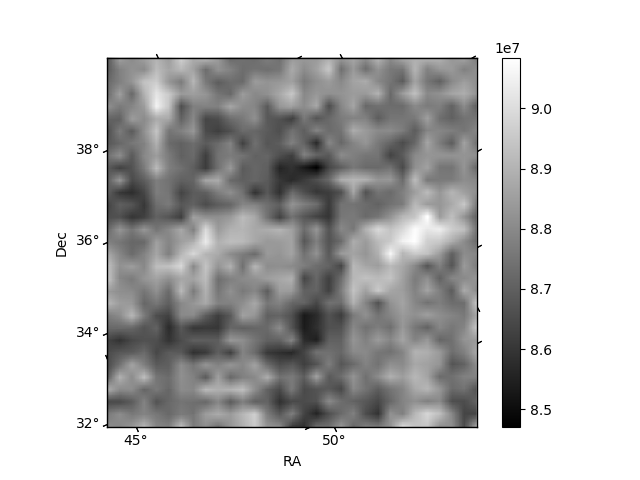
Quadrant B |
|---|---|---|---|
| Quadrant D | 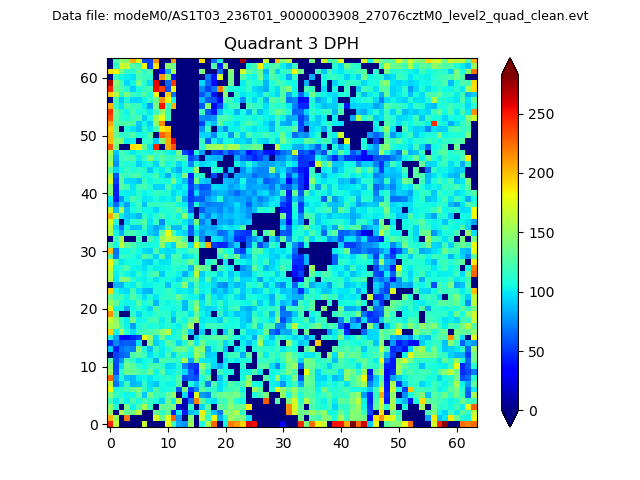 |
 |
Quadrant C |
| Plot type | Count rate plots | Images |
|---|---|---|
| Comparison with Poisson distribution Blue bars denote a histogram of data divided into 1 sec bins. Red curve is a Poisson curve with rate = median count rate of data. |
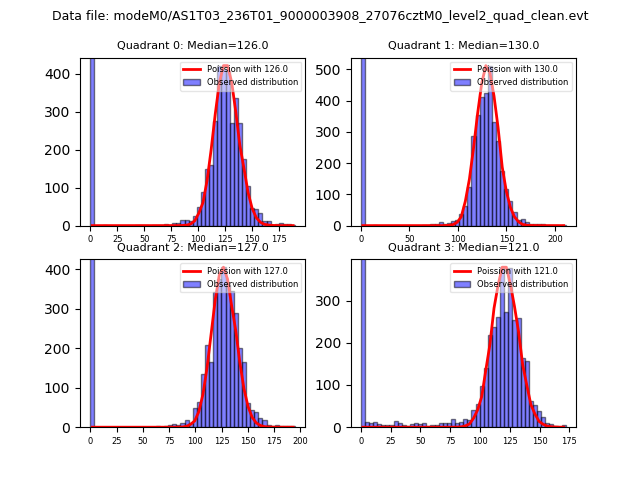 |
 |
| Quadrant-wise count rates Data is divided into 100 sec bins |
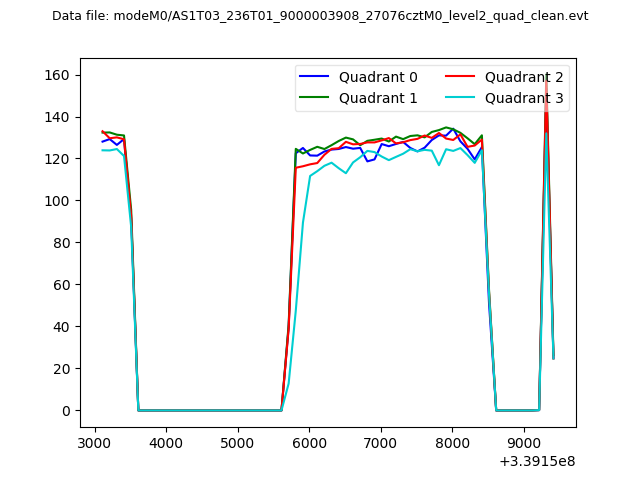 |
|
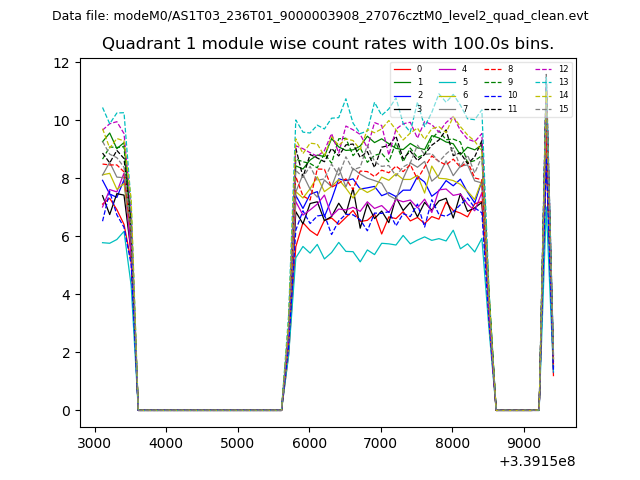
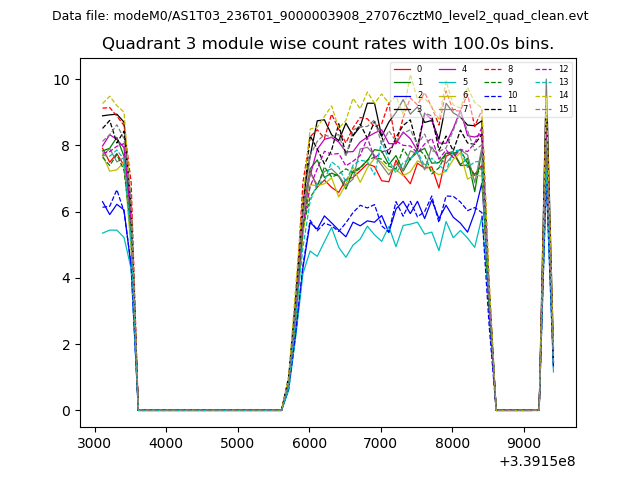
| Module-wise count rates for Quadrant A Data is divided into 100 sec bins |
 |
 |
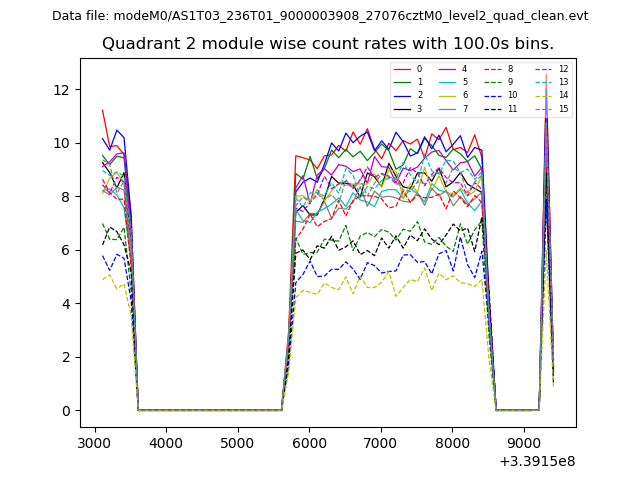
| Module-wise count rates for Quadrant B Data is divided into 100 sec bins |
 |
 |
| Module-wise count rates for Quadrant C Data is divided into 100 sec bins |
 |
 |
| Module-wise count rates for Quadrant D Data is divided into 100 sec bins |
 |
 |
| Parameter | Plot |
|---|---|
| CZT HV Monitor | 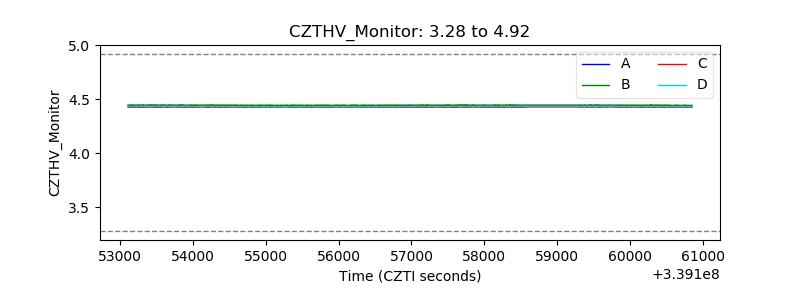 |
| D_VDD | 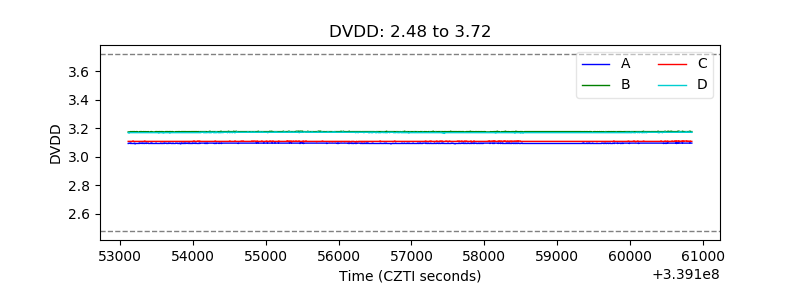 |
| Temperature 1 |  |
| Veto HV Monitor |  |
| Veto LLD | 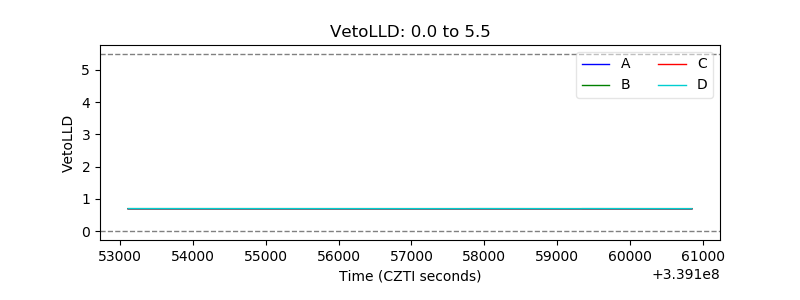 |
| Alpha Counter | 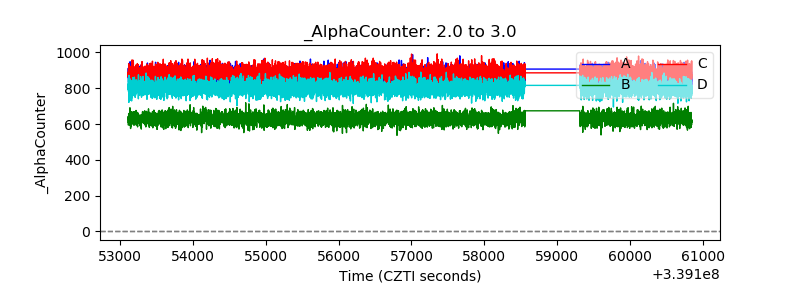 |
| _CPM_Rate | 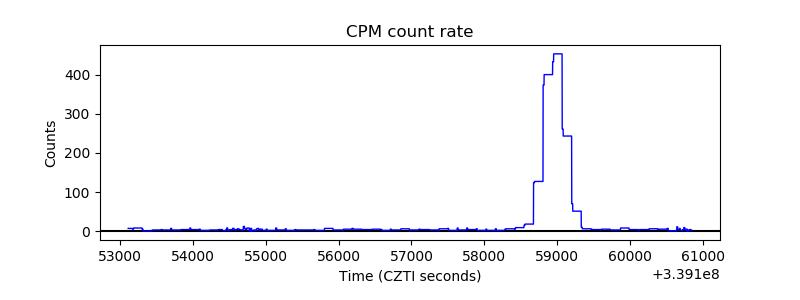 |
| CZT Counter | 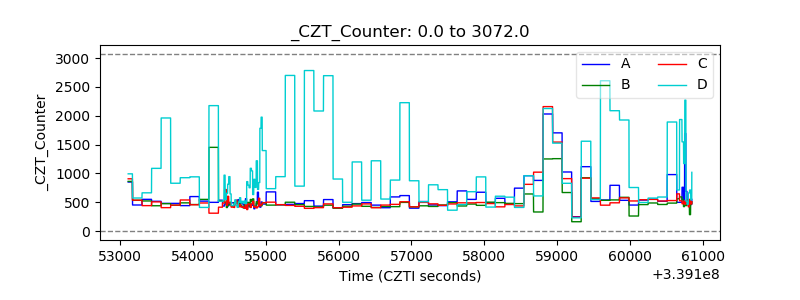 |
| +2.5 Volts monitor |  |
| +5 Volts monitor |  |
| _ROLL_ROT | 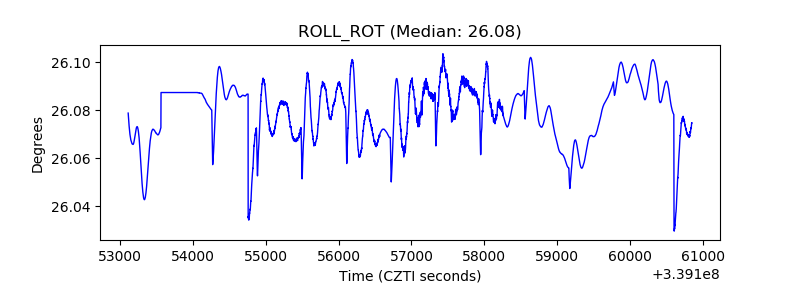 |
| _Roll_DEC | 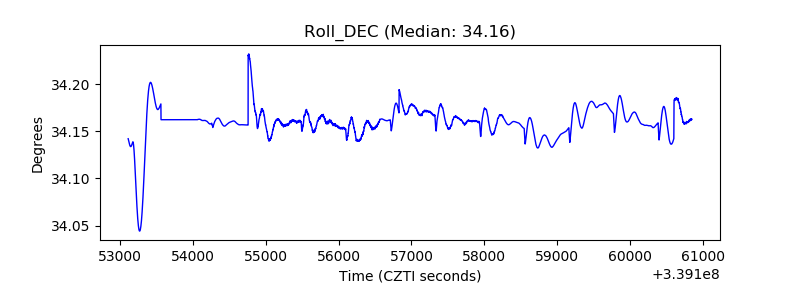 |
| _Roll_RA | 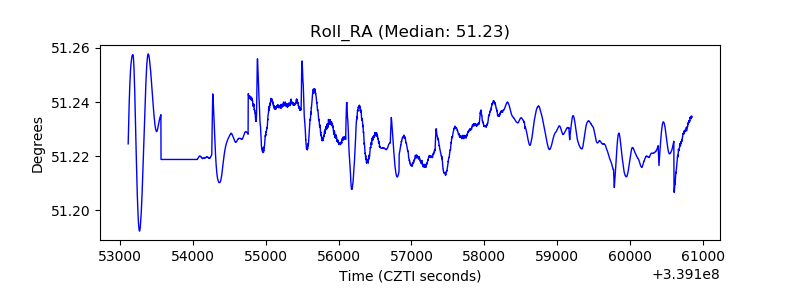 |
| Veto Counter | 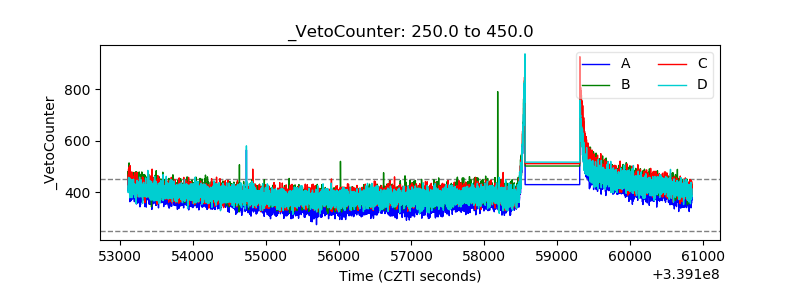 |