| Param | Original file | Final file |
|---|---|---|
| Filename | modeM0/AS1T03_236T01_9000003908_27078cztM0_level2.evt | modeM0/AS1T03_236T01_9000003908_27078cztM0_level2_quad_clean.evt |
| Size (bytes) | 669,792,960 | 69,768,000 |
| Size | 638.8 MB | 66.5 MB |
| Events in quadrant A | 4,640,396 | 425,239 |
| Events in quadrant B | 7,201,660 | 373,975 |
| Events in quadrant C | 3,387,539 | 438,421 |
| Events in quadrant D | 4,614,091 | 419,507 |
| Mode M0 | |||
|---|---|---|---|
| Quadrant | BADHDUFLAG | Total packets | Discarded packets |
| A | 0 | 18146 | 0 |
| B | 0 | 25831 | 0 |
| C | 0 | 14205 | 0 |
| D | 0 | 18239 | 0 |
| Mode M9 | |||
|---|---|---|---|
| Quadrant | BADHDUFLAG | Total packets | Discarded packets |
| A | 0 | 19 | 0 |
| B | 0 | 20 | 0 |
| C | 0 | 20 | 0 |
| D | 0 | 20 | 0 |
| Quadrant | Total seconds | Saturated seconds | Saturation percentage |
|---|---|---|---|
| A | 6522 | 227 | 3.480527% |
| B | 6522 | 1651 | 25.314321% |
| C | 6522 | 103 | 1.579270% |
| D | 6522 | 216 | 3.311868% |
Noise dominated data is calculated using 1-second bins in cleaned event files. If a bin has >2000 counts, and if more than 50% of those come from <1% of pixels, then it is considered to be noise-dominated and hence unusable.
| Quadrant | # 1 sec bins | Bins with >0 counts | Bins with >2000 counts | High rate bins dominated by noise | Noise dominated (total time) | Noise dominated (detector-on time) | Marked lightcurve |
|---|---|---|---|---|---|---|---|
| A | 7597 | 6523 | 127 | 127 | 1.67% | 1.95% | 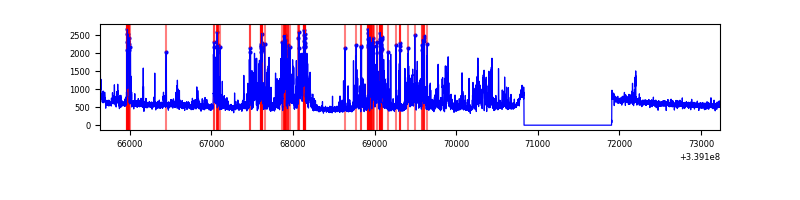 |
| B | 7597 | 6523 | 1453 | 1453 | 19.13% | 22.28% | 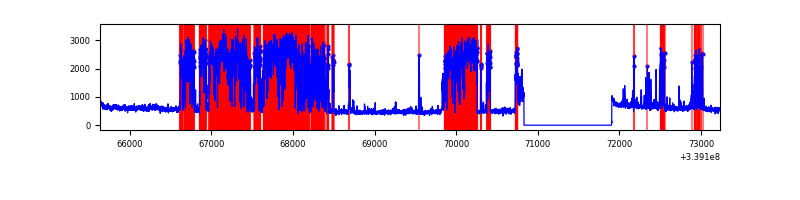 |
| C | 7597 | 6523 | 1 | 1 | 0.01% | 0.02% | 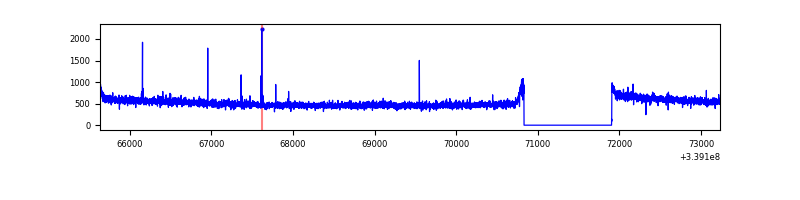 |
| D | 7597 | 6523 | 154 | 154 | 2.03% | 2.36% | 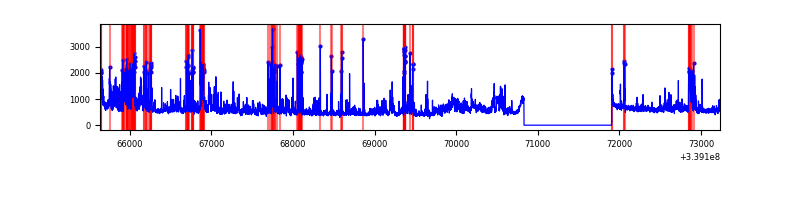 |
Top three noisy pixels from each quadrant. If the there are fewer than three noisy pixels in the level2.evt file, extra rows are filled as -1
| Pixel properties | Quadrant properties | ||||||
|---|---|---|---|---|---|---|---|
| Quadrant | DetID | PixID | Counts | Sigma | Mean | Median | Sigma |
| A | 14 | 235 | 1339036 | 7828.19 | 849 | 833 | 170.9 |
| A | 12 | 189 | 14686 | 81.04 | 849 | 833 | 170.9 |
| A | 13 | 254 | 9902 | 53.05 | 849 | 833 | 170.9 |
| B | 0 | 189 | 4029062 | 27838.08 | 761 | 743 | 144.7 |
| B | 3 | 112 | 153021 | 1052.33 | 761 | 743 | 144.7 |
| B | 10 | 246 | 22404 | 149.69 | 761 | 743 | 144.7 |
| C | 14 | 238 | 132361 | 677.73 | 829 | 835 | 194.1 |
| C | 15 | 208 | 20504 | 101.35 | 829 | 835 | 194.1 |
| C | 13 | 61 | 5599 | 24.55 | 829 | 835 | 194.1 |
| D | 1 | 52 | 1194029 | 6026.64 | 827 | 805 | 198.0 |
| D | 2 | 250 | 228451 | 1149.78 | 827 | 805 | 198.0 |
| D | 2 | 234 | 28932 | 142.06 | 827 | 805 | 198.0 |
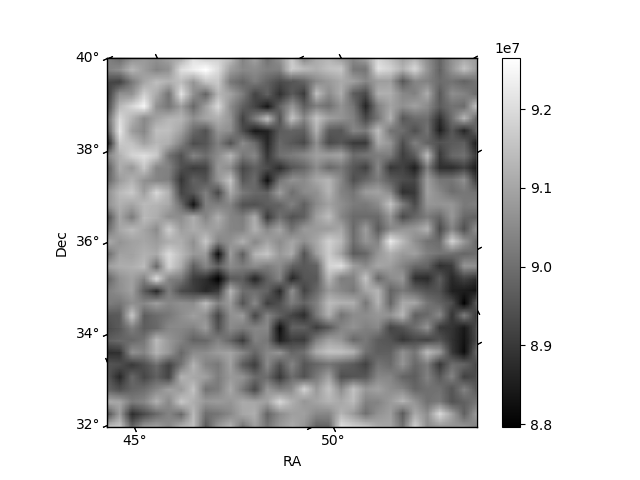
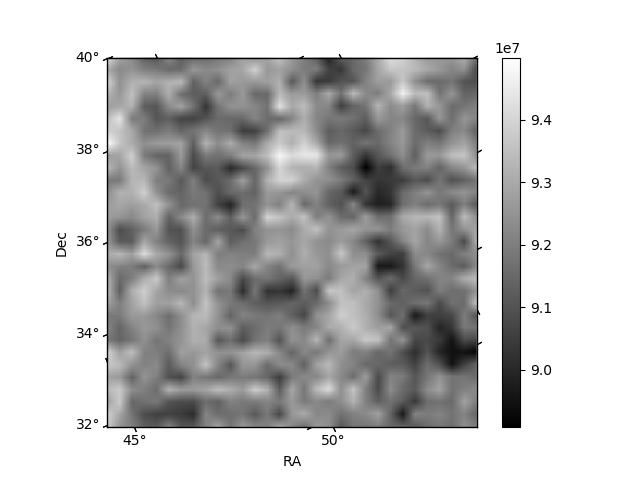
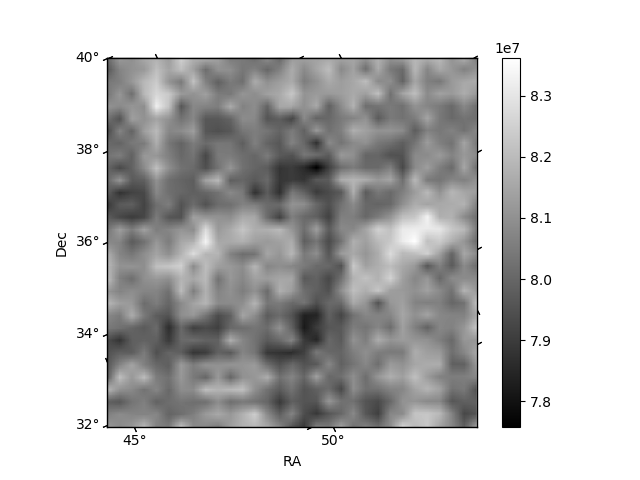
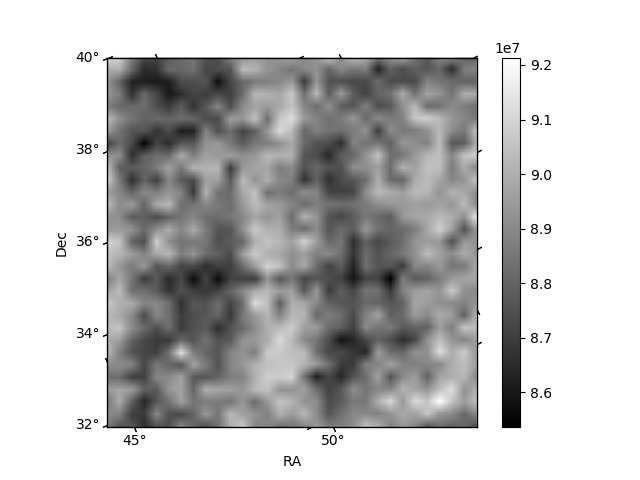
Histogram calculated using DETX and DETY for each event in the final _common_clean file
| Quadrant A | 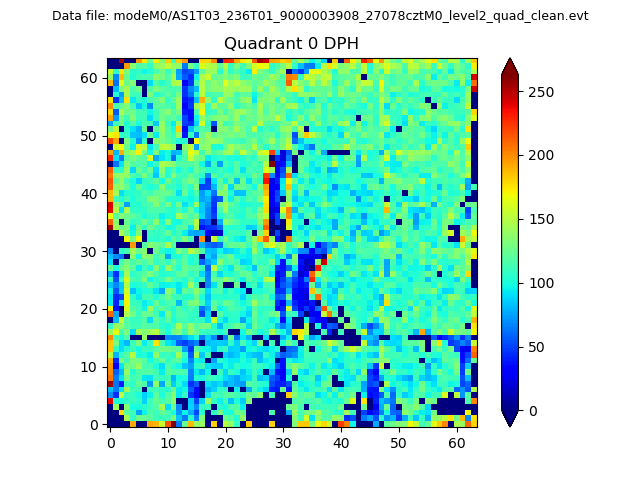 |
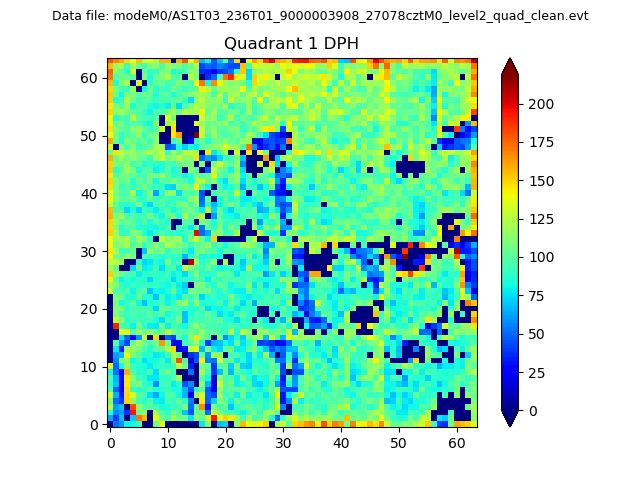 |
Quadrant B |
|---|---|---|---|
| Quadrant D |  |
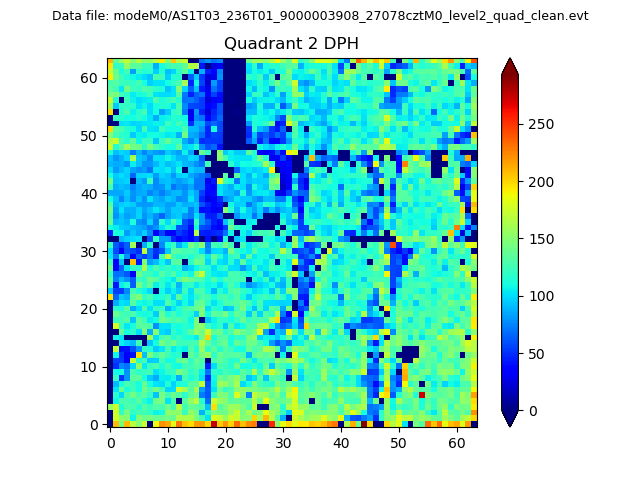 |
Quadrant C |
| Plot type | Count rate plots | Images |
|---|---|---|
| Comparison with Poisson distribution Blue bars denote a histogram of data divided into 1 sec bins. Red curve is a Poisson curve with rate = median count rate of data. |
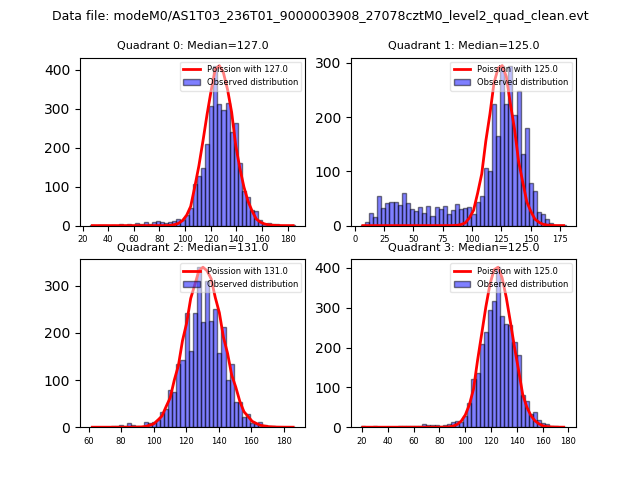 |
 |
| Quadrant-wise count rates Data is divided into 100 sec bins |
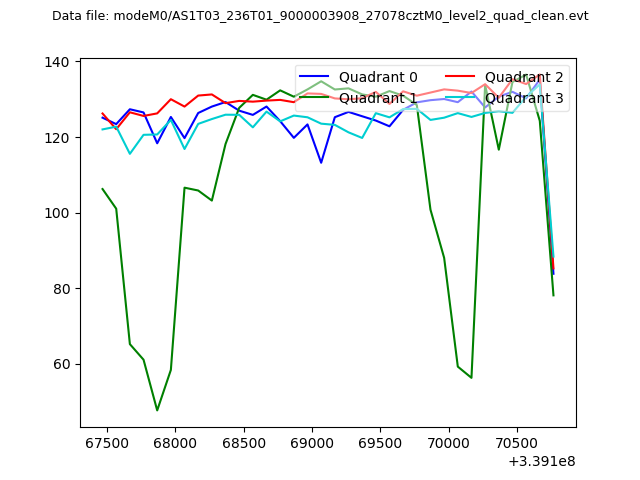 |
|
| Module-wise count rates for Quadrant A Data is divided into 100 sec bins |
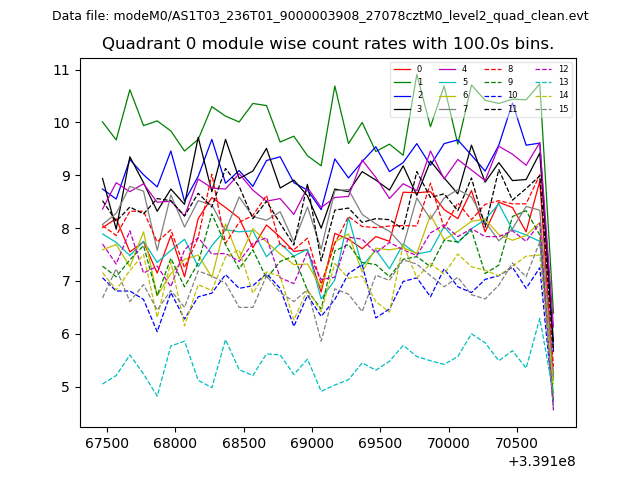 |
 |
| Module-wise count rates for Quadrant B Data is divided into 100 sec bins |
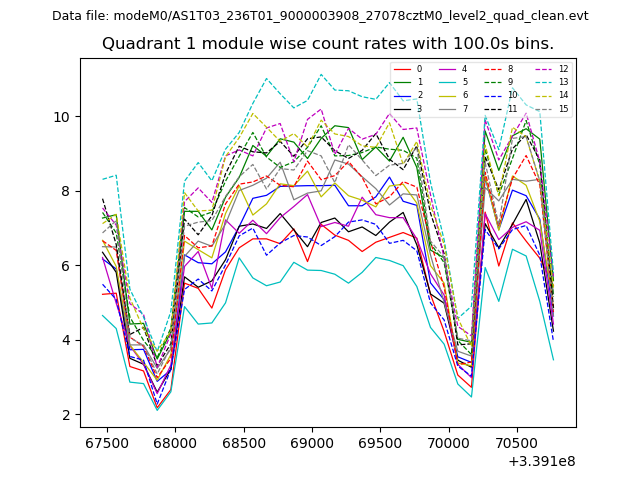 |
 |
| Module-wise count rates for Quadrant C Data is divided into 100 sec bins |
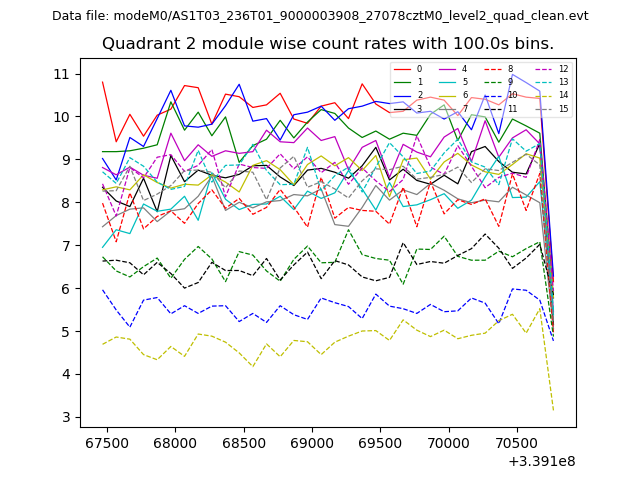 |
 |
| Module-wise count rates for Quadrant D Data is divided into 100 sec bins |
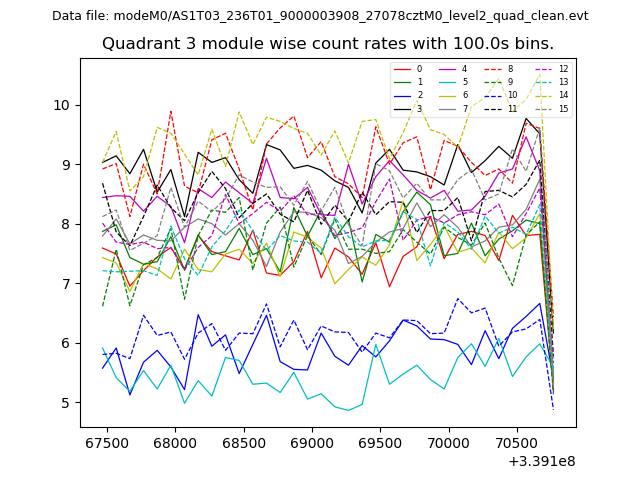 |
 |
| Parameter | Plot |
|---|---|
| CZT HV Monitor | 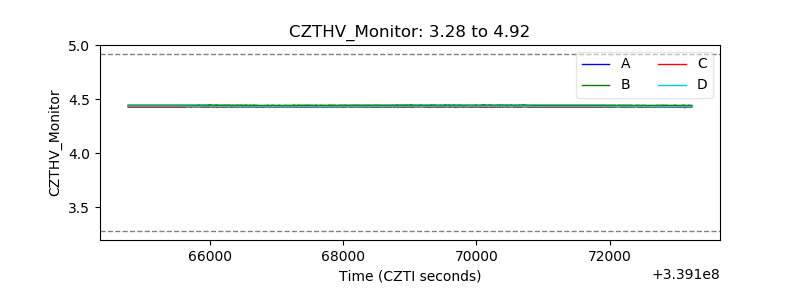 |
| D_VDD | 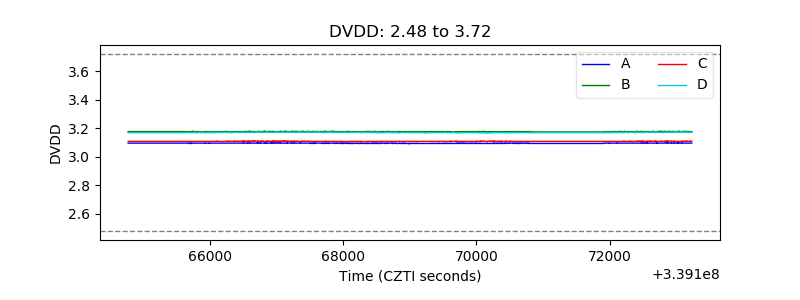 |
| Temperature 1 | 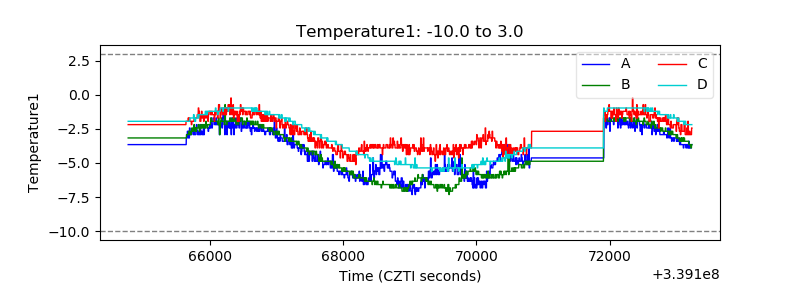 |
| Veto HV Monitor | 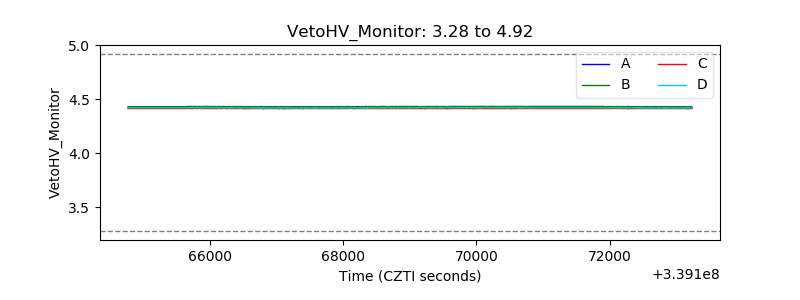 |
| Veto LLD | 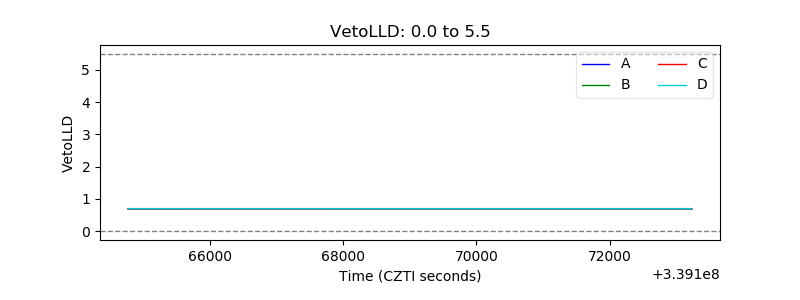 |
| Alpha Counter | 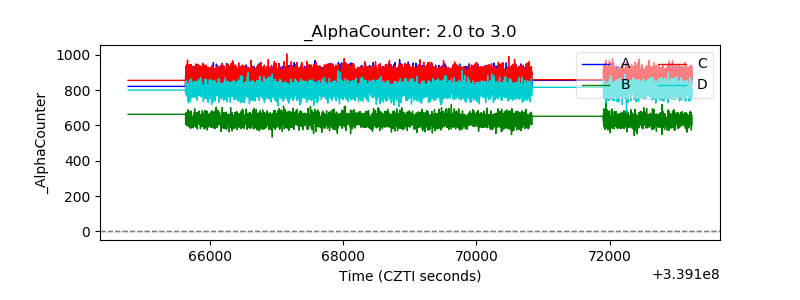 |
| _CPM_Rate | 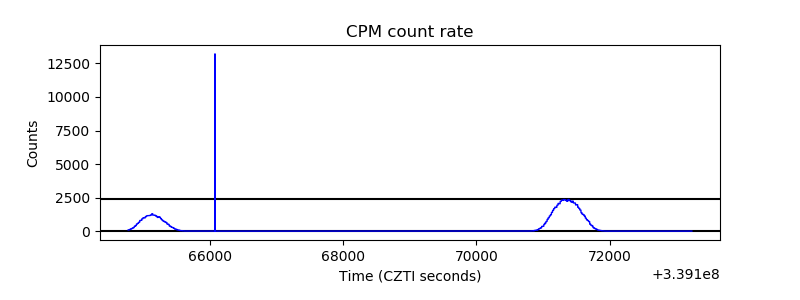 |
| CZT Counter | 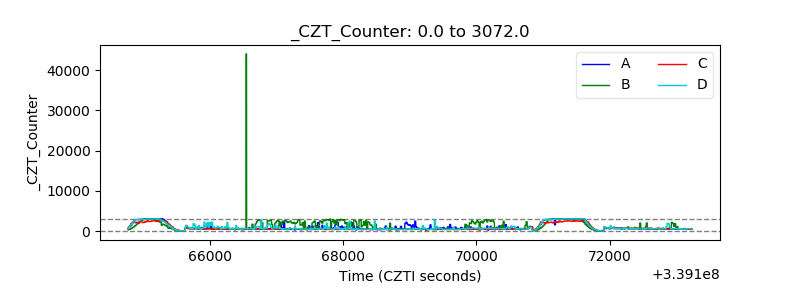 |
| +2.5 Volts monitor |  |
| +5 Volts monitor |  |
| _ROLL_ROT | 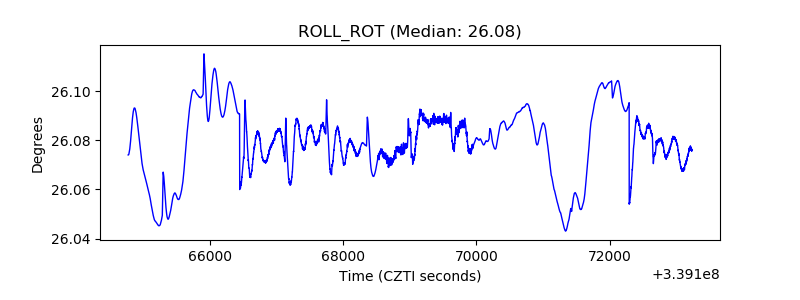 |
| _Roll_DEC | 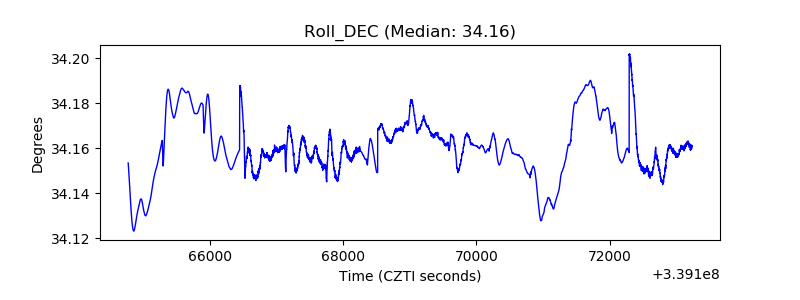 |
| _Roll_RA | 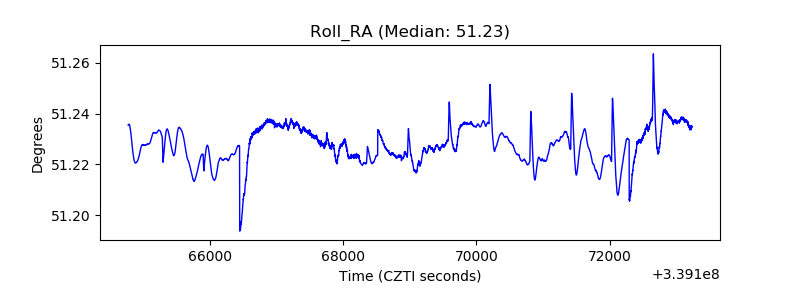 |
| Veto Counter | 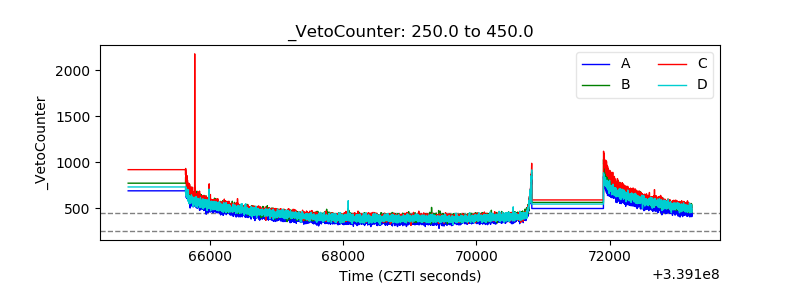 |