| Param | Original file | Final file |
|---|---|---|
| Filename | modeM0/AS1T03_236T01_9000003908_27080cztM0_level2.evt | modeM0/AS1T03_236T01_9000003908_27080cztM0_level2_quad_clean.evt |
| Size (bytes) | 1,494,103,680 | 218,943,360 |
| Size | 1.4 GB | 208.8 MB |
| Events in quadrant A | 10,595,529 | 1,382,290 |
| Events in quadrant B | 12,954,620 | 1,353,452 |
| Events in quadrant C | 8,481,553 | 1,409,939 |
| Events in quadrant D | 12,099,497 | 1,341,292 |
| Mode M0 | |||
|---|---|---|---|
| Quadrant | BADHDUFLAG | Total packets | Discarded packets |
| A | 0 | 42291 | 0 |
| B | 0 | 49104 | 0 |
| C | 0 | 35730 | 0 |
| D | 0 | 47307 | 0 |
| Mode M9 | |||
|---|---|---|---|
| Quadrant | BADHDUFLAG | Total packets | Discarded packets |
| A | 0 | 31 | 0 |
| B | 0 | 31 | 0 |
| C | 0 | 31 | 0 |
| D | 0 | 31 | 0 |
| Quadrant | Total seconds | Saturated seconds | Saturation percentage |
|---|---|---|---|
| A | 16582 | 474 | 2.858521% |
| B | 16583 | 1927 | 11.620334% |
| C | 16583 | 285 | 1.718628% |
| D | 16583 | 804 | 4.848339% |
Noise dominated data is calculated using 1-second bins in cleaned event files. If a bin has >2000 counts, and if more than 50% of those come from <1% of pixels, then it is considered to be noise-dominated and hence unusable.
| Quadrant | # 1 sec bins | Bins with >0 counts | Bins with >2000 counts | High rate bins dominated by noise | Noise dominated (total time) | Noise dominated (detector-on time) | Marked lightcurve |
|---|---|---|---|---|---|---|---|
| A | 19772 | 16585 | 252 | 252 | 1.27% | 1.52% | 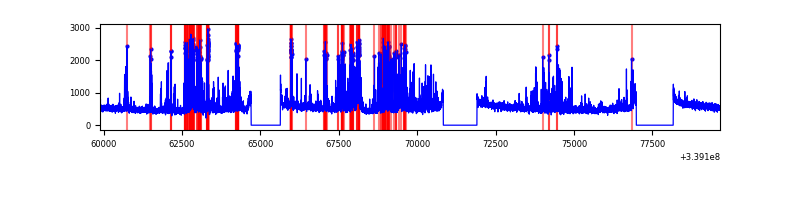 |
| B | 19773 | 16586 | 1583 | 1583 | 8.01% | 9.54% | 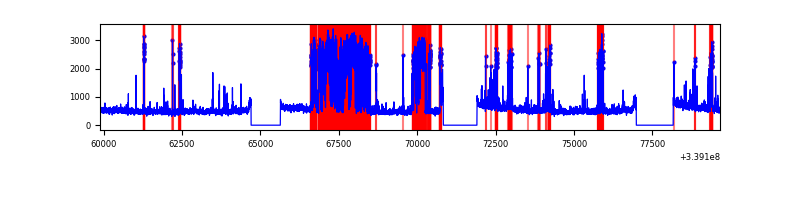 |
| C | 19773 | 16586 | 5 | 5 | 0.03% | 0.03% | 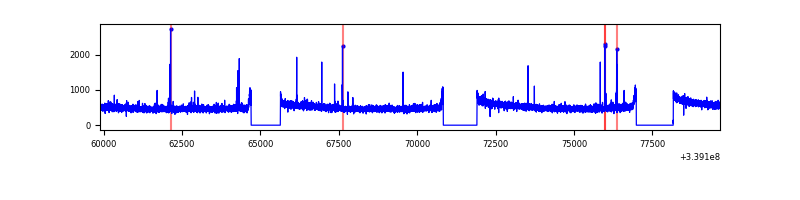 |
| D | 19773 | 16586 | 622 | 622 | 3.15% | 3.75% | 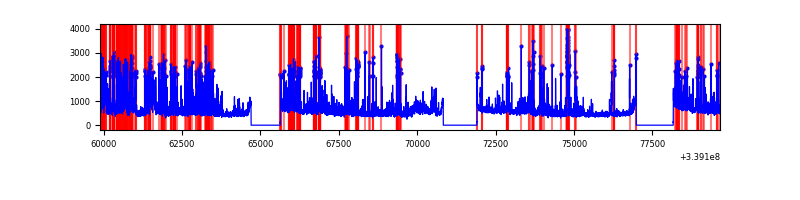 |
Top three noisy pixels from each quadrant. If the there are fewer than three noisy pixels in the level2.evt file, extra rows are filled as -1
| Pixel properties | Quadrant properties | ||||||
|---|---|---|---|---|---|---|---|
| Quadrant | DetID | PixID | Counts | Sigma | Mean | Median | Sigma |
| A | 14 | 235 | 2381420 | 5669.36 | 2107 | 2069 | 419.7 |
| A | 6 | 16 | 56257 | 129.12 | 2107 | 2069 | 419.7 |
| A | 12 | 189 | 27120 | 59.69 | 2107 | 2069 | 419.7 |
| B | 0 | 189 | 4550517 | 11913.73 | 2026 | 1977 | 381.8 |
| B | 3 | 112 | 391128 | 1019.28 | 2026 | 1977 | 381.8 |
| B | 10 | 246 | 53482 | 134.9 | 2026 | 1977 | 381.8 |
| C | 14 | 238 | 331295 | 683.44 | 2072 | 2091 | 481.7 |
| C | 15 | 208 | 67673 | 136.15 | 2072 | 2091 | 481.7 |
| C | 13 | 61 | 14269 | 25.28 | 2072 | 2091 | 481.7 |
| D | 1 | 52 | 3811508 | 7890.98 | 2045 | 1997 | 482.8 |
| D | 2 | 250 | 459706 | 948.09 | 2045 | 1997 | 482.8 |
| D | 2 | 234 | 73916 | 148.97 | 2045 | 1997 | 482.8 |
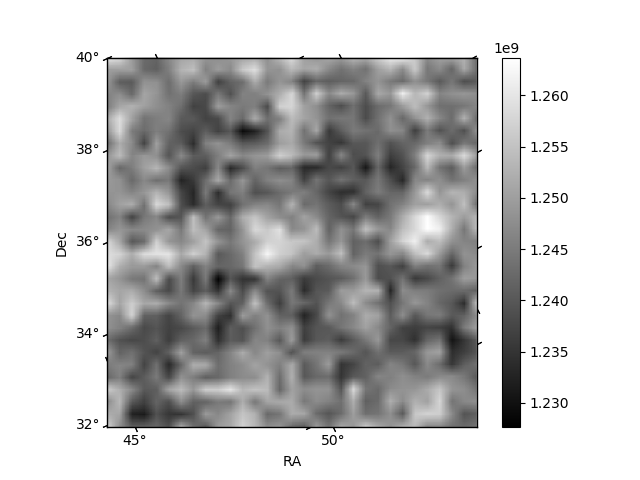
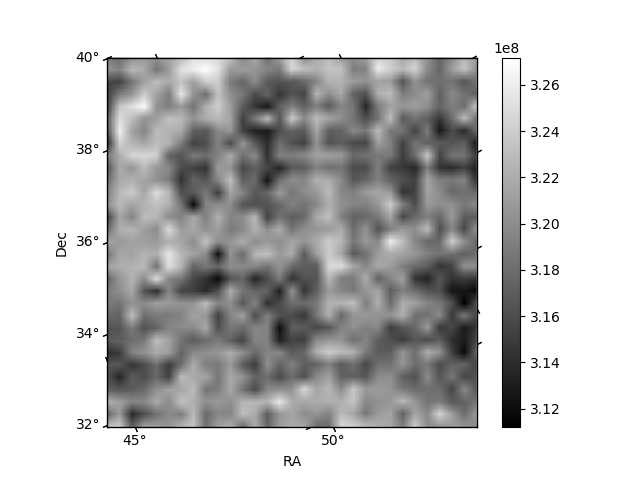
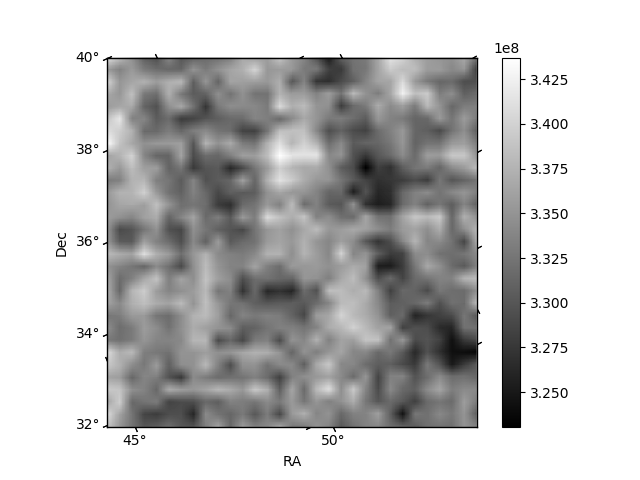
Histogram calculated using DETX and DETY for each event in the final _common_clean file
| Quadrant A | 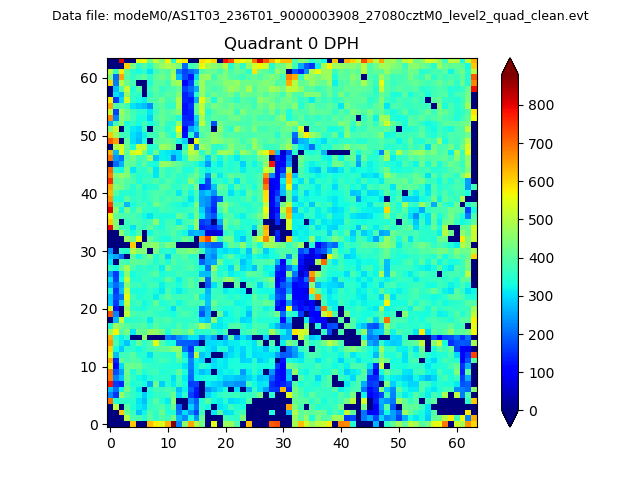 |
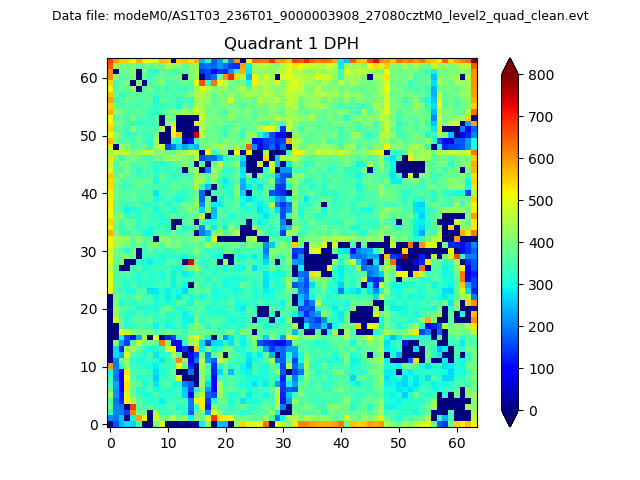 |
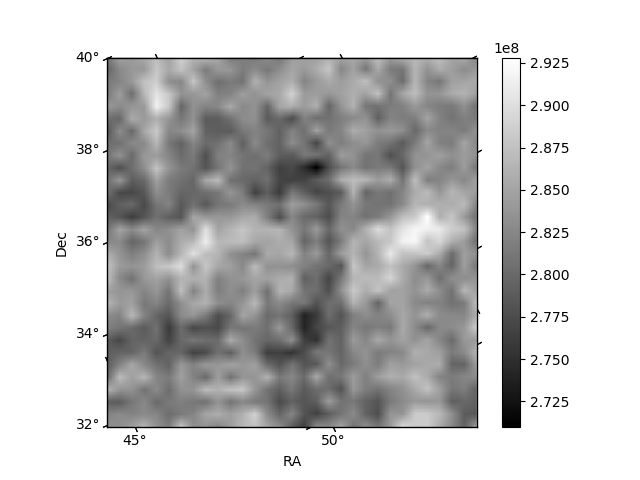
Quadrant B |
|---|---|---|---|
| Quadrant D |  |
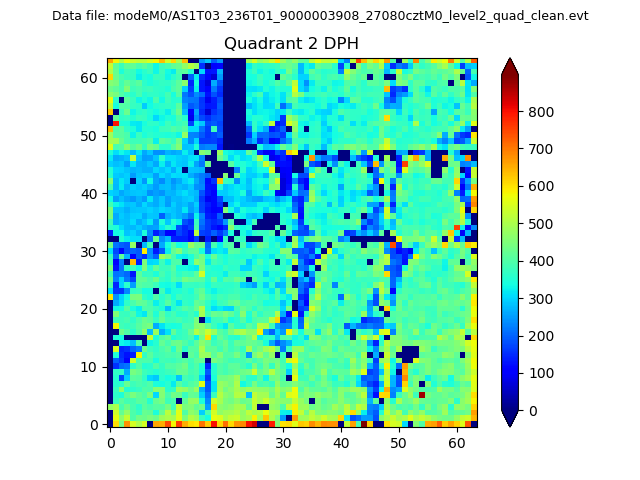 |
Quadrant C |
| Plot type | Count rate plots | Images |
|---|---|---|
| Comparison with Poisson distribution Blue bars denote a histogram of data divided into 1 sec bins. Red curve is a Poisson curve with rate = median count rate of data. |
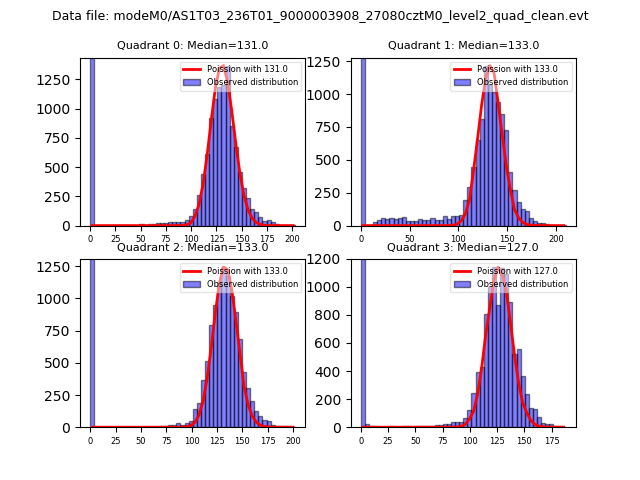 |
 |
| Quadrant-wise count rates Data is divided into 100 sec bins |
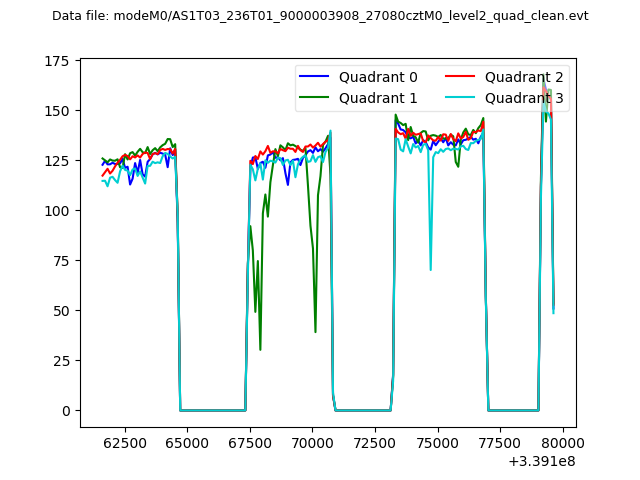 |
|
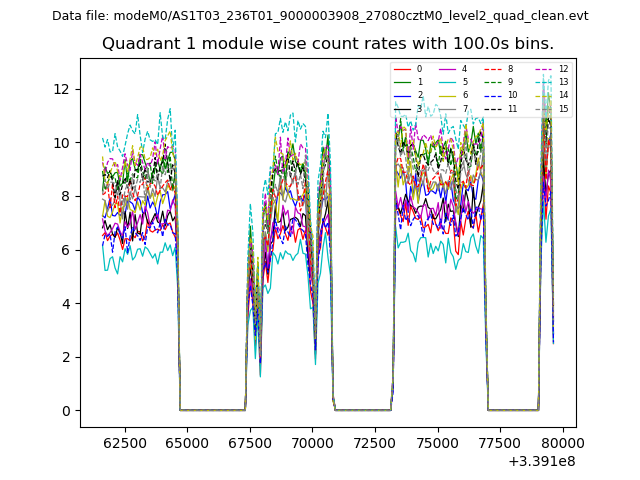
| Module-wise count rates for Quadrant A Data is divided into 100 sec bins |
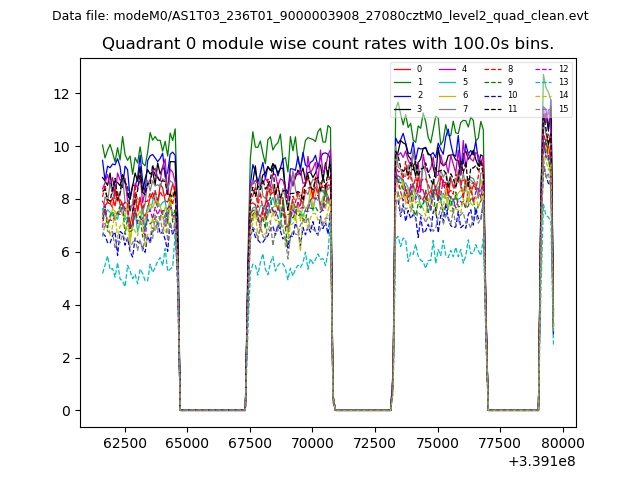 |
 |
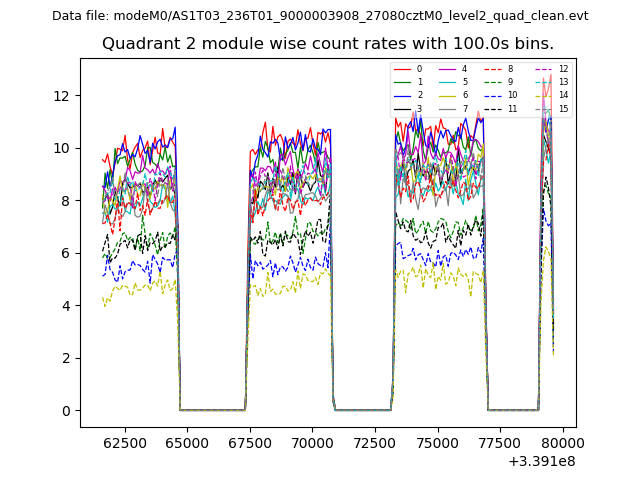
| Module-wise count rates for Quadrant B Data is divided into 100 sec bins |
 |
 |
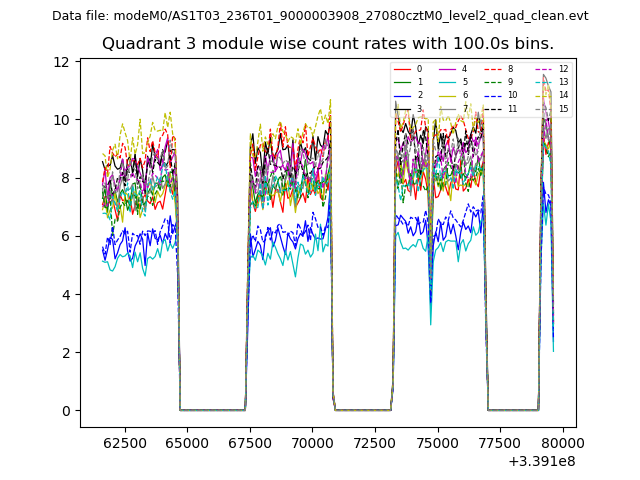
| Module-wise count rates for Quadrant C Data is divided into 100 sec bins |
 |
 |
| Module-wise count rates for Quadrant D Data is divided into 100 sec bins |
 |
 |
| Parameter | Plot |
|---|---|
| CZT HV Monitor | 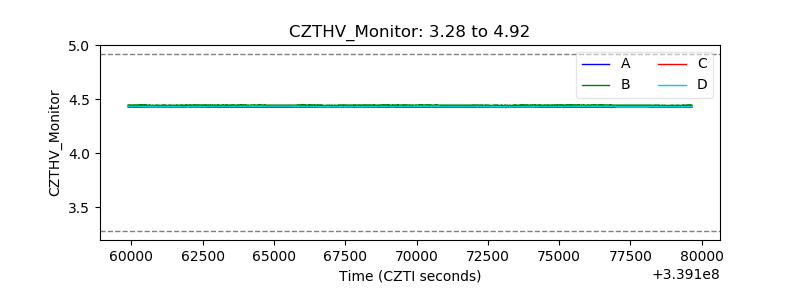 |
| D_VDD | 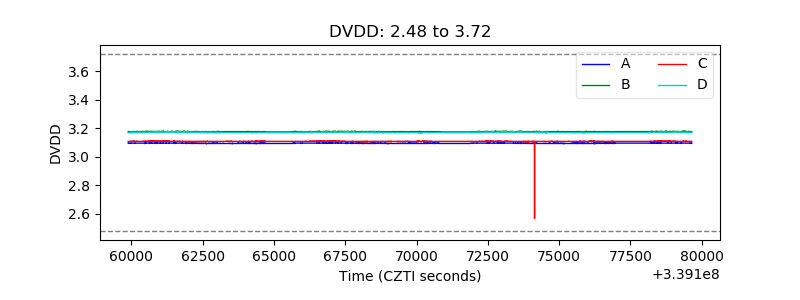 |
| Temperature 1 | 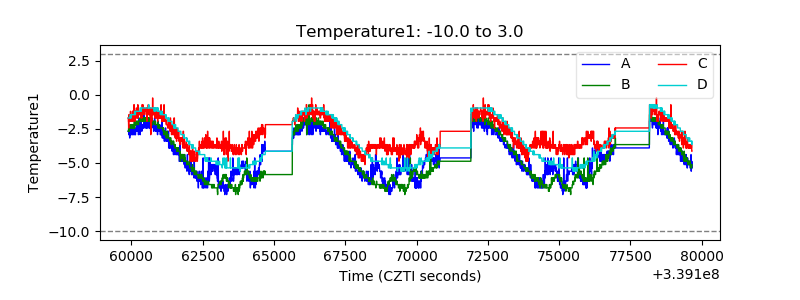 |
| Veto HV Monitor | 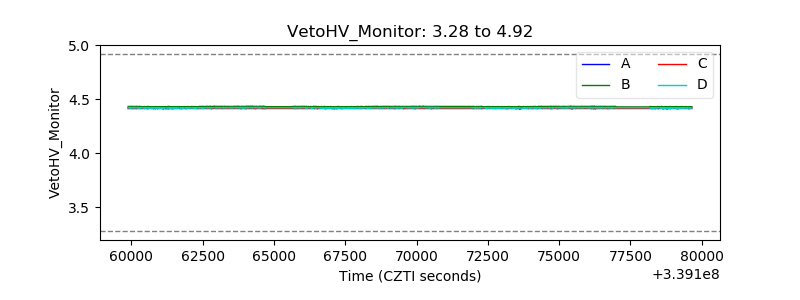 |
| Veto LLD | 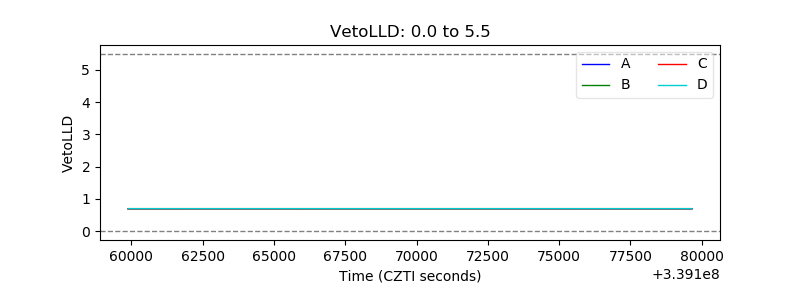 |
| Alpha Counter | 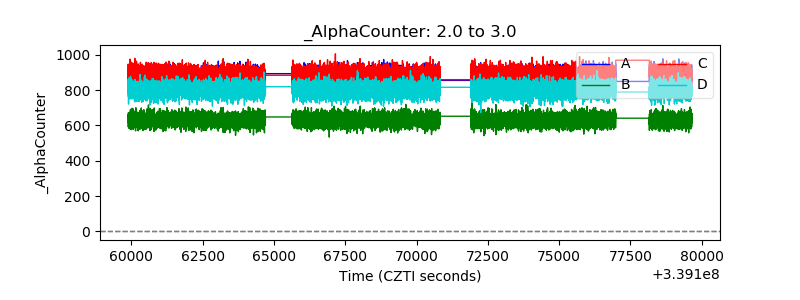 |
| _CPM_Rate | 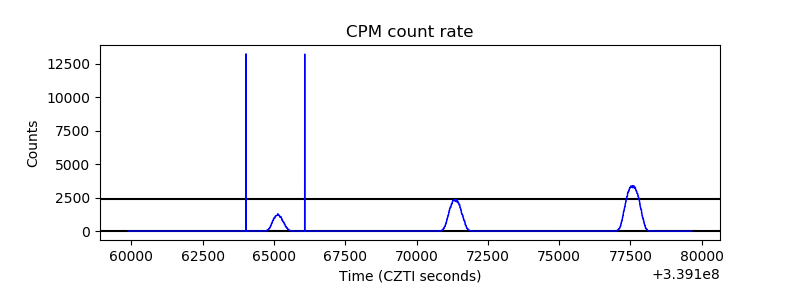 |
| CZT Counter | 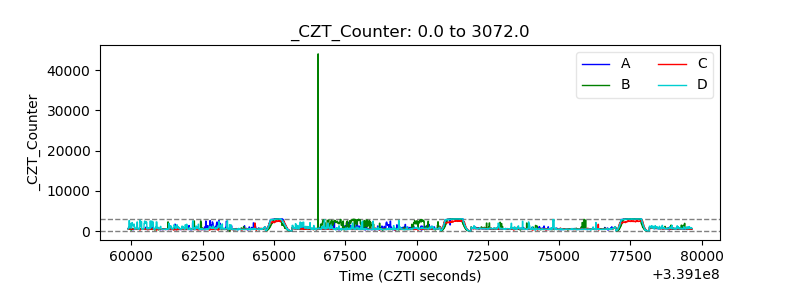 |
| +2.5 Volts monitor |  |
| +5 Volts monitor |  |
| _ROLL_ROT | 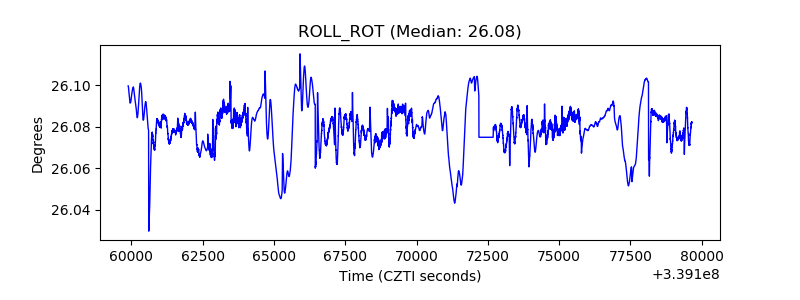 |
| _Roll_DEC |  |
| _Roll_RA | 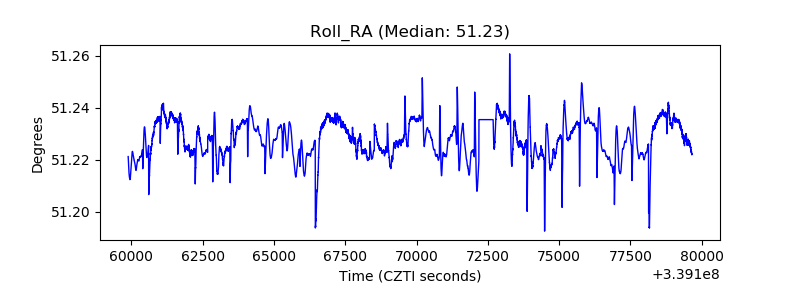 |
| Veto Counter | 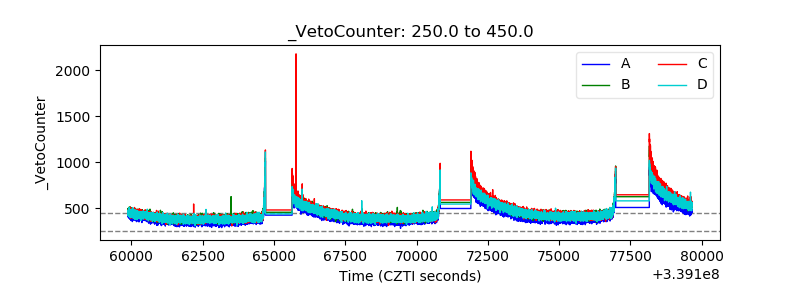 |