| Param | Original file | Final file |
|---|---|---|
| Filename | modeM0/AS1T03_236T01_9000003908_27081cztM0_level2.evt | modeM0/AS1T03_236T01_9000003908_27081cztM0_level2_quad_clean.evt |
| Size (bytes) | 549,181,440 | 100,434,240 |
| Size | 523.7 MB | 95.8 MB |
| Events in quadrant A | 4,358,671 | 636,711 |
| Events in quadrant B | 3,857,058 | 669,742 |
| Events in quadrant C | 3,600,231 | 664,685 |
| Events in quadrant D | 4,387,583 | 629,223 |
| Mode M0 | |||
|---|---|---|---|
| Quadrant | BADHDUFLAG | Total packets | Discarded packets |
| A | 0 | 17218 | 0 |
| B | 0 | 15778 | 0 |
| C | 0 | 14905 | 0 |
| D | 0 | 17461 | 0 |
| Mode M9 | |||
|---|---|---|---|
| Quadrant | BADHDUFLAG | Total packets | Discarded packets |
| A | 0 | 24 | 0 |
| B | 0 | 24 | 0 |
| C | 0 | 24 | 0 |
| D | 0 | 24 | 0 |
| Quadrant | Total seconds | Saturated seconds | Saturation percentage |
|---|---|---|---|
| A | 6323 | 335 | 5.298118% |
| B | 6324 | 188 | 2.972802% |
| C | 6324 | 170 | 2.688172% |
| D | 6324 | 246 | 3.889943% |
Noise dominated data is calculated using 1-second bins in cleaned event files. If a bin has >2000 counts, and if more than 50% of those come from <1% of pixels, then it is considered to be noise-dominated and hence unusable.
| Quadrant | # 1 sec bins | Bins with >0 counts | Bins with >2000 counts | High rate bins dominated by noise | Noise dominated (total time) | Noise dominated (detector-on time) | Marked lightcurve |
|---|---|---|---|---|---|---|---|
| A | 8783 | 6325 | 151 | 151 | 1.72% | 2.39% | 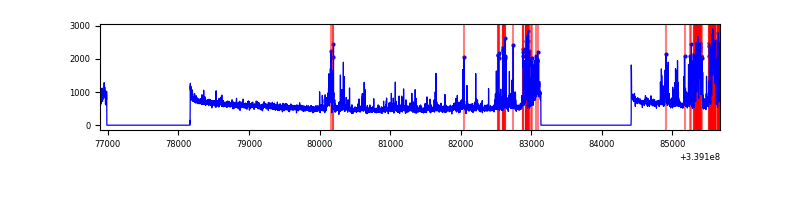 |
| B | 8784 | 6326 | 49 | 49 | 0.56% | 0.77% | 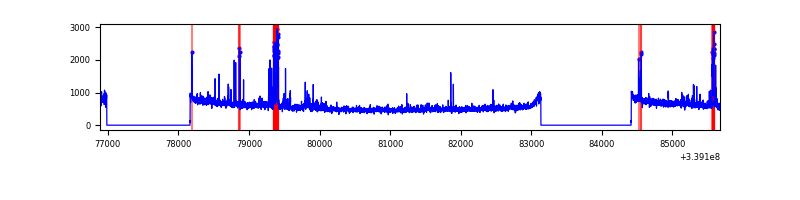 |
| C | 8784 | 6326 | 0 | 0 | 0.00% | 0.00% | 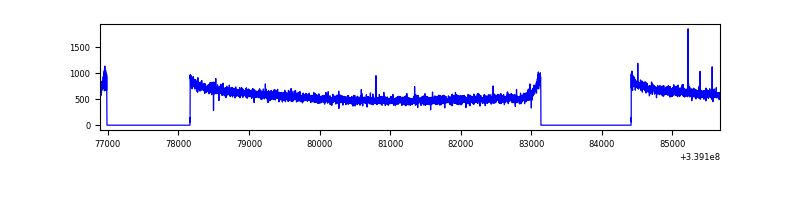 |
| D | 8784 | 6326 | 124 | 124 | 1.41% | 1.96% | 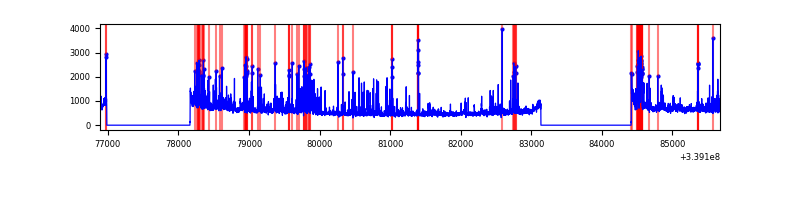 |
Top three noisy pixels from each quadrant. If the there are fewer than three noisy pixels in the level2.evt file, extra rows are filled as -1
| Pixel properties | Quadrant properties | ||||||
|---|---|---|---|---|---|---|---|
| Quadrant | DetID | PixID | Counts | Sigma | Mean | Median | Sigma |
| A | 14 | 235 | 950909 | 5489.44 | 874 | 862 | 173.1 |
| A | 12 | 189 | 23031 | 128.09 | 874 | 862 | 173.1 |
| A | 13 | 254 | 10716 | 56.94 | 874 | 862 | 173.1 |
| B | 0 | 189 | 216201 | 1289.64 | 891 | 871 | 167.0 |
| B | 3 | 112 | 133734 | 795.74 | 891 | 871 | 167.0 |
| B | 12 | 111 | 19254 | 110.1 | 891 | 871 | 167.0 |
| C | 14 | 238 | 142001 | 690.19 | 884 | 892 | 204.4 |
| C | 15 | 208 | 10049 | 44.79 | 884 | 892 | 204.4 |
| C | 13 | 61 | 6131 | 25.62 | 884 | 892 | 204.4 |
| D | 1 | 52 | 970799 | 4726.17 | 873 | 855 | 205.2 |
| D | 2 | 250 | 106856 | 516.5 | 873 | 855 | 205.2 |
| D | 2 | 234 | 29731 | 140.7 | 873 | 855 | 205.2 |
Histogram calculated using DETX and DETY for each event in the final _common_clean file
| Quadrant A | 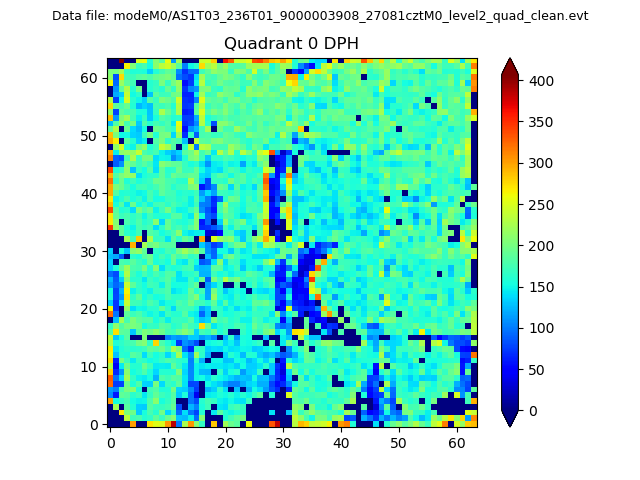 |
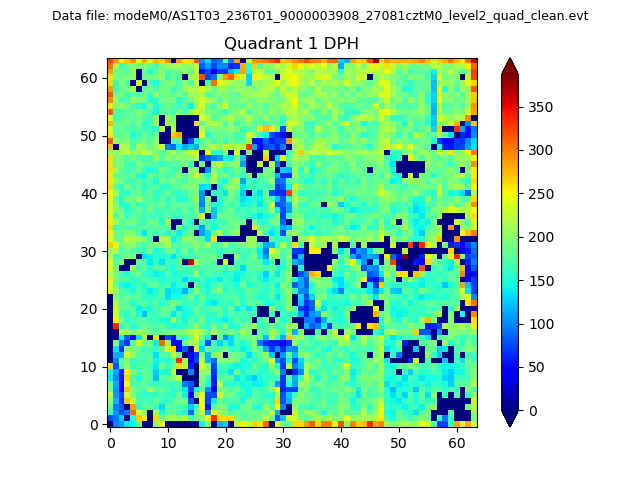 |
Quadrant B |
|---|---|---|---|
| Quadrant D | 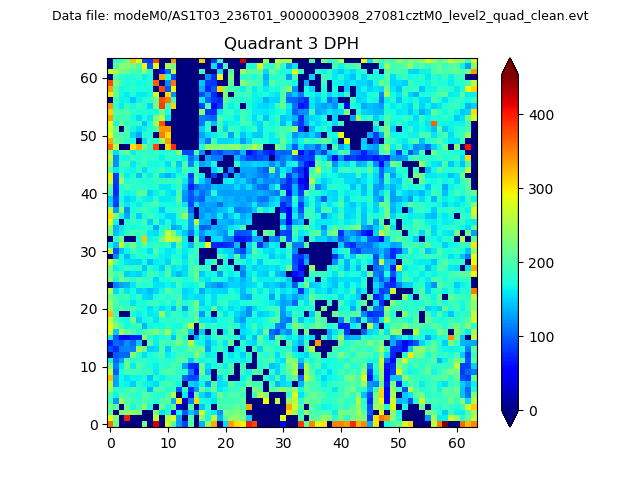 |
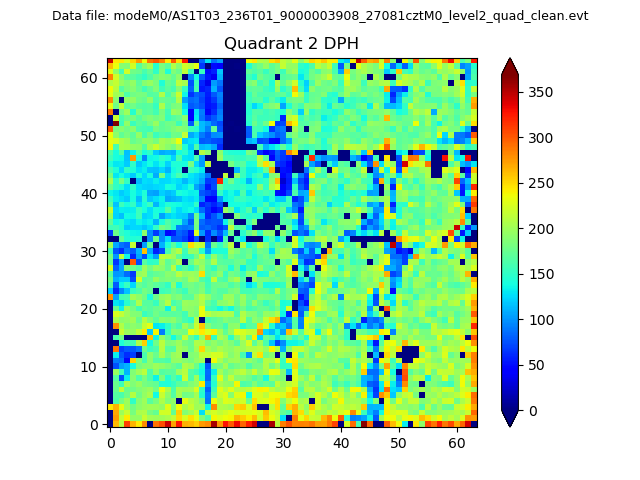 |
Quadrant C |
| Plot type | Count rate plots | Images |
|---|---|---|
| Comparison with Poisson distribution Blue bars denote a histogram of data divided into 1 sec bins. Red curve is a Poisson curve with rate = median count rate of data. |
 |
 |
| Quadrant-wise count rates Data is divided into 100 sec bins |
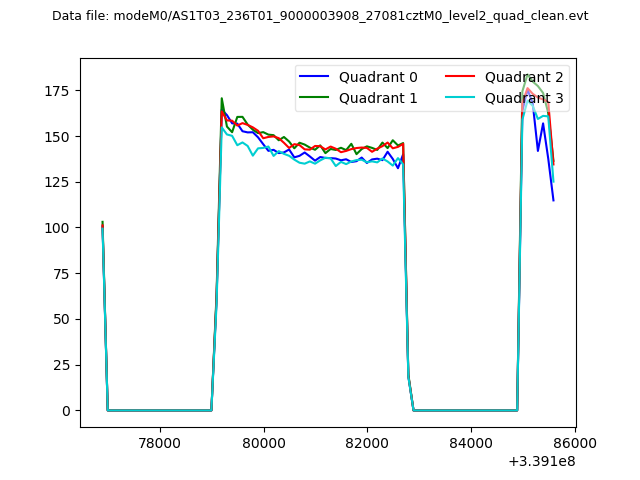 |
|
| Module-wise count rates for Quadrant A Data is divided into 100 sec bins |
 |
 |
| Module-wise count rates for Quadrant B Data is divided into 100 sec bins |
 |
 |
| Module-wise count rates for Quadrant C Data is divided into 100 sec bins |
 |
 |
| Module-wise count rates for Quadrant D Data is divided into 100 sec bins |
 |
 |
| Parameter | Plot |
|---|---|
| CZT HV Monitor |  |
| D_VDD | 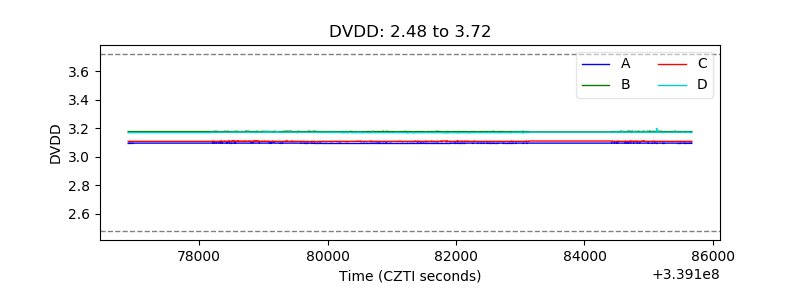 |
| Temperature 1 | 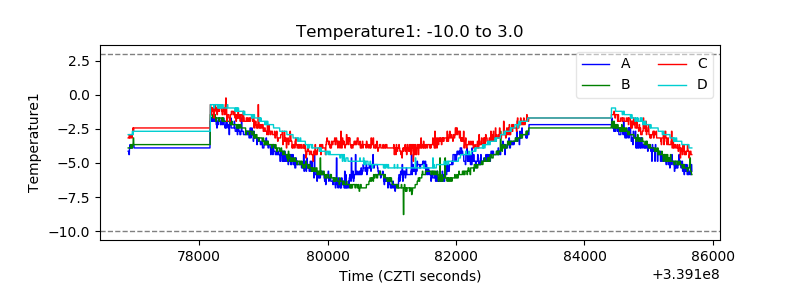 |
| Veto HV Monitor | 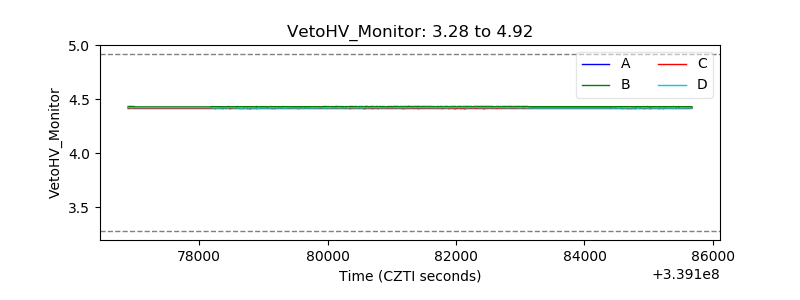 |
| Veto LLD | 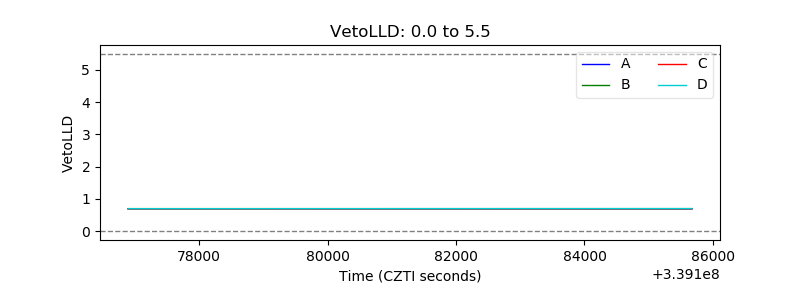 |
| Alpha Counter | 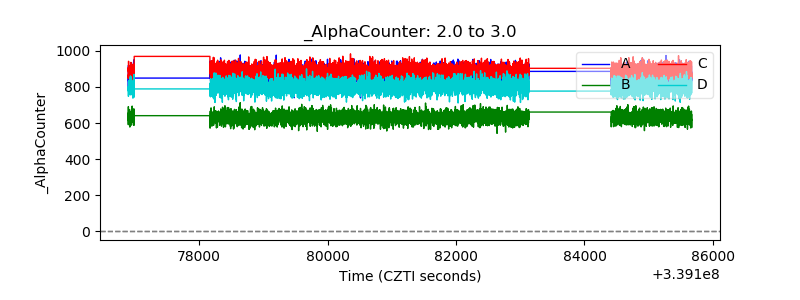 |
| _CPM_Rate | 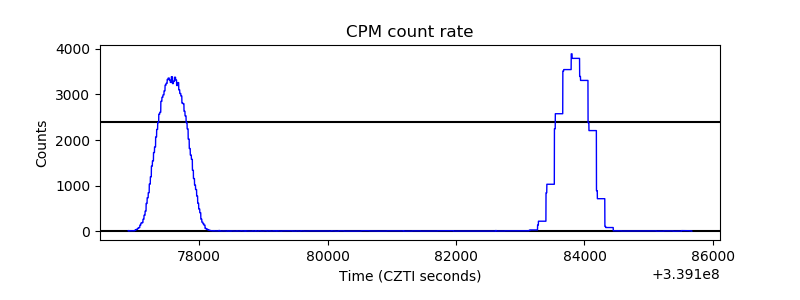 |
| CZT Counter | 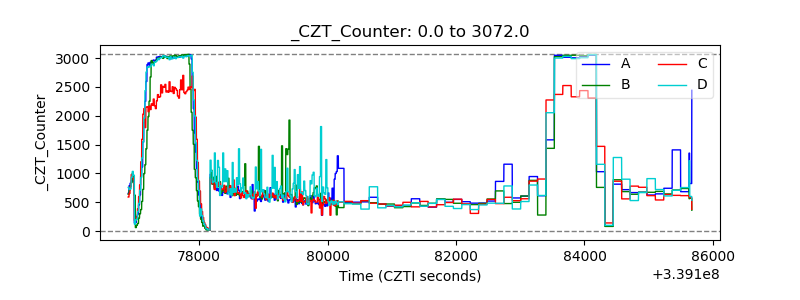 |
| +2.5 Volts monitor |  |
| +5 Volts monitor | 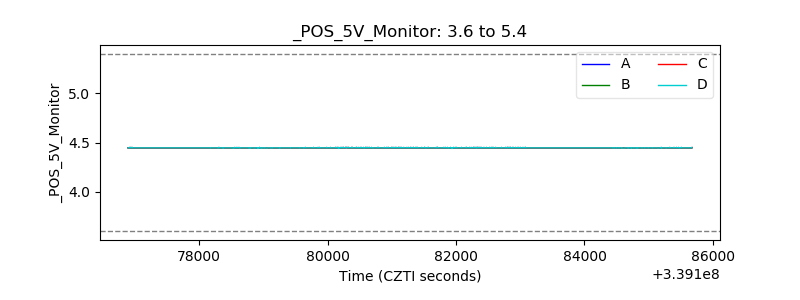 |
| _ROLL_ROT |  |
| _Roll_DEC | 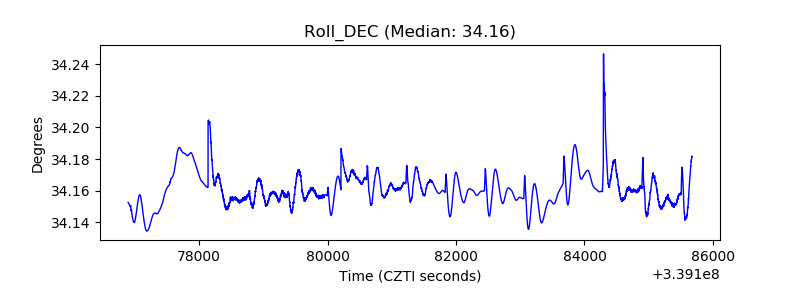 |
| _Roll_RA | 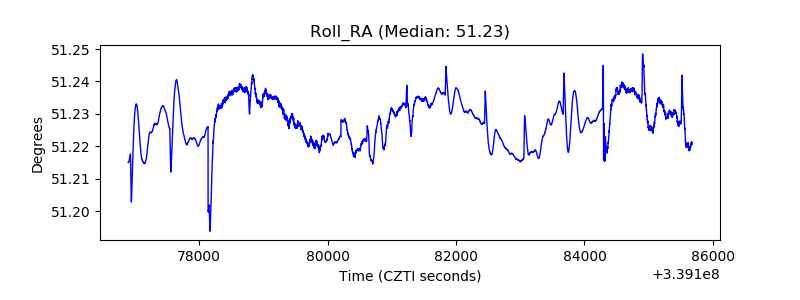 |
| Veto Counter |  |