| Param | Original file | Final file |
|---|---|---|
| Filename | modeM0/AS1T03_236T01_9000003908_27082cztM0_level2.evt | modeM0/AS1T03_236T01_9000003908_27082cztM0_level2_quad_clean.evt |
| Size (bytes) | 619,346,880 | 111,360,960 |
| Size | 590.7 MB | 106.2 MB |
| Events in quadrant A | 4,807,753 | 718,370 |
| Events in quadrant B | 4,412,649 | 751,061 |
| Events in quadrant C | 3,548,743 | 760,964 |
| Events in quadrant D | 5,563,330 | 704,090 |
| Mode M0 | |||
|---|---|---|---|
| Quadrant | BADHDUFLAG | Total packets | Discarded packets |
| A | 0 | 18569 | 0 |
| B | 0 | 17328 | 0 |
| C | 0 | 14622 | 0 |
| D | 0 | 20957 | 0 |
| Mode M9 | |||
|---|---|---|---|
| Quadrant | BADHDUFLAG | Total packets | Discarded packets |
| A | 0 | 22 | 0 |
| B | 0 | 23 | 0 |
| C | 0 | 23 | 0 |
| D | 0 | 23 | 0 |
| Quadrant | Total seconds | Saturated seconds | Saturation percentage |
|---|---|---|---|
| A | 6275 | 347 | 5.529880% |
| B | 6275 | 335 | 5.338645% |
| C | 6275 | 155 | 2.470120% |
| D | 6275 | 532 | 8.478088% |
Noise dominated data is calculated using 1-second bins in cleaned event files. If a bin has >2000 counts, and if more than 50% of those come from <1% of pixels, then it is considered to be noise-dominated and hence unusable.
| Quadrant | # 1 sec bins | Bins with >0 counts | Bins with >2000 counts | High rate bins dominated by noise | Noise dominated (total time) | Noise dominated (detector-on time) | Marked lightcurve |
|---|---|---|---|---|---|---|---|
| A | 7595 | 6276 | 230 | 230 | 3.03% | 3.66% | 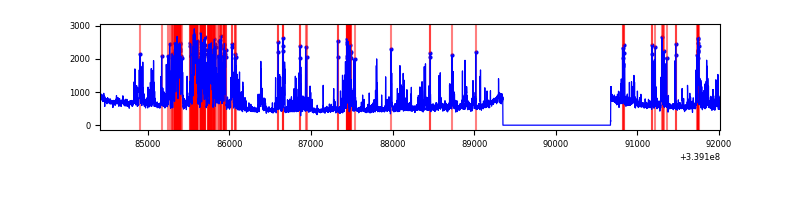 |
| B | 7595 | 6276 | 190 | 190 | 2.50% | 3.03% | 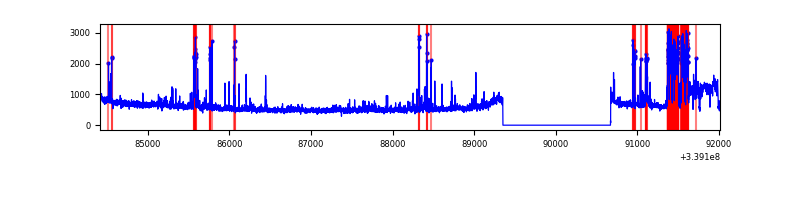 |
| C | 7595 | 6276 | 0 | 0 | 0.00% | 0.00% | 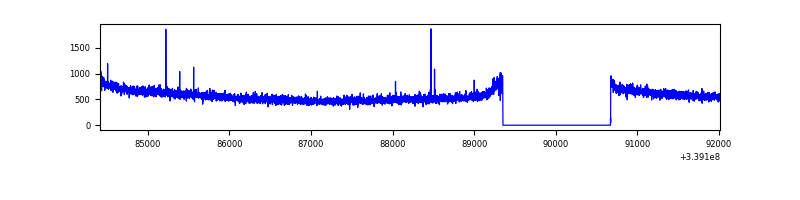 |
| D | 7595 | 6276 | 361 | 361 | 4.75% | 5.75% |  |
Top three noisy pixels from each quadrant. If the there are fewer than three noisy pixels in the level2.evt file, extra rows are filled as -1
| Pixel properties | Quadrant properties | ||||||
|---|---|---|---|---|---|---|---|
| Quadrant | DetID | PixID | Counts | Sigma | Mean | Median | Sigma |
| A | 14 | 235 | 1460201 | 8638.92 | 855 | 841 | 168.9 |
| A | 12 | 189 | 25769 | 147.56 | 855 | 841 | 168.9 |
| A | 6 | 16 | 14663 | 81.82 | 855 | 841 | 168.9 |
| B | 0 | 189 | 821873 | 5129.49 | 865 | 848 | 160.1 |
| B | 3 | 112 | 175821 | 1093.17 | 865 | 848 | 160.1 |
| B | 12 | 111 | 18535 | 110.5 | 865 | 848 | 160.1 |
| C | 14 | 238 | 140024 | 691.31 | 870 | 879 | 201.3 |
| C | 15 | 208 | 12407 | 57.27 | 870 | 879 | 201.3 |
| C | 13 | 61 | 6015 | 25.52 | 870 | 879 | 201.3 |
| D | 1 | 52 | 2076598 | 10474.27 | 840 | 821 | 198.2 |
| D | 2 | 250 | 315984 | 1590.29 | 840 | 821 | 198.2 |
| D | 2 | 234 | 27511 | 134.67 | 840 | 821 | 198.2 |
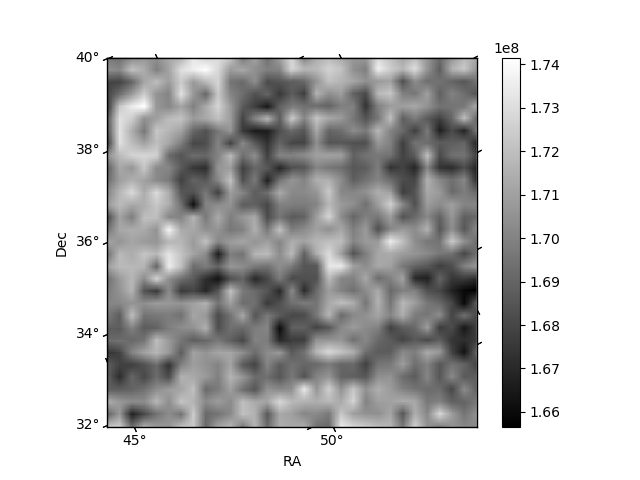
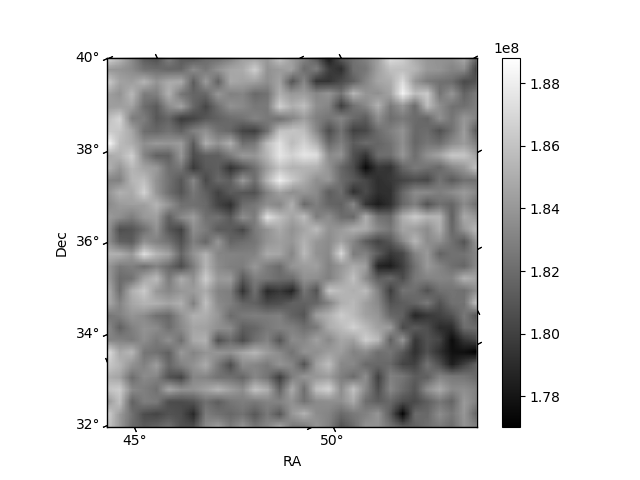
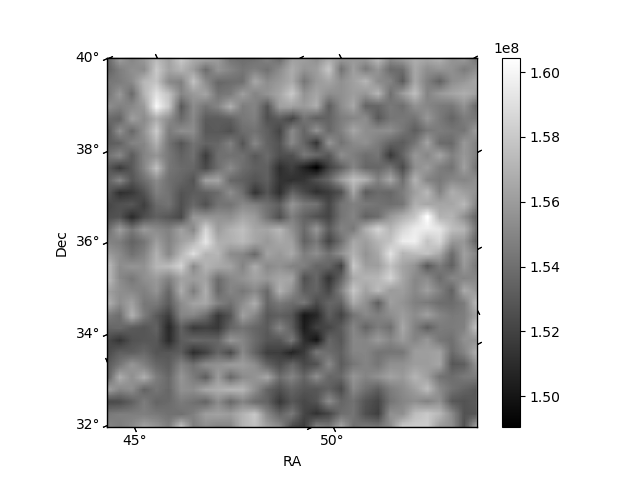
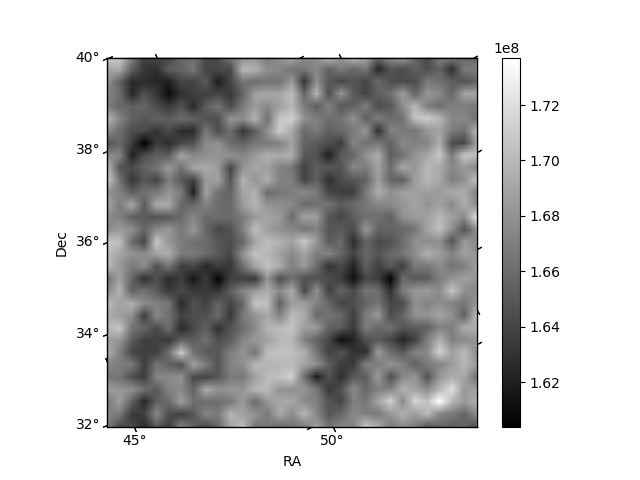
Histogram calculated using DETX and DETY for each event in the final _common_clean file
| Quadrant A | 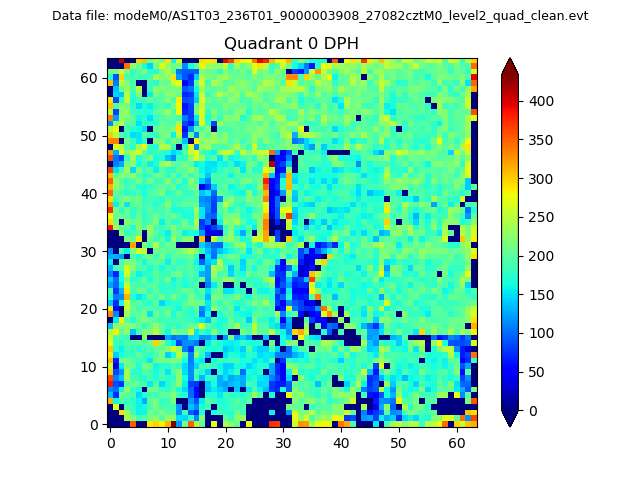 |
 |
Quadrant B |
|---|---|---|---|
| Quadrant D |  |
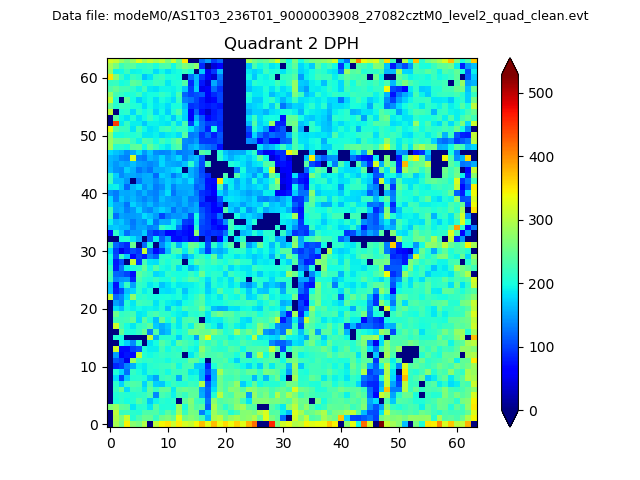 |
Quadrant C |
| Plot type | Count rate plots | Images |
|---|---|---|
| Comparison with Poisson distribution Blue bars denote a histogram of data divided into 1 sec bins. Red curve is a Poisson curve with rate = median count rate of data. |
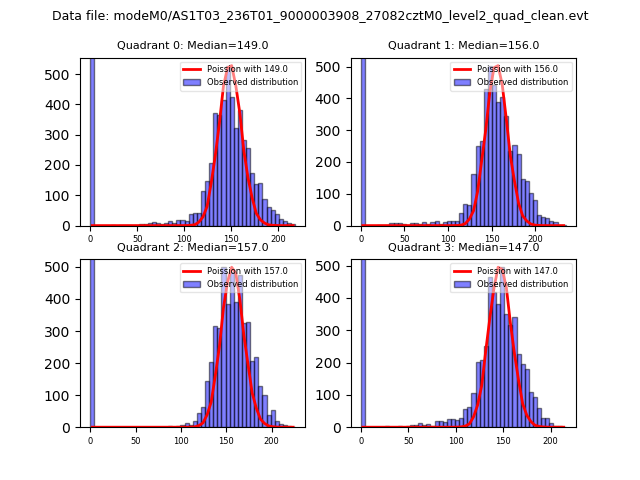 |
 |
| Quadrant-wise count rates Data is divided into 100 sec bins |
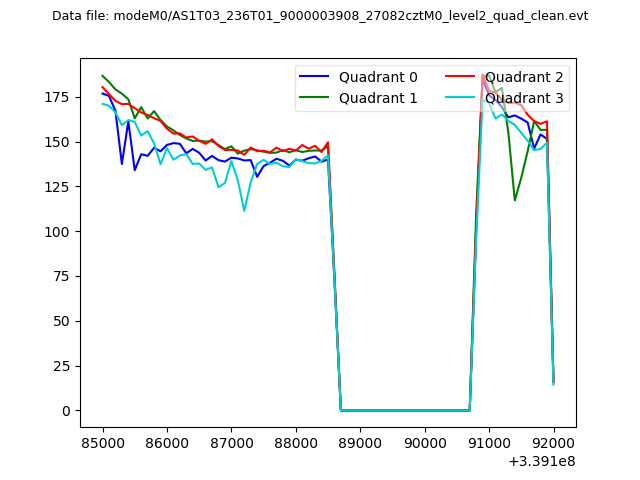 |
|
| Module-wise count rates for Quadrant A Data is divided into 100 sec bins |
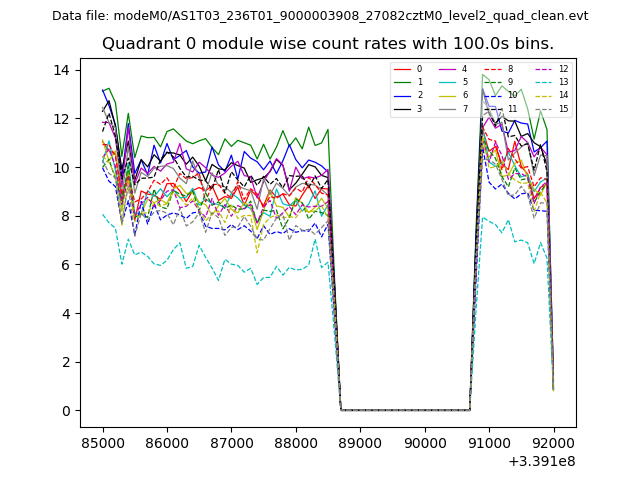 |
 |
| Module-wise count rates for Quadrant B Data is divided into 100 sec bins |
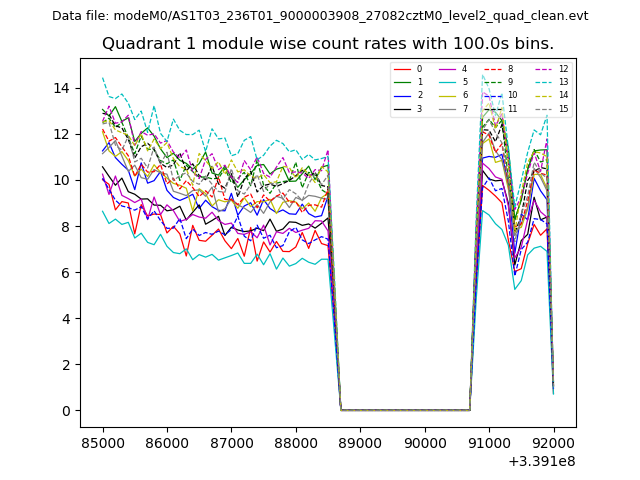 |
 |
| Module-wise count rates for Quadrant C Data is divided into 100 sec bins |
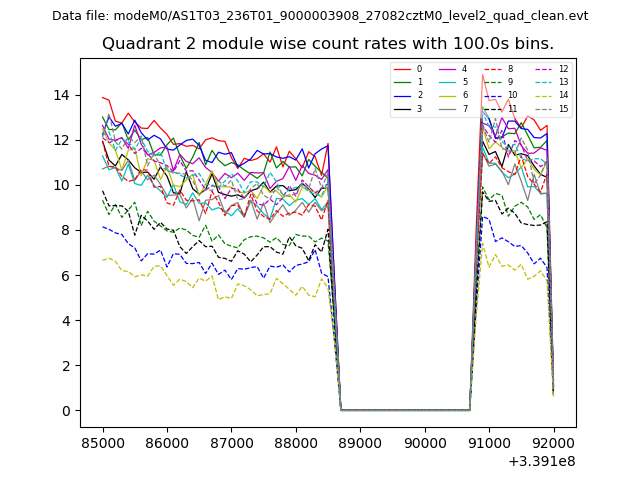 |
 |
| Module-wise count rates for Quadrant D Data is divided into 100 sec bins |
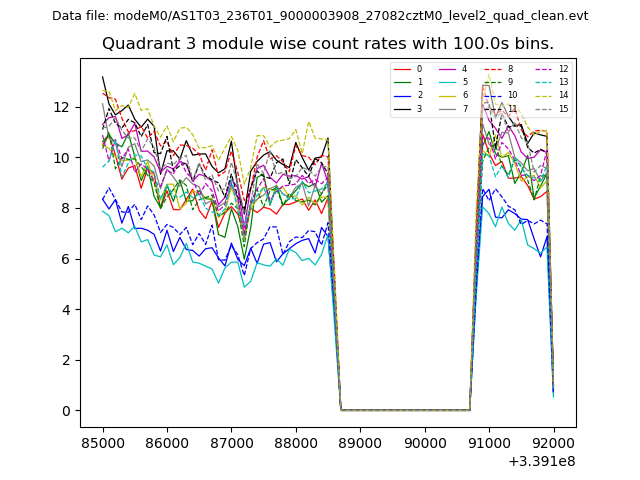 |
 |
| Parameter | Plot |
|---|---|
| CZT HV Monitor | 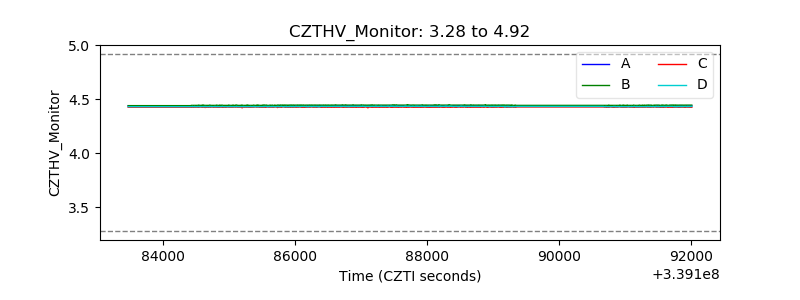 |
| D_VDD |  |
| Temperature 1 | 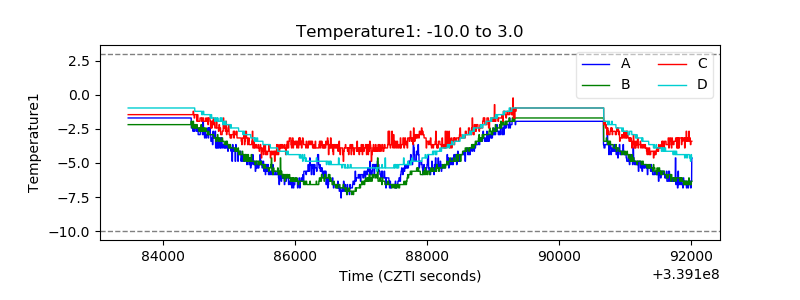 |
| Veto HV Monitor |  |
| Veto LLD | 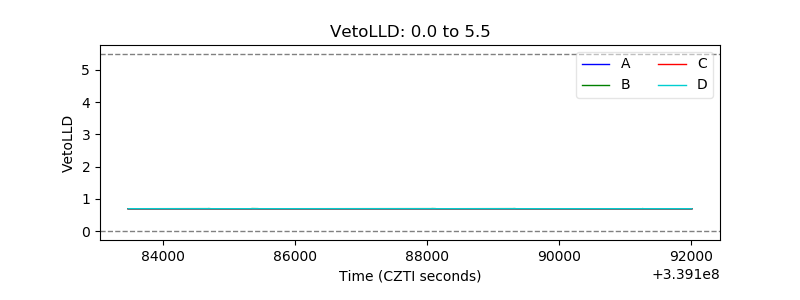 |
| Alpha Counter | 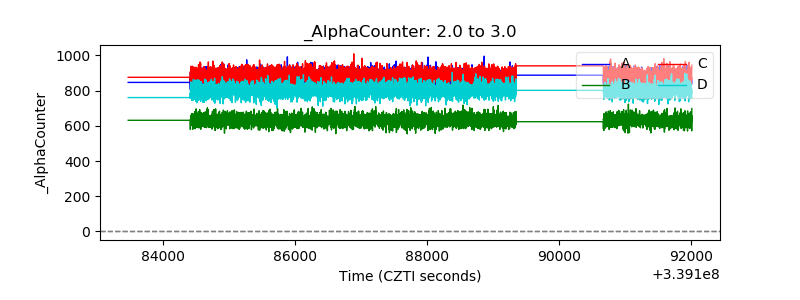 |
| _CPM_Rate | 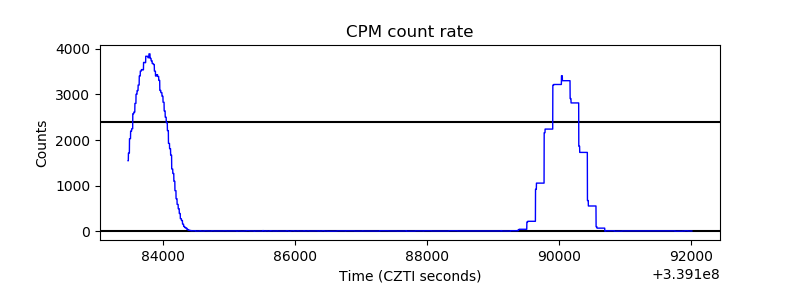 |
| CZT Counter | 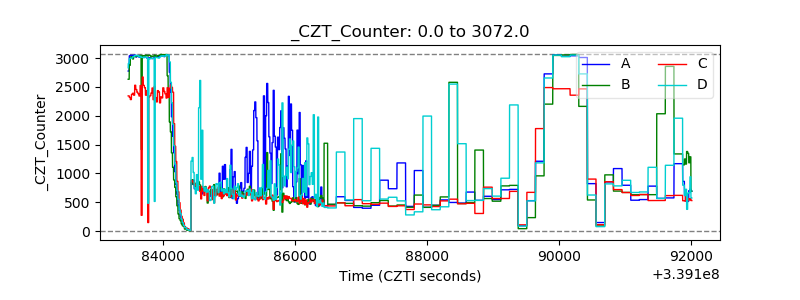 |
| +2.5 Volts monitor |  |
| +5 Volts monitor | 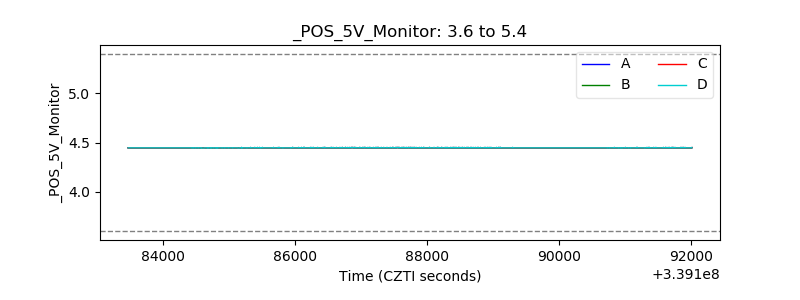 |
| _ROLL_ROT | 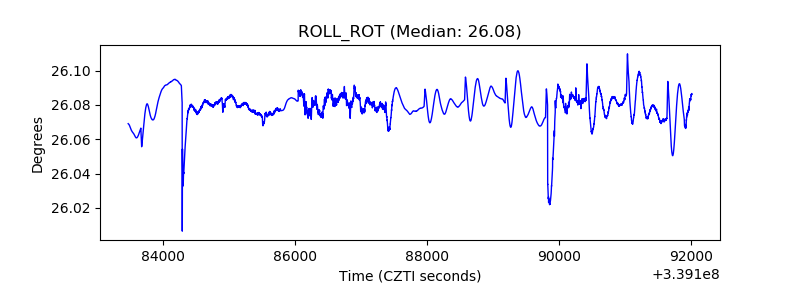 |
| _Roll_DEC | 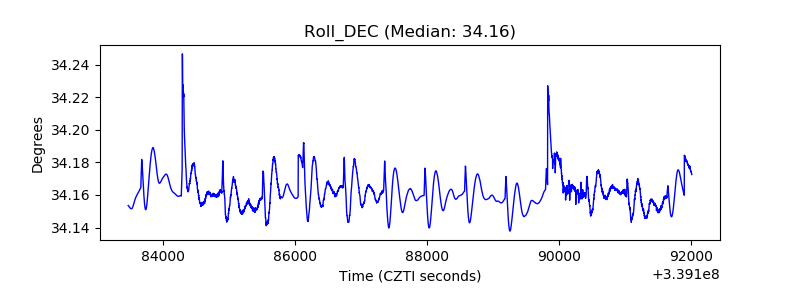 |
| _Roll_RA | 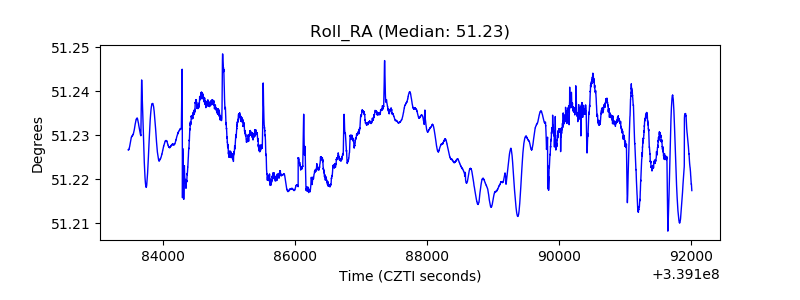 |
| Veto Counter | 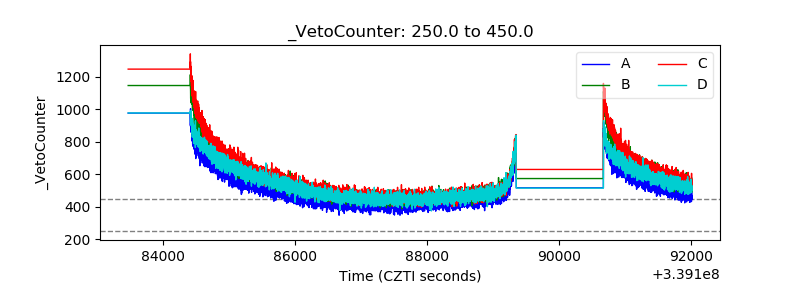 |