| Param | Original file | Final file |
|---|---|---|
| Filename | modeM0/AS1T03_236T01_9000003908_27083cztM0_level2.evt | modeM0/AS1T03_236T01_9000003908_27083cztM0_level2_quad_clean.evt |
| Size (bytes) | 548,012,160 | 111,683,520 |
| Size | 522.6 MB | 106.5 MB |
| Events in quadrant A | 3,942,854 | 728,222 |
| Events in quadrant B | 4,292,179 | 754,302 |
| Events in quadrant C | 3,386,398 | 760,754 |
| Events in quadrant D | 4,553,229 | 704,529 |
| Mode M0 | |||
|---|---|---|---|
| Quadrant | BADHDUFLAG | Total packets | Discarded packets |
| A | 0 | 15672 | 0 |
| B | 0 | 16860 | 0 |
| C | 0 | 13943 | 0 |
| D | 0 | 17889 | 0 |
| Mode M9 | |||
|---|---|---|---|
| Quadrant | BADHDUFLAG | Total packets | Discarded packets |
| A | 0 | 27 | 0 |
| B | 0 | 27 | 0 |
| C | 0 | 27 | 0 |
| D | 0 | 27 | 0 |
| Quadrant | Total seconds | Saturated seconds | Saturation percentage |
|---|---|---|---|
| A | 6228 | 186 | 2.986513% |
| B | 6229 | 318 | 5.105153% |
| C | 6228 | 149 | 2.392421% |
| D | 6228 | 292 | 4.688504% |
Noise dominated data is calculated using 1-second bins in cleaned event files. If a bin has >2000 counts, and if more than 50% of those come from <1% of pixels, then it is considered to be noise-dominated and hence unusable.
| Quadrant | # 1 sec bins | Bins with >0 counts | Bins with >2000 counts | High rate bins dominated by noise | Noise dominated (total time) | Noise dominated (detector-on time) | Marked lightcurve |
|---|---|---|---|---|---|---|---|
| A | 8908 | 6230 | 89 | 89 | 1.00% | 1.43% | 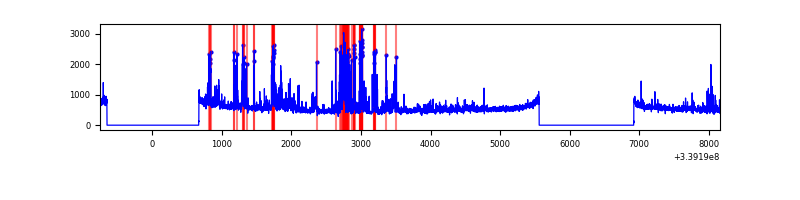 |
| B | 8909 | 6231 | 162 | 162 | 1.82% | 2.60% | 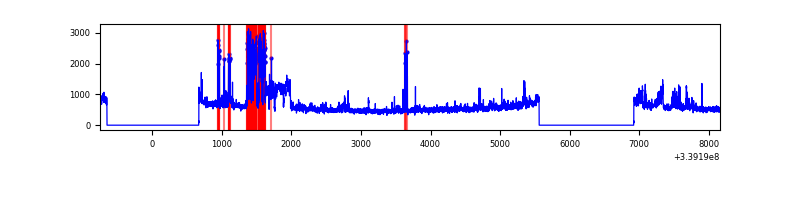 |
| C | 8908 | 6230 | 0 | 0 | 0.00% | 0.00% | 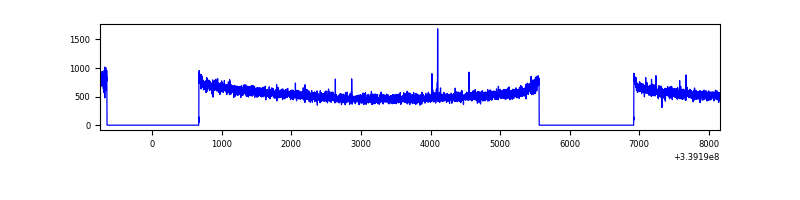 |
| D | 8908 | 6230 | 183 | 183 | 2.05% | 2.94% | 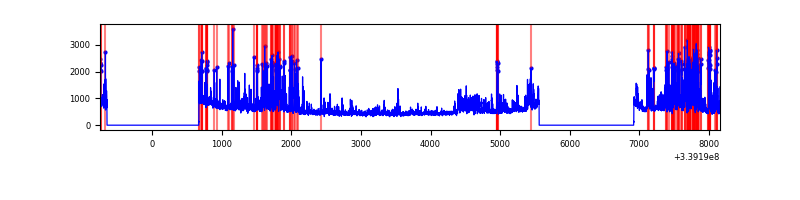 |
Top three noisy pixels from each quadrant. If the there are fewer than three noisy pixels in the level2.evt file, extra rows are filled as -1
| Pixel properties | Quadrant properties | ||||||
|---|---|---|---|---|---|---|---|
| Quadrant | DetID | PixID | Counts | Sigma | Mean | Median | Sigma |
| A | 14 | 235 | 698969 | 4261.95 | 826 | 811 | 163.8 |
| A | 6 | 16 | 47976 | 287.92 | 826 | 811 | 163.8 |
| A | 13 | 254 | 10314 | 58.01 | 826 | 811 | 163.8 |
| B | 0 | 189 | 857329 | 5464.24 | 832 | 812 | 156.7 |
| B | 3 | 112 | 161921 | 1027.81 | 832 | 812 | 156.7 |
| B | 0 | 219 | 20887 | 128.07 | 832 | 812 | 156.7 |
| C | 14 | 238 | 132477 | 682.95 | 831 | 840 | 192.7 |
| C | 2 | 16 | 8245 | 38.42 | 831 | 840 | 192.7 |
| C | 15 | 208 | 7098 | 32.47 | 831 | 840 | 192.7 |
| D | 1 | 52 | 1067351 | 5629.47 | 812 | 795 | 189.5 |
| D | 2 | 250 | 398330 | 2098.26 | 812 | 795 | 189.5 |
| D | 2 | 234 | 25627 | 131.07 | 812 | 795 | 189.5 |
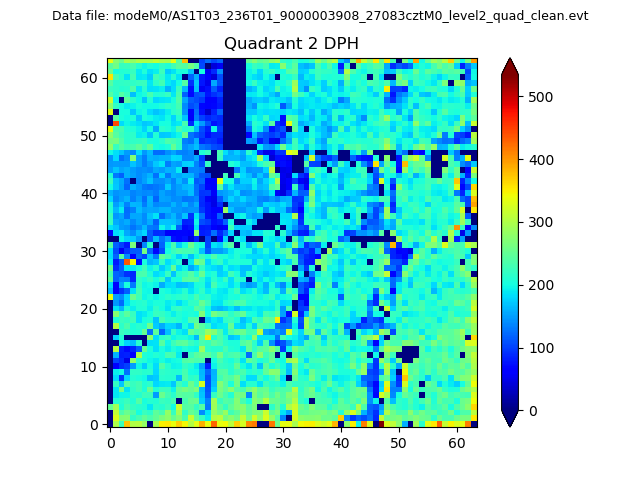
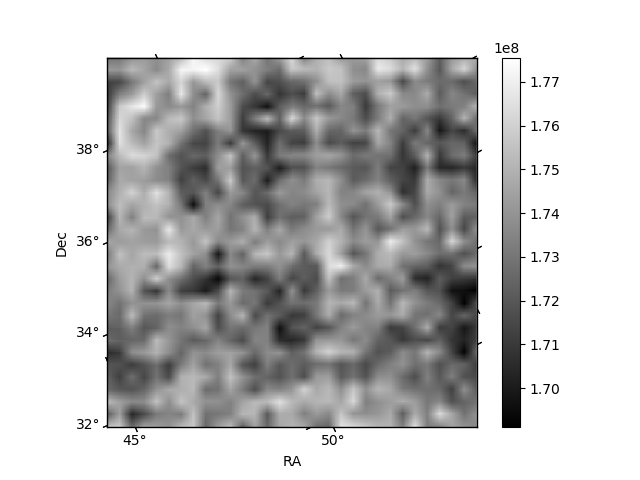
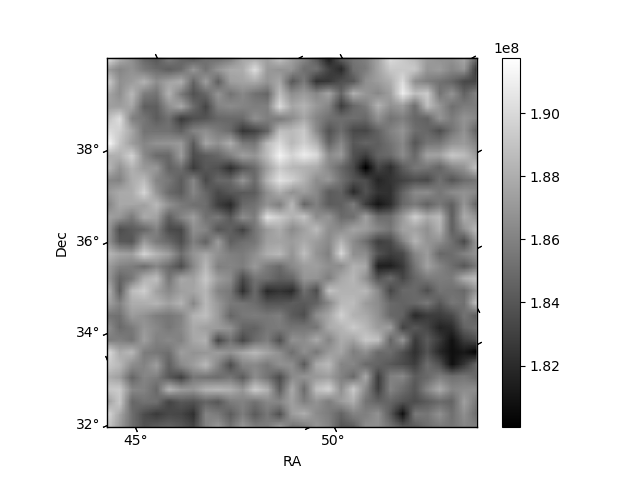
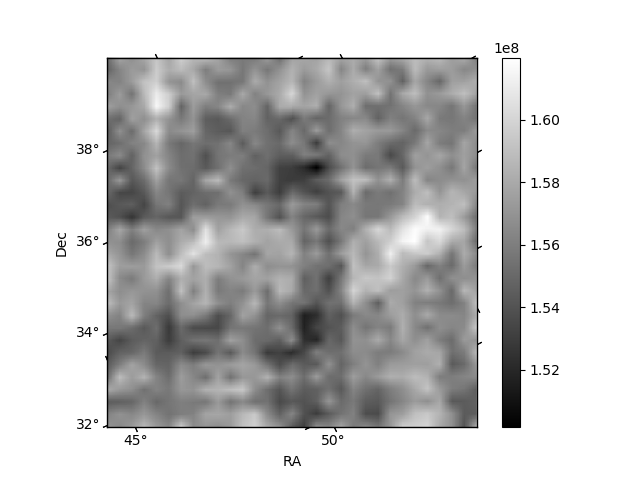
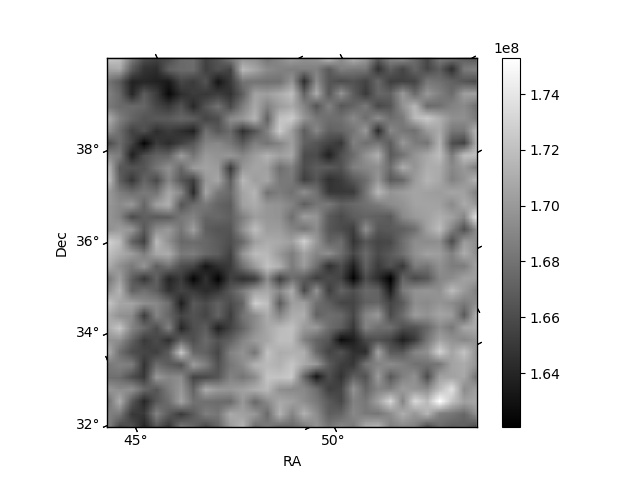
Histogram calculated using DETX and DETY for each event in the final _common_clean file
| Quadrant A |  |
 |
Quadrant B |
|---|---|---|---|
| Quadrant D | 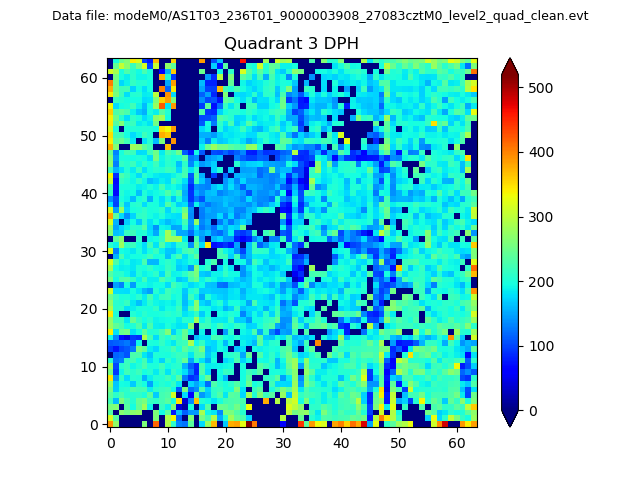 |
 |
Quadrant C |
| Plot type | Count rate plots | Images |
|---|---|---|
| Comparison with Poisson distribution Blue bars denote a histogram of data divided into 1 sec bins. Red curve is a Poisson curve with rate = median count rate of data. |
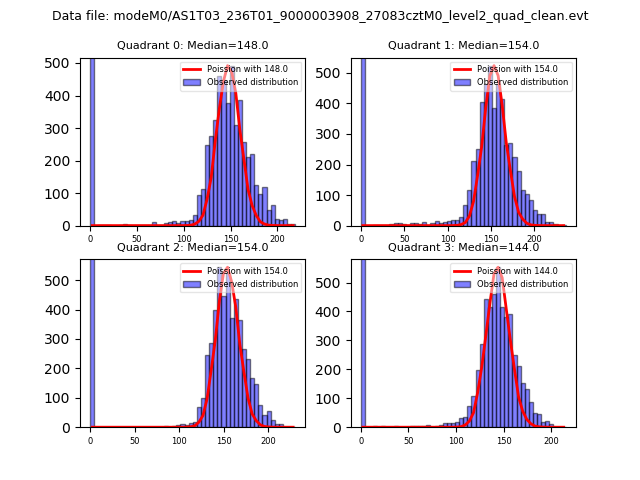 |
 |
| Quadrant-wise count rates Data is divided into 100 sec bins |
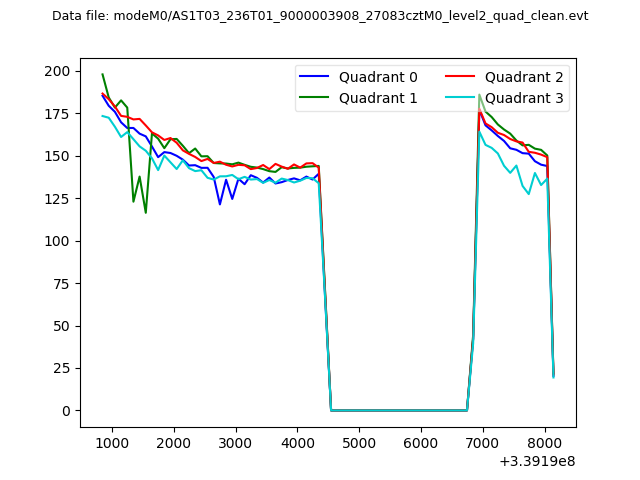 |
|
| Module-wise count rates for Quadrant A Data is divided into 100 sec bins |
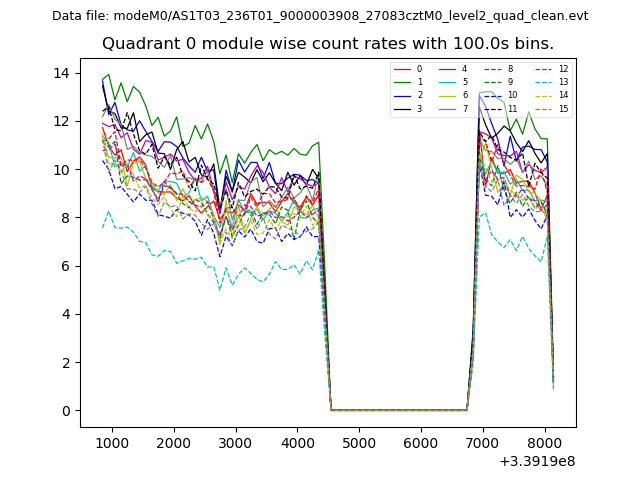 |
 |
| Module-wise count rates for Quadrant B Data is divided into 100 sec bins |
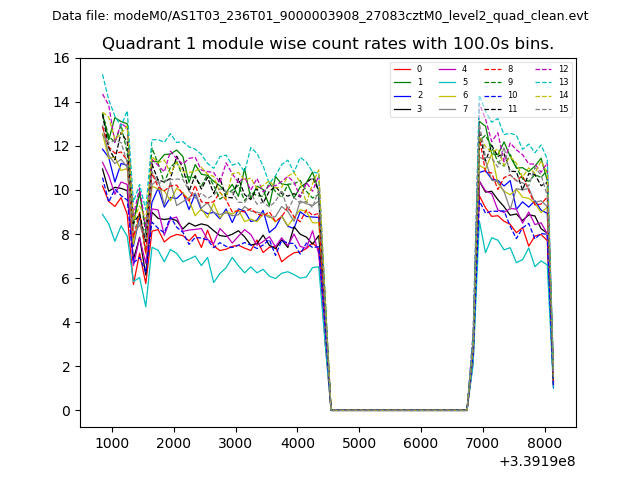 |
 |
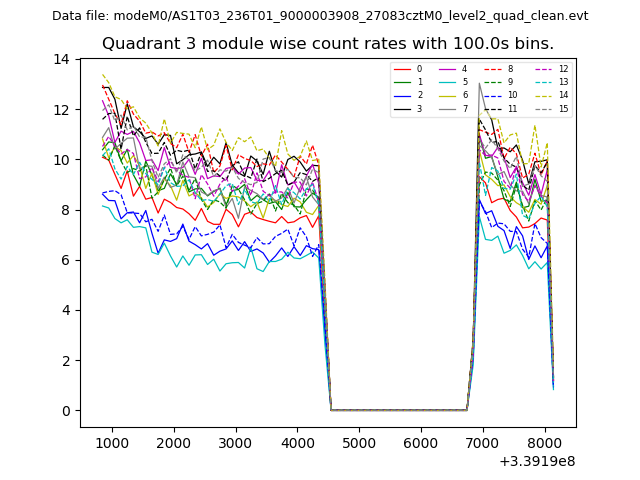
| Module-wise count rates for Quadrant C Data is divided into 100 sec bins |
 |
 |
| Module-wise count rates for Quadrant D Data is divided into 100 sec bins |
 |
 |
| Parameter | Plot |
|---|---|
| CZT HV Monitor | 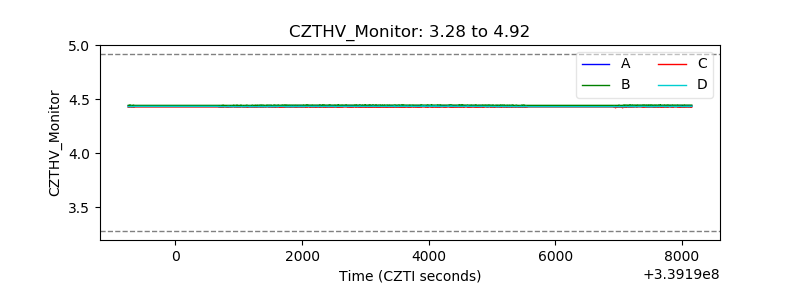 |
| D_VDD | 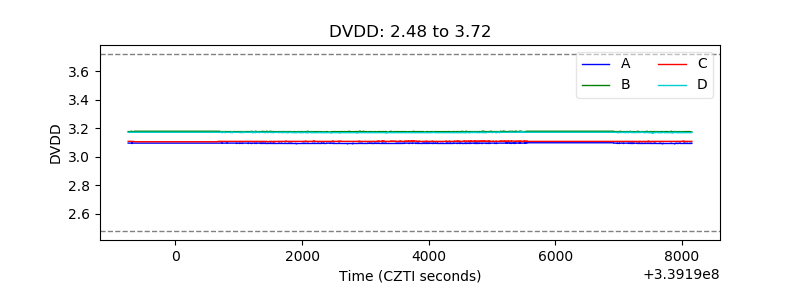 |
| Temperature 1 | 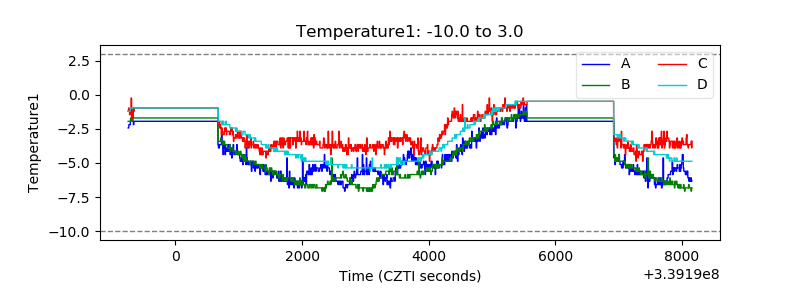 |
| Veto HV Monitor | 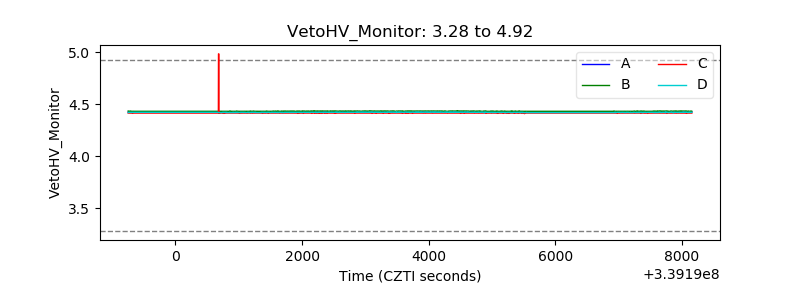 |
| Veto LLD | 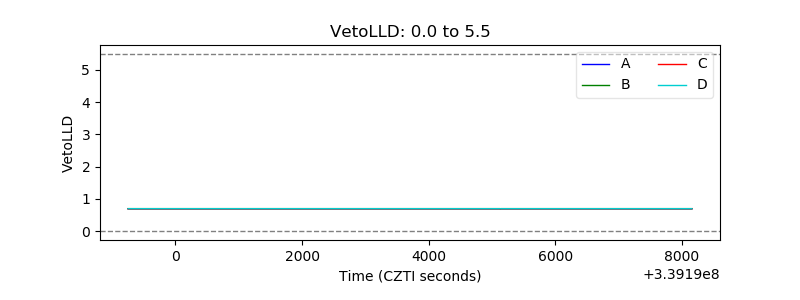 |
| Alpha Counter | 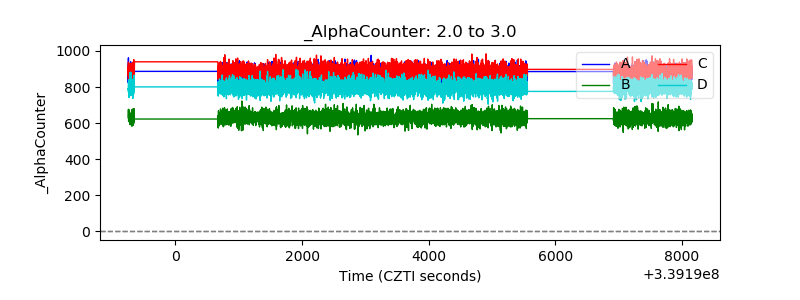 |
| _CPM_Rate | 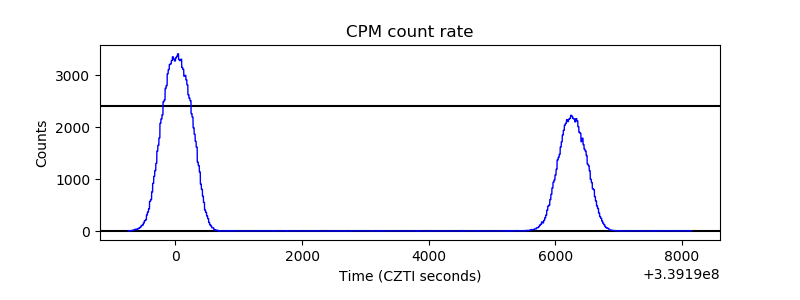 |
| CZT Counter | 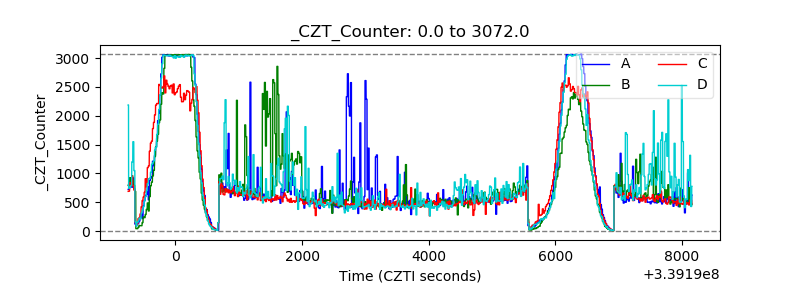 |
| +2.5 Volts monitor |  |
| +5 Volts monitor |  |
| _ROLL_ROT | 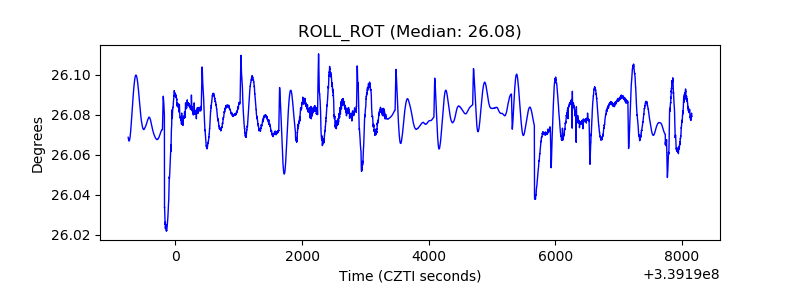 |
| _Roll_DEC | 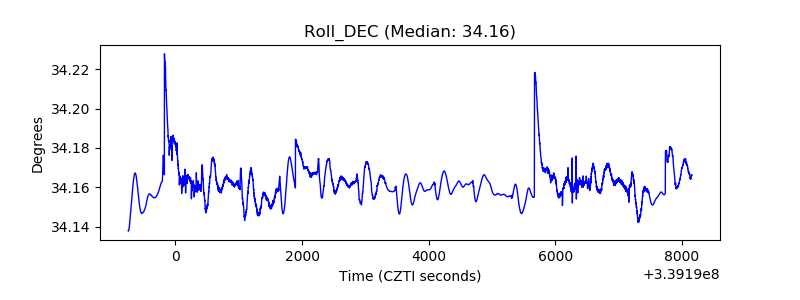 |
| _Roll_RA | 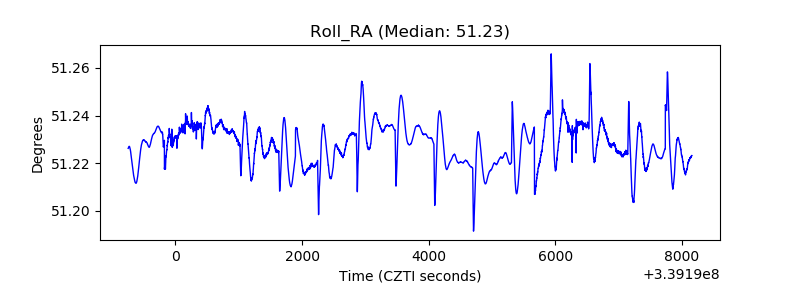 |
| Veto Counter | 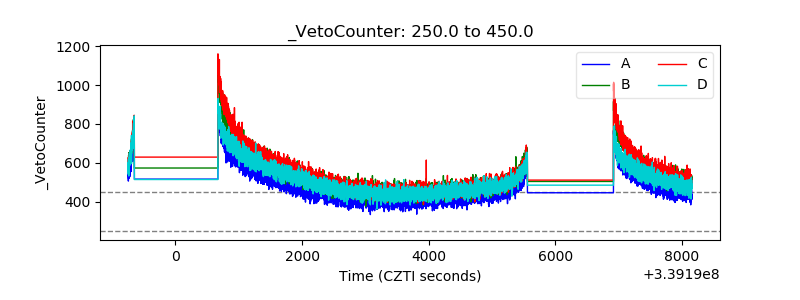 |