| Param | Original file | Final file |
|---|---|---|
| Filename | modeM0/AS1T03_236T01_9000003908_27084cztM0_level2.evt | modeM0/AS1T03_236T01_9000003908_27084cztM0_level2_quad_clean.evt |
| Size (bytes) | 515,301,120 | 104,192,640 |
| Size | 491.4 MB | 99.4 MB |
| Events in quadrant A | 3,503,420 | 670,791 |
| Events in quadrant B | 3,596,488 | 703,304 |
| Events in quadrant C | 3,313,679 | 691,460 |
| Events in quadrant D | 4,757,501 | 642,634 |
| Mode M0 | |||
|---|---|---|---|
| Quadrant | BADHDUFLAG | Total packets | Discarded packets |
| A | 0 | 14511 | 0 |
| B | 0 | 14678 | 0 |
| C | 0 | 13792 | 0 |
| D | 0 | 18515 | 0 |
| Mode M9 | |||
|---|---|---|---|
| Quadrant | BADHDUFLAG | Total packets | Discarded packets |
| A | 0 | 26 | 0 |
| B | 0 | 26 | 0 |
| C | 0 | 26 | 0 |
| D | 0 | 26 | 0 |
| Quadrant | Total seconds | Saturated seconds | Saturation percentage |
|---|---|---|---|
| A | 6419 | 56 | 0.872410% |
| B | 6420 | 101 | 1.573209% |
| C | 6420 | 106 | 1.651090% |
| D | 6419 | 309 | 4.813834% |
Noise dominated data is calculated using 1-second bins in cleaned event files. If a bin has >2000 counts, and if more than 50% of those come from <1% of pixels, then it is considered to be noise-dominated and hence unusable.
| Quadrant | # 1 sec bins | Bins with >0 counts | Bins with >2000 counts | High rate bins dominated by noise | Noise dominated (total time) | Noise dominated (detector-on time) | Marked lightcurve |
|---|---|---|---|---|---|---|---|
| A | 8949 | 6421 | 10 | 10 | 0.11% | 0.16% | 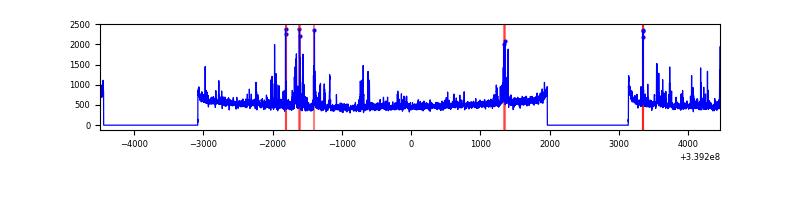 |
| B | 8950 | 6422 | 1 | 1 | 0.01% | 0.02% | 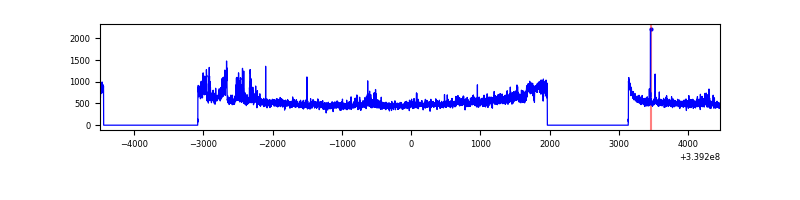 |
| C | 8950 | 6422 | 0 | 0 | 0.00% | 0.00% | 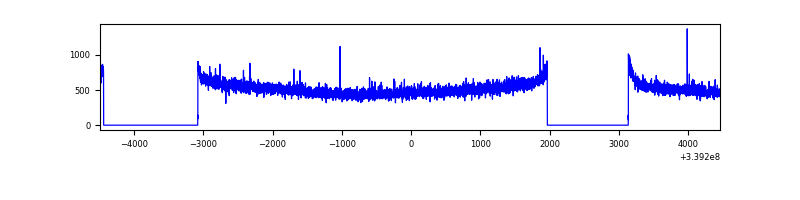 |
| D | 8949 | 6421 | 204 | 204 | 2.28% | 3.18% | 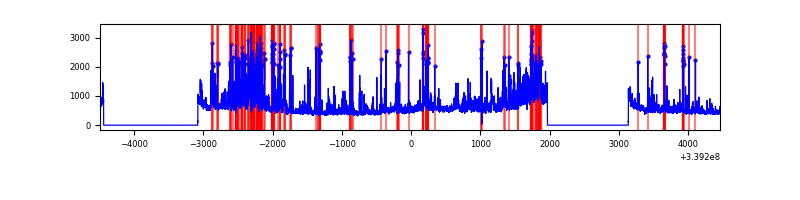 |
Top three noisy pixels from each quadrant. If the there are fewer than three noisy pixels in the level2.evt file, extra rows are filled as -1
| Pixel properties | Quadrant properties | ||||||
|---|---|---|---|---|---|---|---|
| Quadrant | DetID | PixID | Counts | Sigma | Mean | Median | Sigma |
| A | 14 | 235 | 301748 | 1850.52 | 818 | 802 | 162.6 |
| A | 12 | 189 | 26575 | 158.48 | 818 | 802 | 162.6 |
| A | 6 | 16 | 21123 | 124.95 | 818 | 802 | 162.6 |
| B | 0 | 189 | 231132 | 1478.67 | 829 | 809 | 155.8 |
| B | 3 | 112 | 93899 | 597.64 | 829 | 809 | 155.8 |
| B | 0 | 219 | 21461 | 132.59 | 829 | 809 | 155.8 |
| C | 14 | 238 | 129465 | 679.88 | 812 | 820 | 189.2 |
| C | 15 | 208 | 10012 | 48.58 | 812 | 820 | 189.2 |
| C | 13 | 61 | 5494 | 24.7 | 812 | 820 | 189.2 |
| D | 1 | 52 | 1496944 | 8012.72 | 791 | 773 | 186.7 |
| D | 2 | 250 | 213399 | 1138.72 | 791 | 773 | 186.7 |
| D | 12 | 227 | 38401 | 201.52 | 791 | 773 | 186.7 |
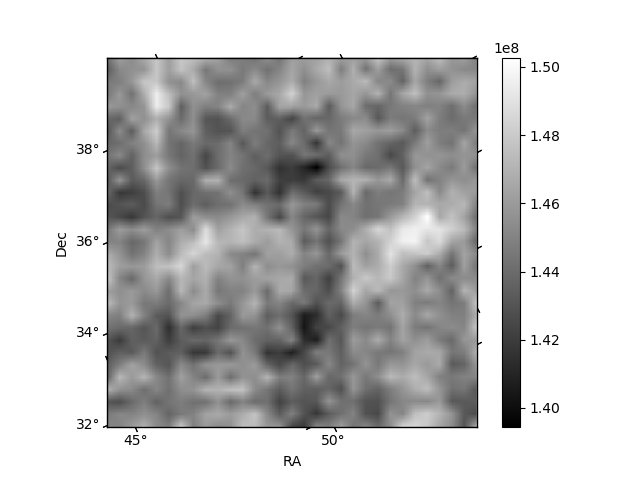
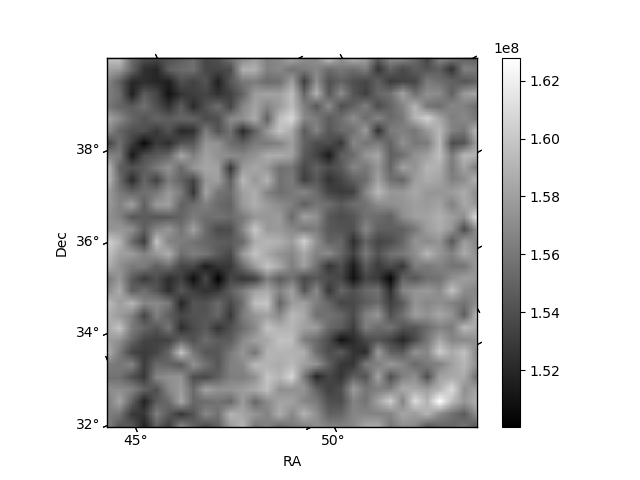
Histogram calculated using DETX and DETY for each event in the final _common_clean file
| Quadrant A | 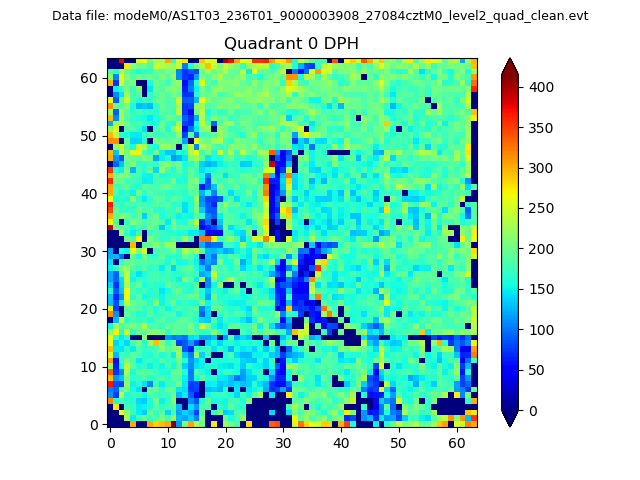 |
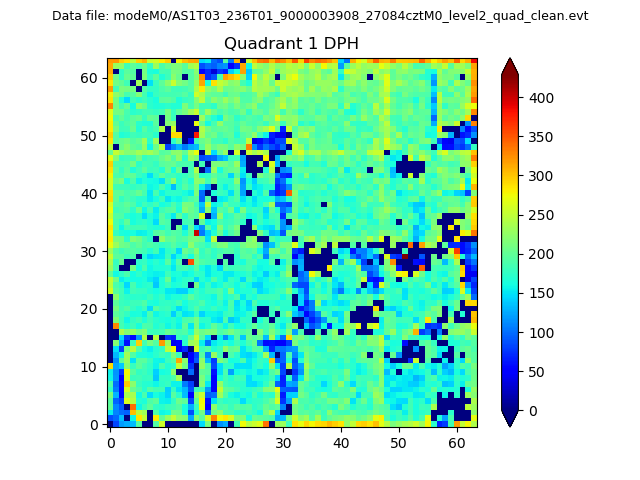 |
Quadrant B |
|---|---|---|---|
| Quadrant D | 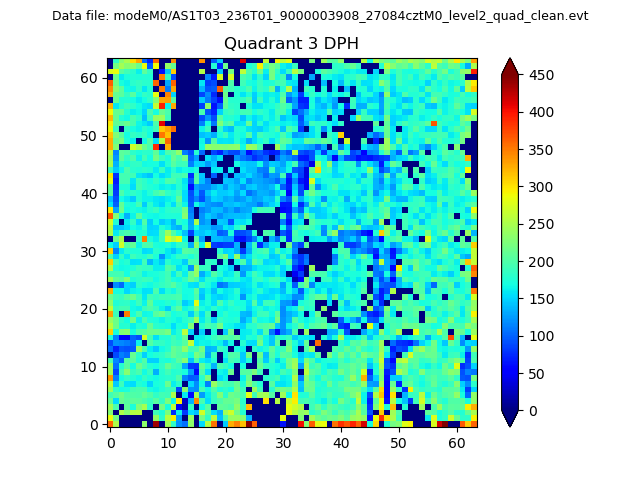 |
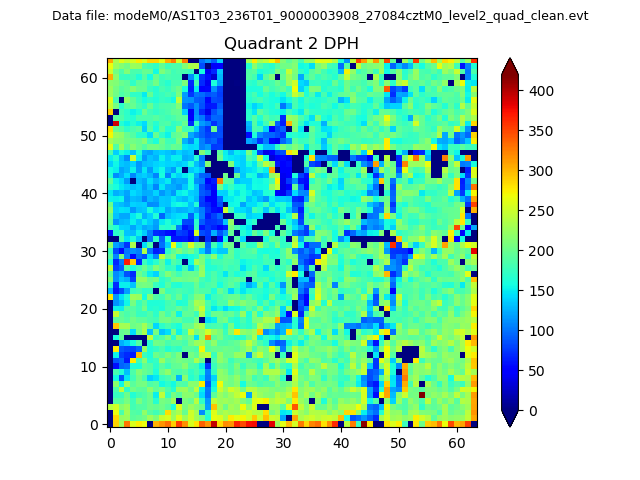 |
Quadrant C |
| Plot type | Count rate plots | Images |
|---|---|---|
| Comparison with Poisson distribution Blue bars denote a histogram of data divided into 1 sec bins. Red curve is a Poisson curve with rate = median count rate of data. |
 |
 |
| Quadrant-wise count rates Data is divided into 100 sec bins |
 |
|
| Module-wise count rates for Quadrant A Data is divided into 100 sec bins |
 |
 |
| Module-wise count rates for Quadrant B Data is divided into 100 sec bins |
 |
 |
| Module-wise count rates for Quadrant C Data is divided into 100 sec bins |
 |
 |
| Module-wise count rates for Quadrant D Data is divided into 100 sec bins |
 |
 |
| Parameter | Plot |
|---|---|
| CZT HV Monitor |  |
| D_VDD | 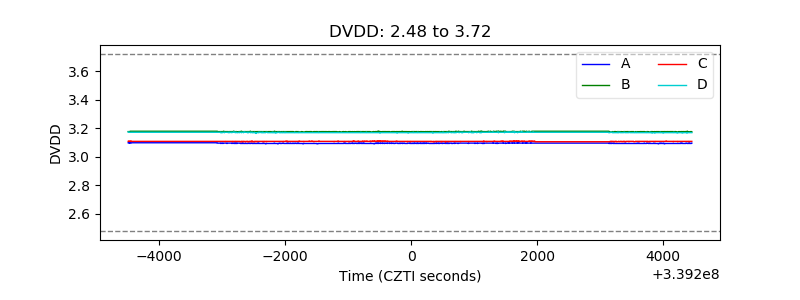 |
| Temperature 1 | 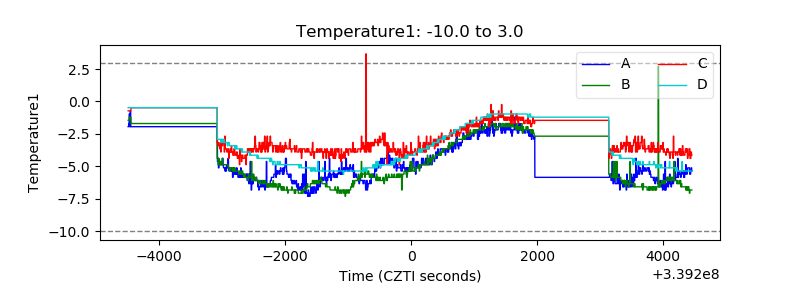 |
| Veto HV Monitor | 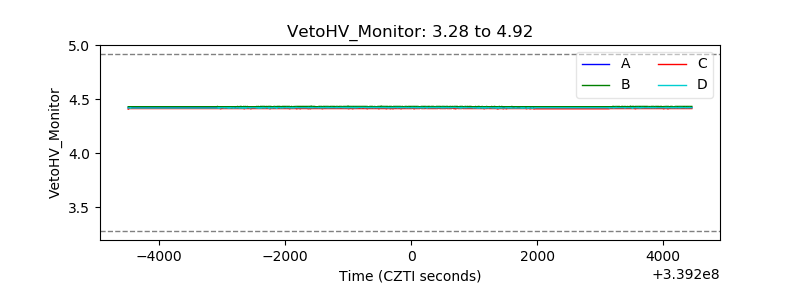 |
| Veto LLD | 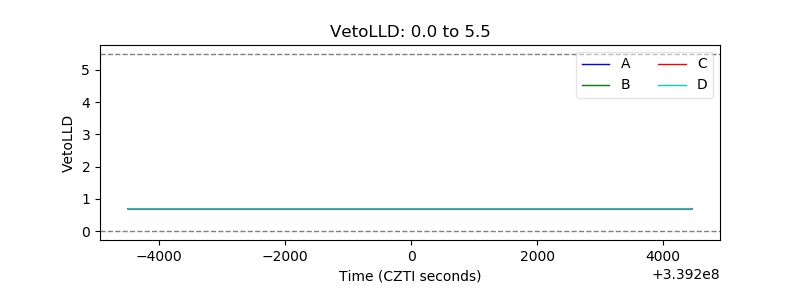 |
| Alpha Counter | 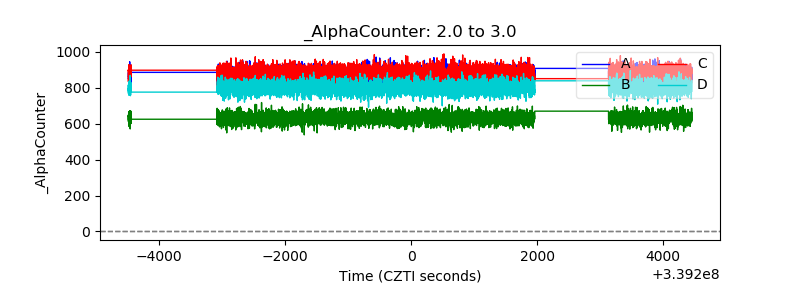 |
| _CPM_Rate | 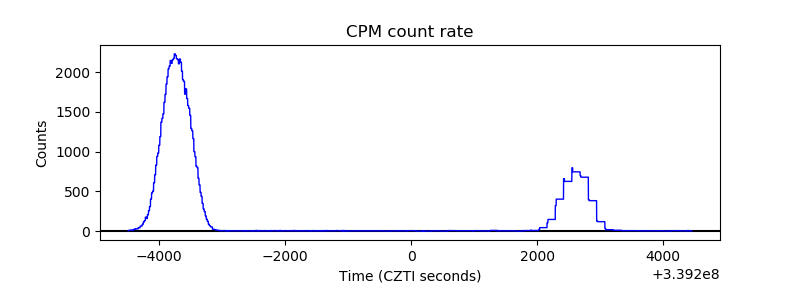 |
| CZT Counter | 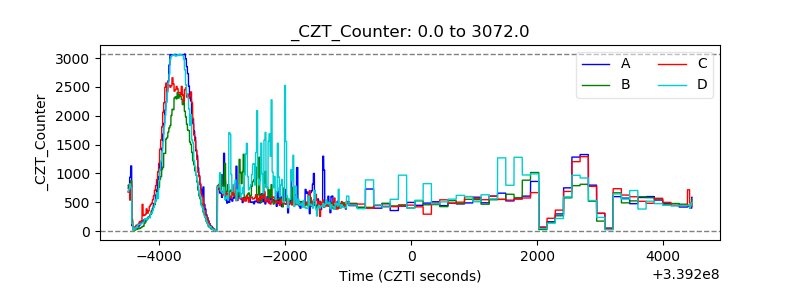 |
| +2.5 Volts monitor |  |
| +5 Volts monitor | 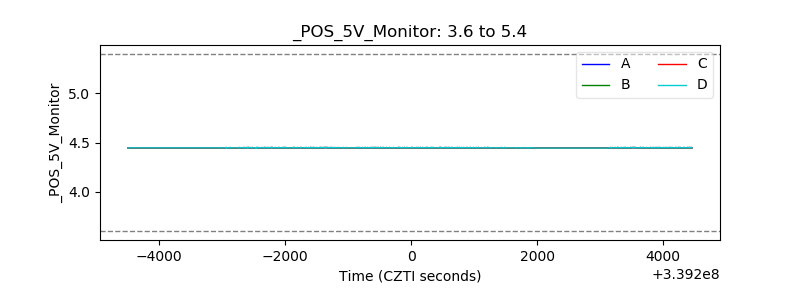 |
| _ROLL_ROT |  |
| _Roll_DEC | 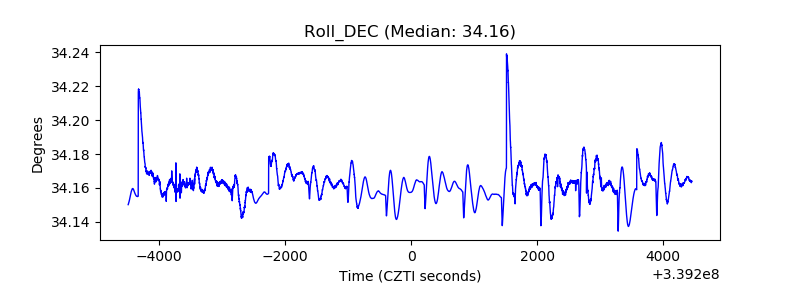 |
| _Roll_RA | 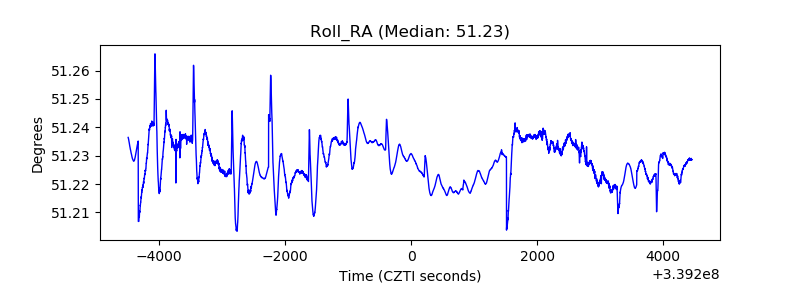 |
| Veto Counter |  |