| Param | Original file | Final file |
|---|---|---|
| Filename | modeM0/AS1T03_236T01_9000003908_27085cztM0_level2.evt | modeM0/AS1T03_236T01_9000003908_27085cztM0_level2_quad_clean.evt |
| Size (bytes) | 516,516,480 | 76,530,240 |
| Size | 492.6 MB | 73.0 MB |
| Events in quadrant A | 4,040,795 | 460,719 |
| Events in quadrant B | 3,421,151 | 493,572 |
| Events in quadrant C | 3,088,405 | 484,707 |
| Events in quadrant D | 4,683,348 | 456,989 |
| Mode M0 | |||
|---|---|---|---|
| Quadrant | BADHDUFLAG | Total packets | Discarded packets |
| A | 0 | 15834 | 0 |
| B | 0 | 14035 | 0 |
| C | 0 | 12970 | 0 |
| D | 0 | 18141 | 0 |
| Mode M9 | |||
|---|---|---|---|
| Quadrant | BADHDUFLAG | Total packets | Discarded packets |
| A | 0 | 20 | 0 |
| B | 0 | 20 | 0 |
| C | 0 | 20 | 0 |
| D | 0 | 20 | 0 |
| Quadrant | Total seconds | Saturated seconds | Saturation percentage |
|---|---|---|---|
| A | 6027 | 264 | 4.380289% |
| B | 6028 | 155 | 2.571334% |
| C | 6028 | 128 | 2.123424% |
| D | 6028 | 408 | 6.768414% |
Noise dominated data is calculated using 1-second bins in cleaned event files. If a bin has >2000 counts, and if more than 50% of those come from <1% of pixels, then it is considered to be noise-dominated and hence unusable.
| Quadrant | # 1 sec bins | Bins with >0 counts | Bins with >2000 counts | High rate bins dominated by noise | Noise dominated (total time) | Noise dominated (detector-on time) | Marked lightcurve |
|---|---|---|---|---|---|---|---|
| A | 8037 | 6029 | 179 | 179 | 2.23% | 2.97% | 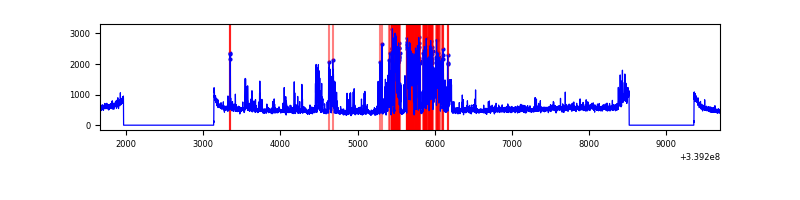 |
| B | 8038 | 6030 | 3 | 3 | 0.04% | 0.05% | 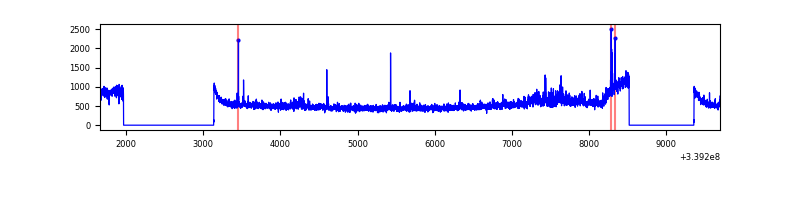 |
| C | 8038 | 6030 | 1 | 1 | 0.01% | 0.02% | 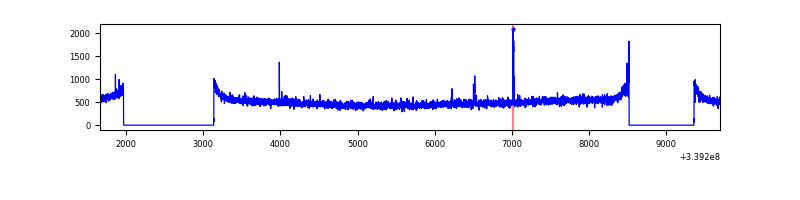 |
| D | 8038 | 6030 | 312 | 312 | 3.88% | 5.17% | 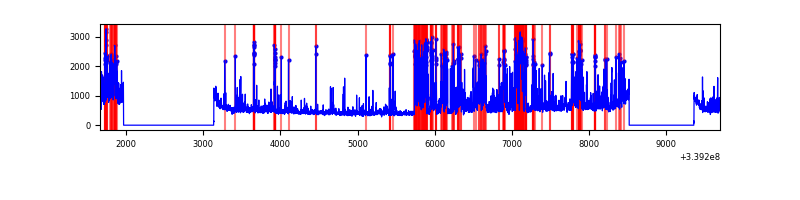 |
Top three noisy pixels from each quadrant. If the there are fewer than three noisy pixels in the level2.evt file, extra rows are filled as -1
| Pixel properties | Quadrant properties | ||||||
|---|---|---|---|---|---|---|---|
| Quadrant | DetID | PixID | Counts | Sigma | Mean | Median | Sigma |
| A | 14 | 235 | 1041376 | 6787.5 | 763 | 746 | 153.3 |
| A | 12 | 189 | 51316 | 329.84 | 763 | 746 | 153.3 |
| A | 13 | 254 | 9887 | 59.62 | 763 | 746 | 153.3 |
| B | 0 | 189 | 239638 | 1615.77 | 771 | 752 | 147.8 |
| B | 3 | 112 | 104120 | 699.16 | 771 | 752 | 147.8 |
| B | 7 | 205 | 25850 | 169.76 | 771 | 752 | 147.8 |
| C | 14 | 238 | 119453 | 669.37 | 751 | 757 | 177.3 |
| C | 15 | 208 | 28212 | 154.83 | 751 | 757 | 177.3 |
| C | 2 | 16 | 5943 | 29.25 | 751 | 757 | 177.3 |
| D | 1 | 52 | 1739009 | 9875.86 | 735 | 715 | 176.0 |
| D | 2 | 250 | 139292 | 787.3 | 735 | 715 | 176.0 |
| D | 2 | 234 | 23731 | 130.76 | 735 | 715 | 176.0 |
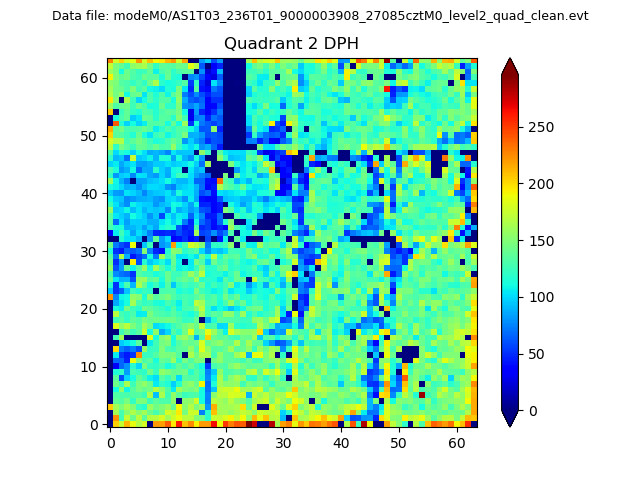
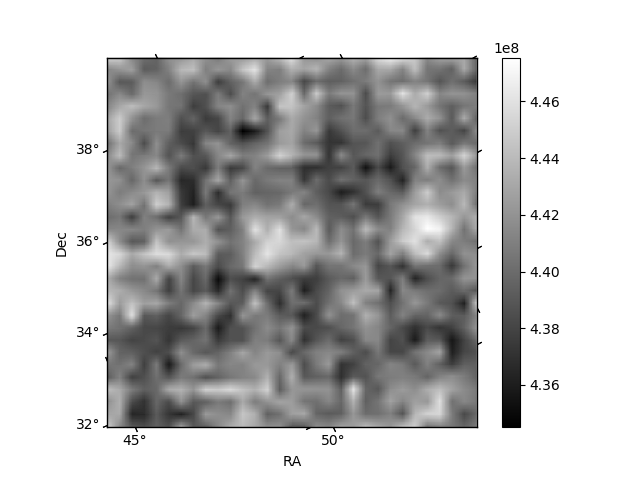
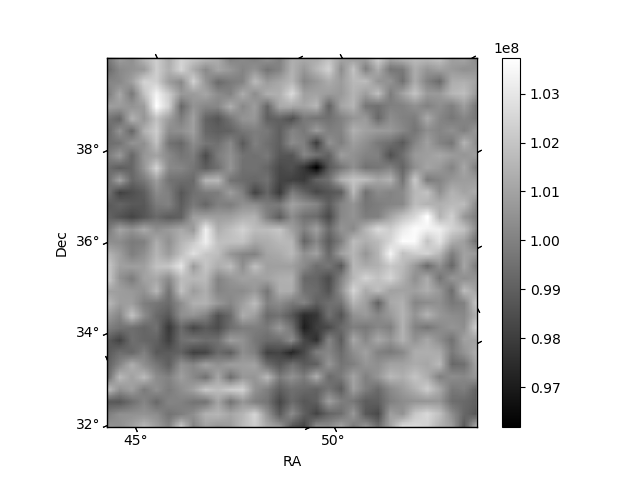
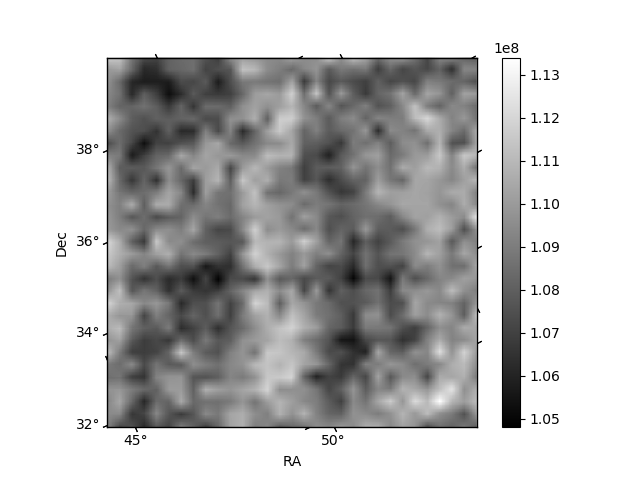
Histogram calculated using DETX and DETY for each event in the final _common_clean file
| Quadrant A | 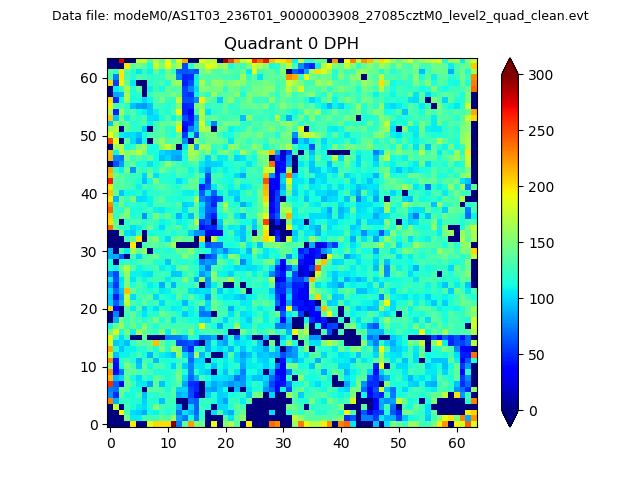 |
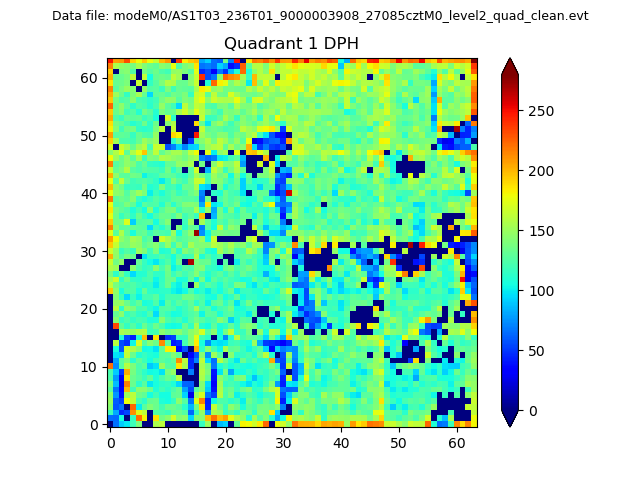 |
Quadrant B |
|---|---|---|---|
| Quadrant D | 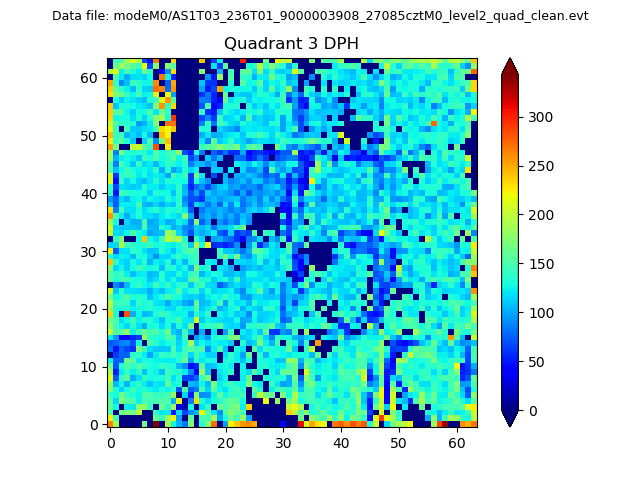 |
 |
Quadrant C |
| Plot type | Count rate plots | Images |
|---|---|---|
| Comparison with Poisson distribution Blue bars denote a histogram of data divided into 1 sec bins. Red curve is a Poisson curve with rate = median count rate of data. |
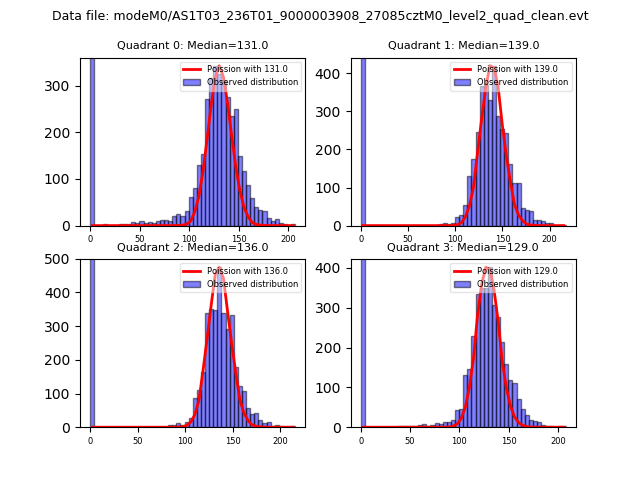 |
 |
| Quadrant-wise count rates Data is divided into 100 sec bins |
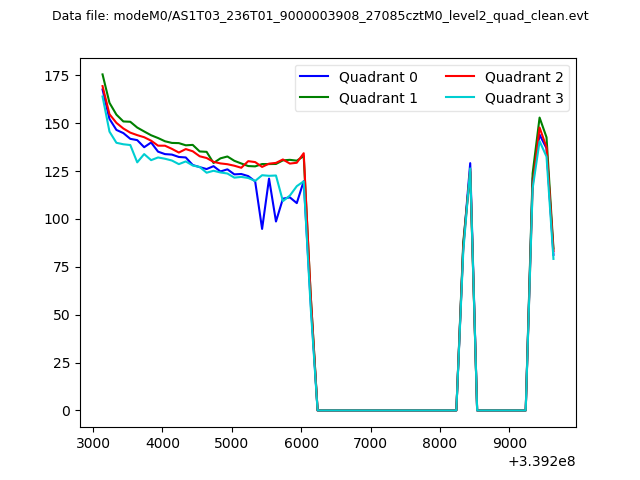 |
|
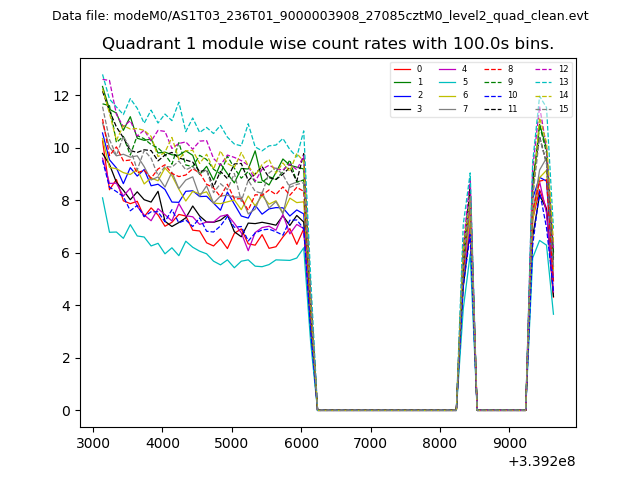
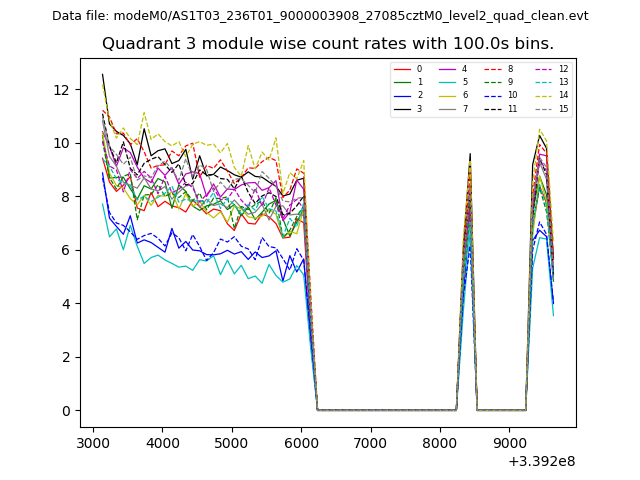
| Module-wise count rates for Quadrant A Data is divided into 100 sec bins |
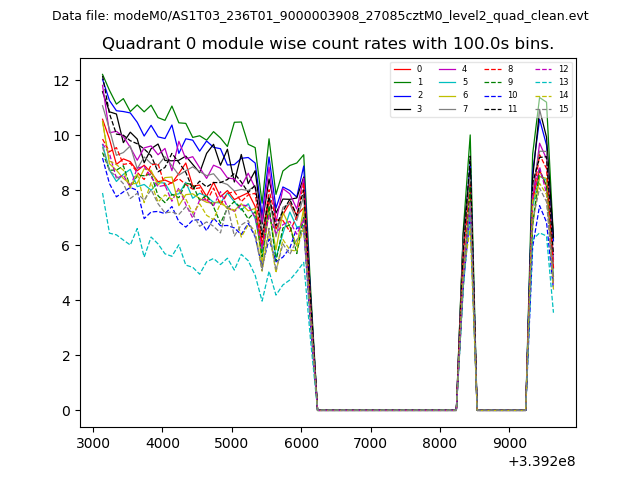 |
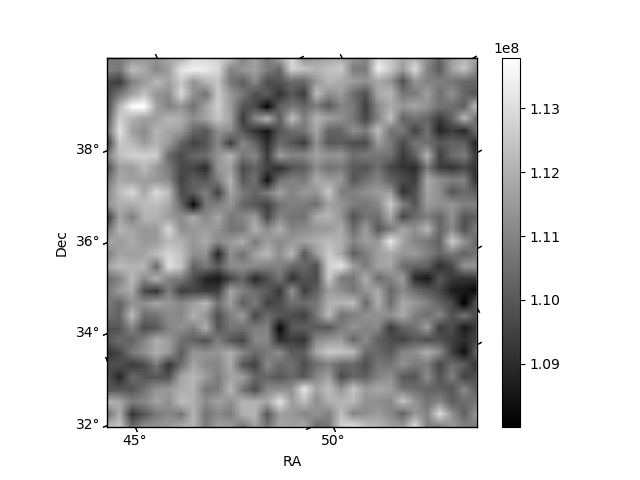 |
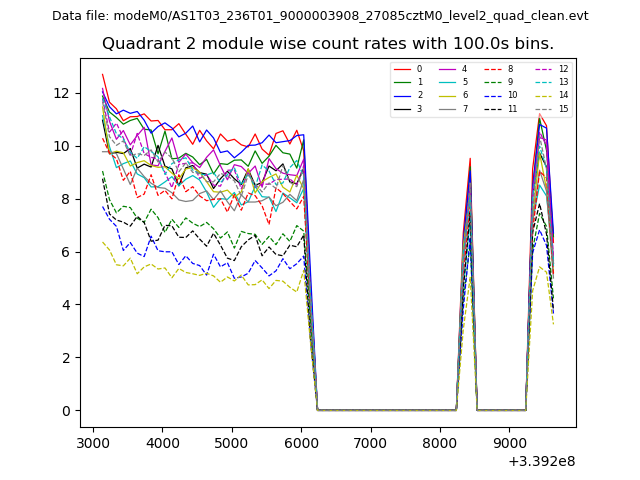
| Module-wise count rates for Quadrant B Data is divided into 100 sec bins |
 |
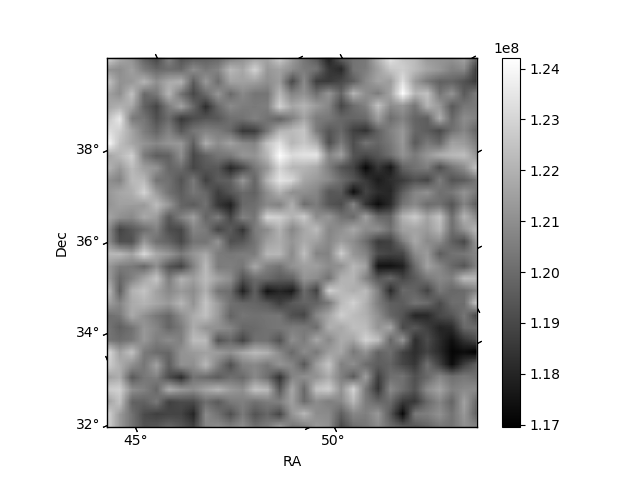 |
| Module-wise count rates for Quadrant C Data is divided into 100 sec bins |
 |
 |
| Module-wise count rates for Quadrant D Data is divided into 100 sec bins |
 |
 |
| Parameter | Plot |
|---|---|
| CZT HV Monitor | 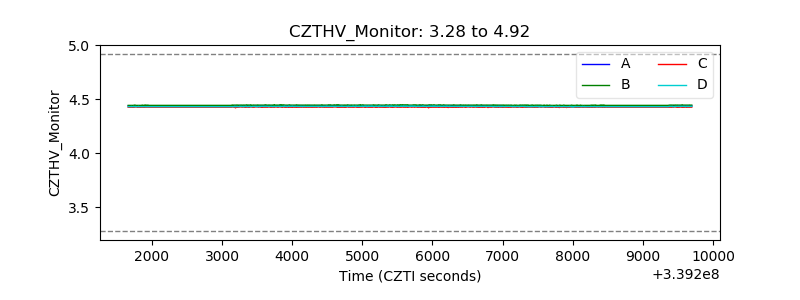 |
| D_VDD | 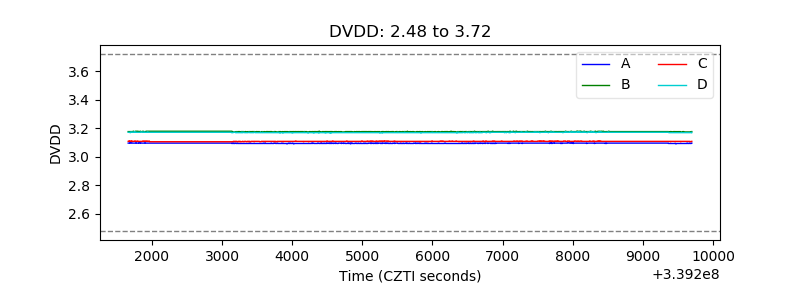 |
| Temperature 1 |  |
| Veto HV Monitor | 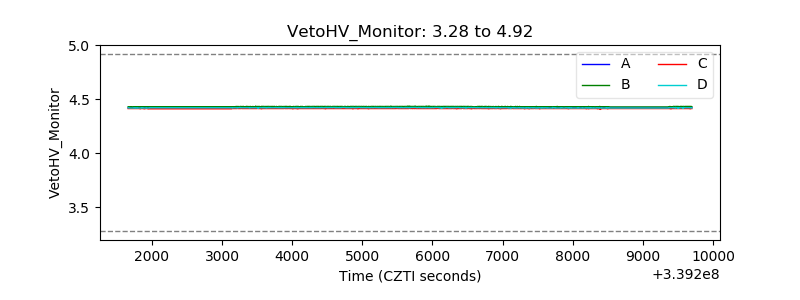 |
| Veto LLD |  |
| Alpha Counter |  |
| _CPM_Rate | 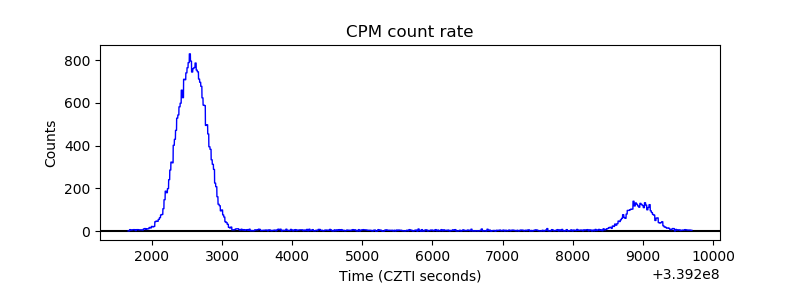 |
| CZT Counter | 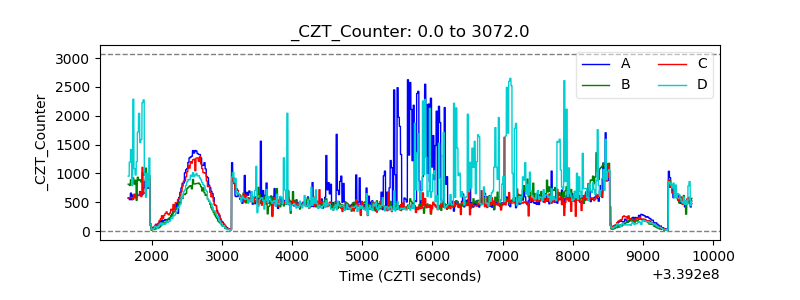 |
| +2.5 Volts monitor |  |
| +5 Volts monitor |  |
| _ROLL_ROT | 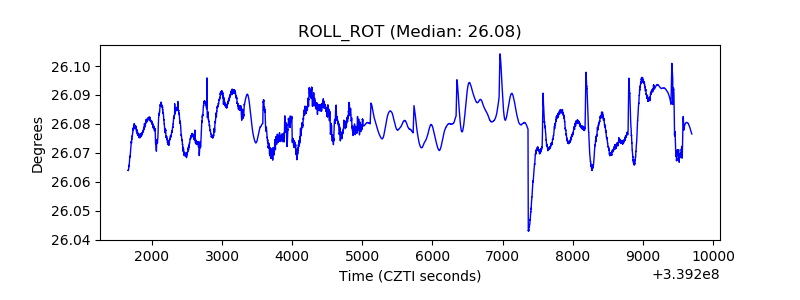 |
| _Roll_DEC | 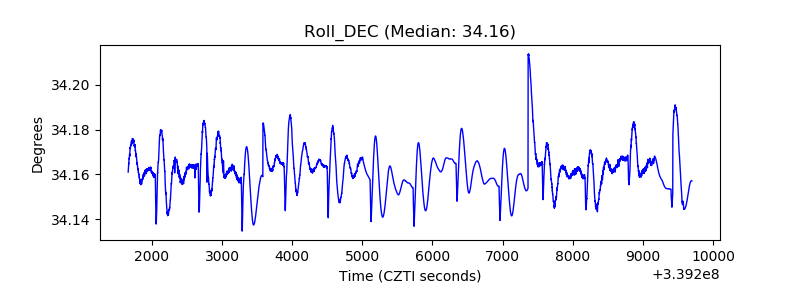 |
| _Roll_RA | 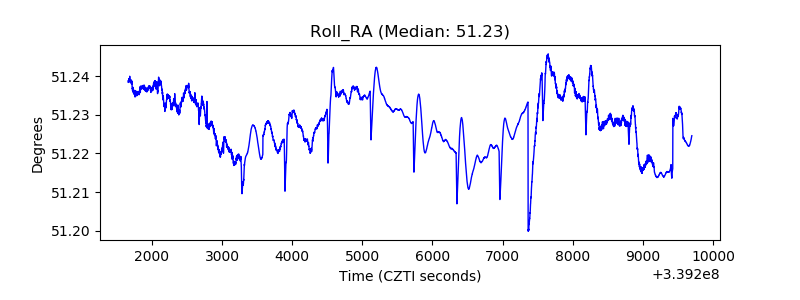 |
| Veto Counter | 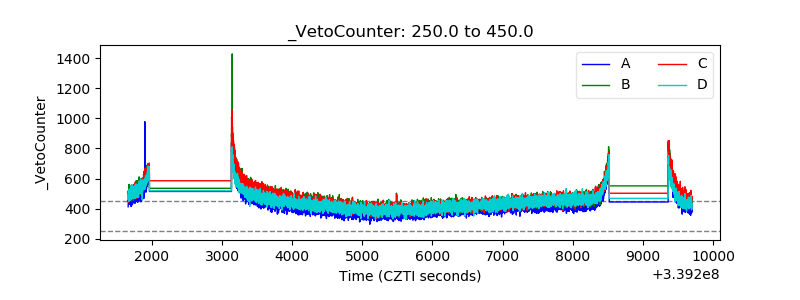 |