| Param | Original file | Final file |
|---|---|---|
| Filename | modeM0/AS1T03_236T01_9000003908_27086cztM0_level2.evt | modeM0/AS1T03_236T01_9000003908_27086cztM0_level2_quad_clean.evt |
| Size (bytes) | 28,238,400 | 7,496,640 |
| Size | 26.9 MB | 7.1 MB |
| Events in quadrant A | 199,173 | 48,256 |
| Events in quadrant B | 207,326 | 50,434 |
| Events in quadrant C | 200,045 | 48,660 |
| Events in quadrant D | 221,678 | 47,042 |
| Mode M0 | |||
|---|---|---|---|
| Quadrant | BADHDUFLAG | Total packets | Discarded packets |
| A | 0 | 805 | 0 |
| B | 0 | 824 | 0 |
| C | 0 | 803 | 0 |
| D | 0 | 875 | 0 |
| Mode M9 | |||
|---|---|---|---|
| Quadrant | BADHDUFLAG | Total packets | Discarded packets |
| A | 0 | 3 | 0 |
| B | 0 | 4 | 0 |
| C | 0 | 4 | 0 |
| D | 0 | 4 | 0 |
| Quadrant | Total seconds | Saturated seconds | Saturation percentage |
|---|---|---|---|
| A | 338 | 12 | 3.550296% |
| B | 338 | 17 | 5.029586% |
| C | 338 | 19 | 5.621302% |
| D | 338 | 1 | 0.295858% |
Noise dominated data is calculated using 1-second bins in cleaned event files. If a bin has >2000 counts, and if more than 50% of those come from <1% of pixels, then it is considered to be noise-dominated and hence unusable.
| Quadrant | # 1 sec bins | Bins with >0 counts | Bins with >2000 counts | High rate bins dominated by noise | Noise dominated (total time) | Noise dominated (detector-on time) | Marked lightcurve |
|---|---|---|---|---|---|---|---|
| A | 338 | 338 | 0 | 0 | 0.00% | 0.00% | 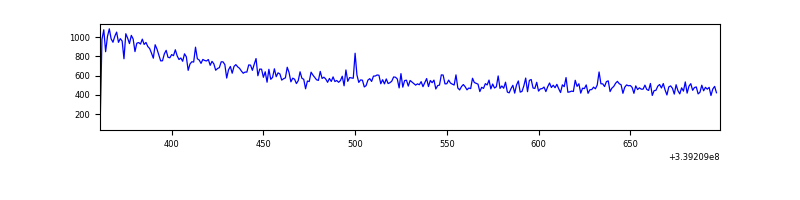 |
| B | 338 | 338 | 0 | 0 | 0.00% | 0.00% | 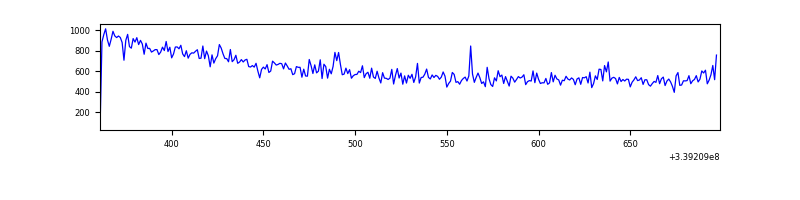 |
| C | 338 | 338 | 0 | 0 | 0.00% | 0.00% | 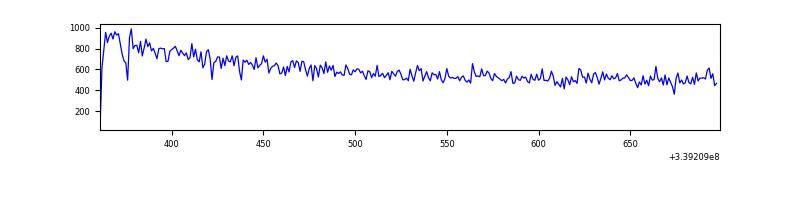 |
| D | 338 | 338 | 0 | 0 | 0.00% | 0.00% | 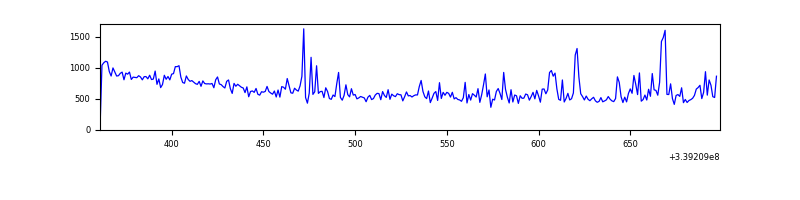 |
Top three noisy pixels from each quadrant. If the there are fewer than three noisy pixels in the level2.evt file, extra rows are filled as -1
| Pixel properties | Quadrant properties | ||||||
|---|---|---|---|---|---|---|---|
| Quadrant | DetID | PixID | Counts | Sigma | Mean | Median | Sigma |
| A | 8 | 192 | 3450 | 272.12 | 49 | 48 | 12.5 |
| A | 14 | 235 | 1196 | 91.83 | 49 | 48 | 12.5 |
| A | 12 | 189 | 1157 | 88.71 | 49 | 48 | 12.5 |
| B | 3 | 112 | 4025 | 321.65 | 50 | 49 | 12.4 |
| B | 15 | 33 | 1325 | 103.23 | 50 | 49 | 12.4 |
| B | 0 | 219 | 1313 | 102.25 | 50 | 49 | 12.4 |
| C | 14 | 238 | 7770 | 571.8 | 49 | 49 | 13.5 |
| C | 13 | 61 | 344 | 21.85 | 49 | 49 | 13.5 |
| C | 15 | 208 | 183 | 9.92 | 49 | 49 | 13.5 |
| D | 1 | 52 | 34844 | 2520.83 | 48 | 47 | 13.8 |
| D | 3 | 238 | 1482 | 103.96 | 48 | 47 | 13.8 |
| D | 3 | 254 | 1006 | 69.47 | 48 | 47 | 13.8 |
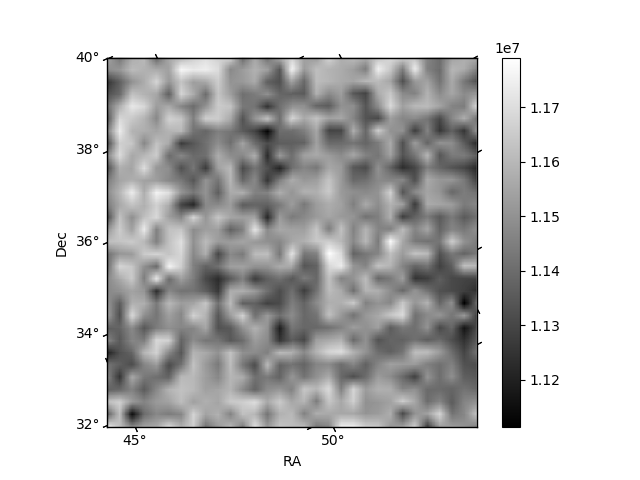
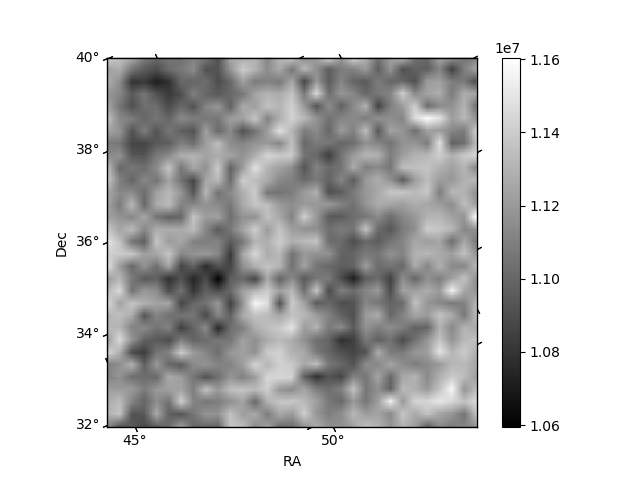
Histogram calculated using DETX and DETY for each event in the final _common_clean file
| Quadrant A |  |
 |
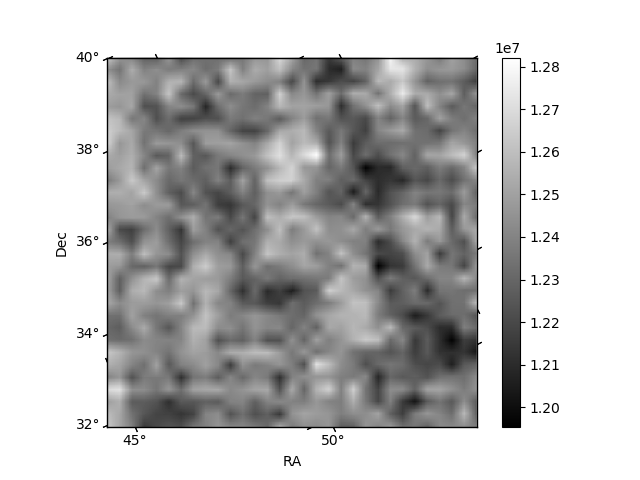
Quadrant B |
|---|---|---|---|
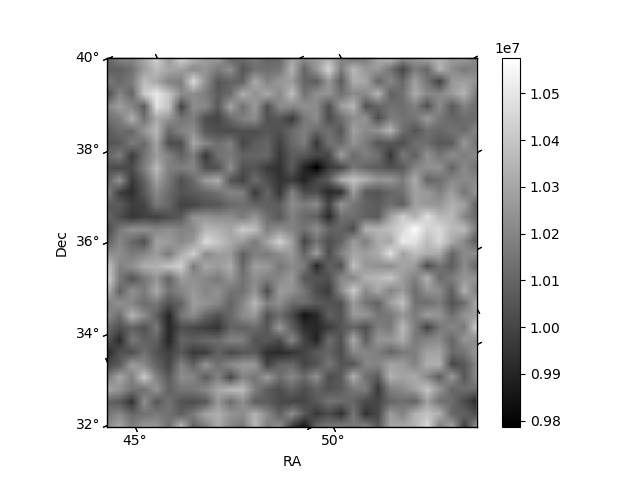
| Quadrant D |  |
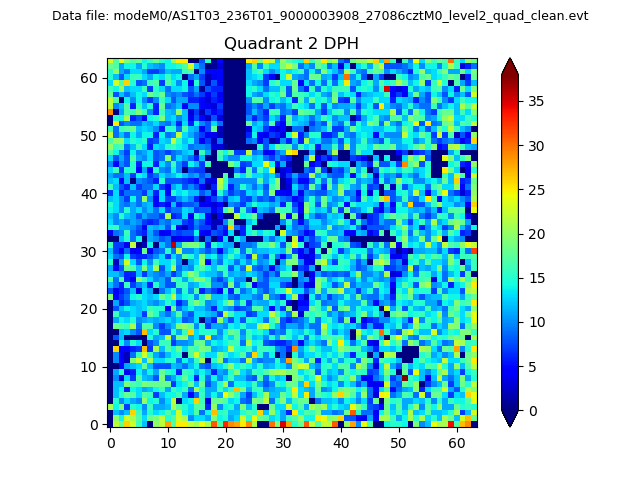 |
Quadrant C |
| Plot type | Count rate plots | Images |
|---|---|---|
| Comparison with Poisson distribution Blue bars denote a histogram of data divided into 1 sec bins. Red curve is a Poisson curve with rate = median count rate of data. |
 |
 |
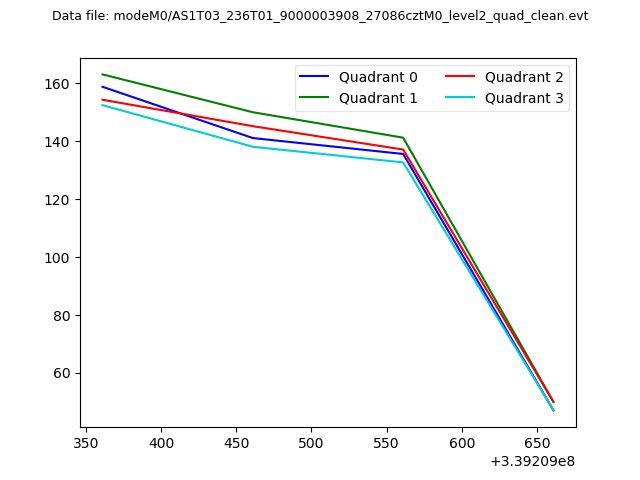
| Quadrant-wise count rates Data is divided into 100 sec bins |
 |
|
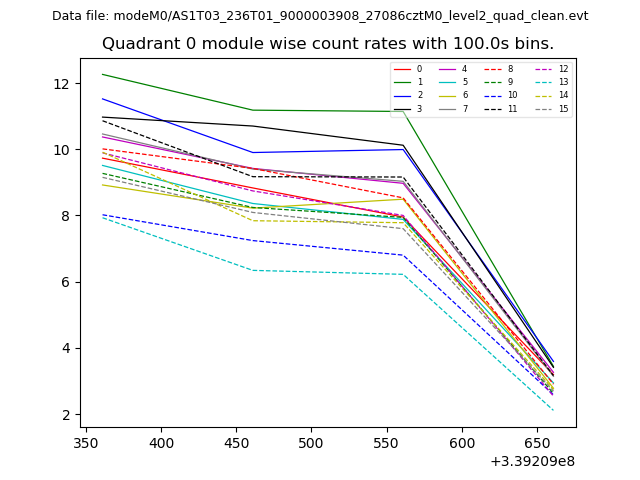
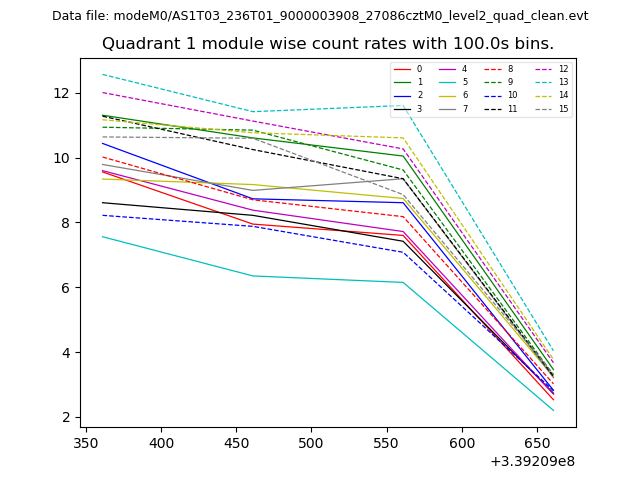
| Module-wise count rates for Quadrant A Data is divided into 100 sec bins |
 |
 |
| Module-wise count rates for Quadrant B Data is divided into 100 sec bins |
 |
 |
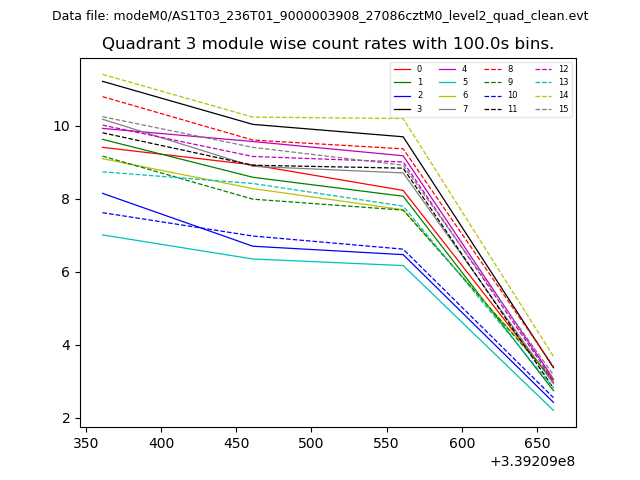
| Module-wise count rates for Quadrant C Data is divided into 100 sec bins |
 |
 |
| Module-wise count rates for Quadrant D Data is divided into 100 sec bins |
 |
 |
| Parameter | Plot |
|---|---|
| CZT HV Monitor | 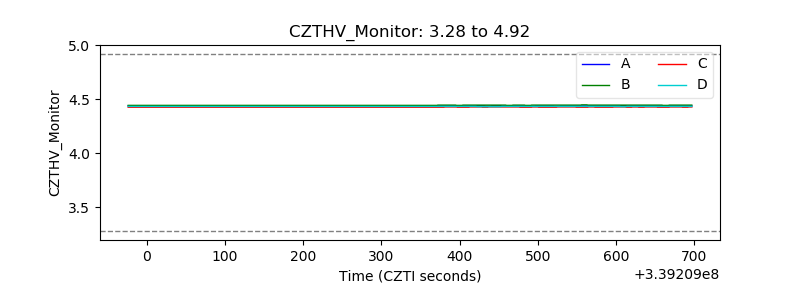 |
| D_VDD | 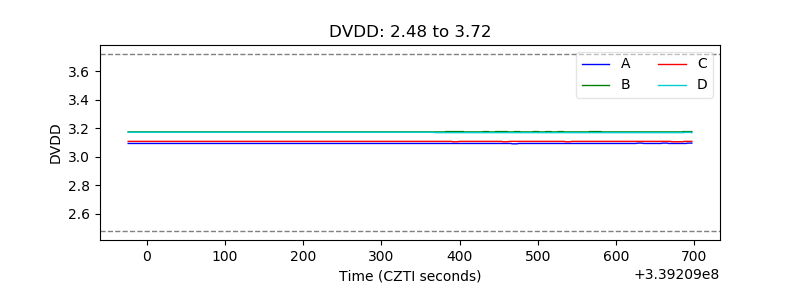 |
| Temperature 1 | 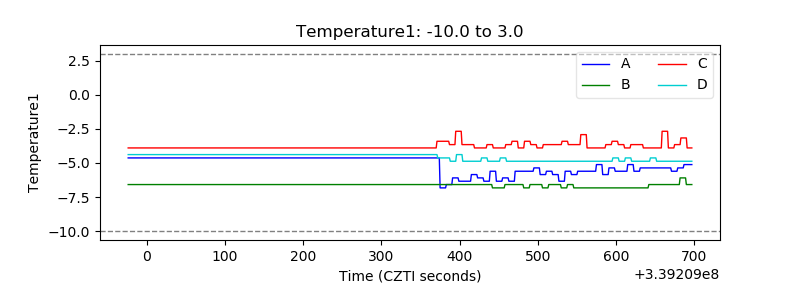 |
| Veto HV Monitor | 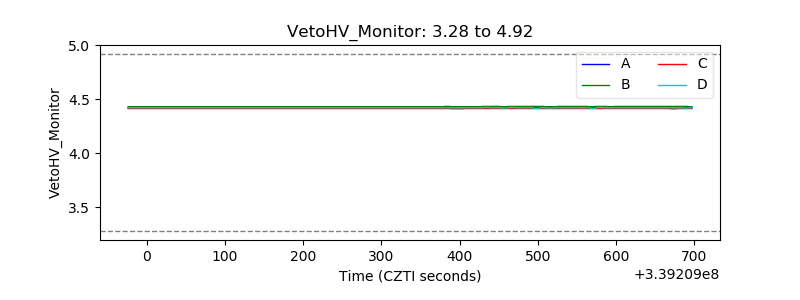 |
| Veto LLD | 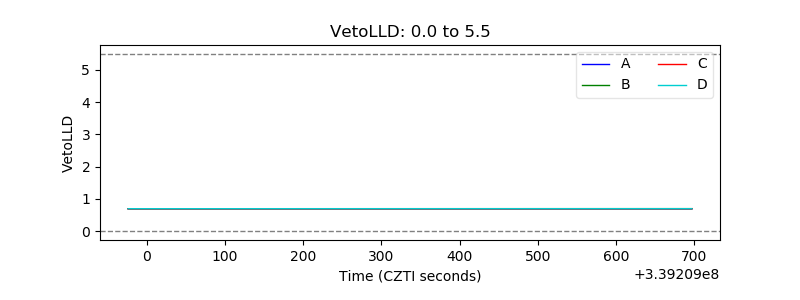 |
| Alpha Counter |  |
| _CPM_Rate | 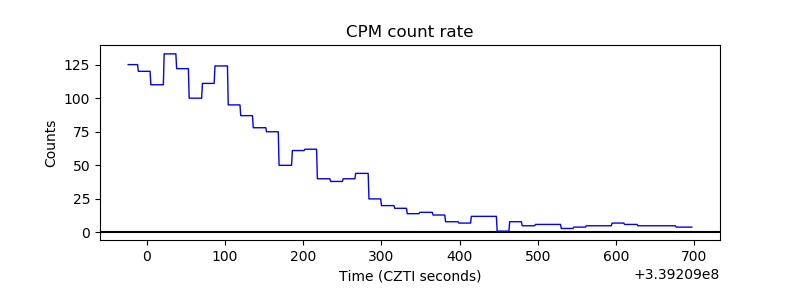 |
| CZT Counter | 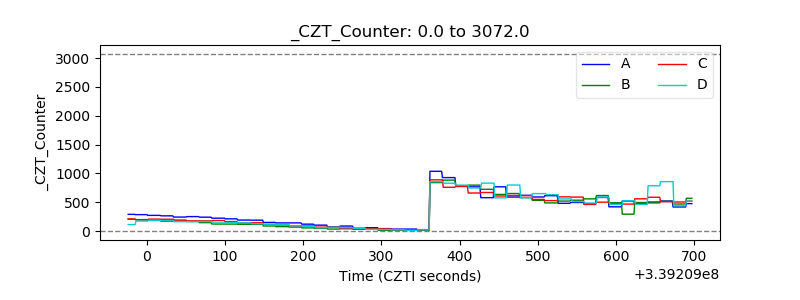 |
| +2.5 Volts monitor |  |
| +5 Volts monitor |  |
| _ROLL_ROT | 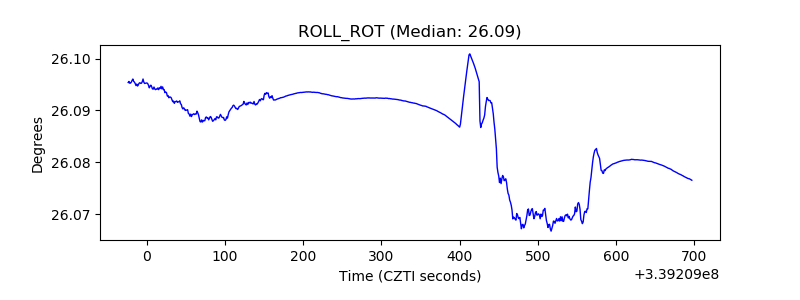 |
| _Roll_DEC | 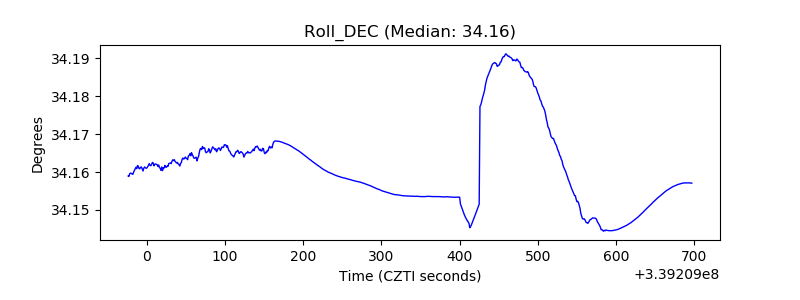 |
| _Roll_RA | 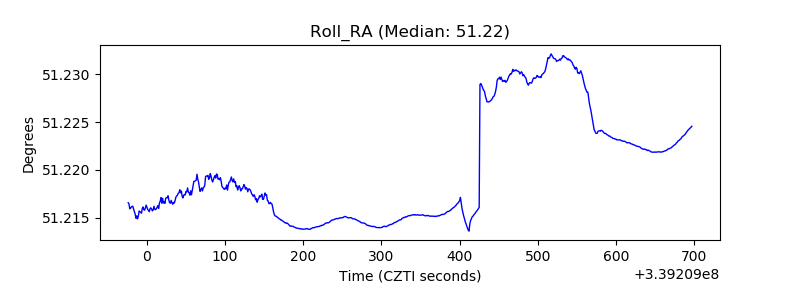 |
| Veto Counter | 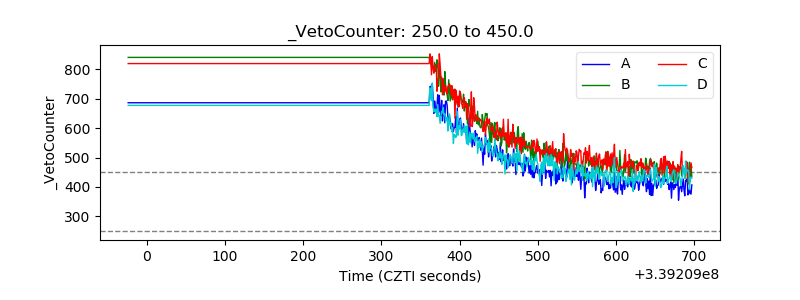 |