| Param | Original file | Final file |
|---|---|---|
| Filename | modeM0/AS1T03_231T01_9000003910cztM0_level2.fits | modeM0/AS1T03_231T01_9000003910cztM0_level2_quad_clean.evt |
| Size (bytes) | 1,111,772,160 | 952,476,480 |
| Size | 1.0 GB | 908.4 MB |
| Events in quadrant A | 6,849,630 | 5,551,748 |
| Events in quadrant B | 6,550,548 | 5,521,430 |
| Events in quadrant C | 6,723,098 | 5,351,015 |
| Events in quadrant D | 5,729,426 | 4,606,969 |
| Mode SS | |||
|---|---|---|---|
| Quadrant | BADHDUFLAG | Total packets | Discarded packets |
| A | 0 | 2324 | 0 |
| B | 0 | 2324 | 0 |
| C | 0 | 2324 | 0 |
| D | 0 | 2324 | 0 |
| Mode M0 | |||
|---|---|---|---|
| Quadrant | BADHDUFLAG | Total packets | Discarded packets |
| A | 0 | 268068 | 0 |
| B | 0 | 279962 | 0 |
| C | 0 | 237367 | 0 |
| D | 0 | 339895 | 0 |
| Mode M9 | |||
|---|---|---|---|
| Quadrant | BADHDUFLAG | Total packets | Discarded packets |
| A | 0 | 160 | 0 |
| B | 0 | 160 | 0 |
| C | 0 | 160 | 0 |
| D | 0 | 160 | 0 |
| Quadrant | Total seconds | Saturated seconds | Saturation percentage |
|---|---|---|---|
| A | 114011 | 3483 | 3.054968% |
| B | 114011 | 3207 | 2.812886% |
| C | 114011 | 1935 | 1.697205% |
| D | 114011 | 7561 | 6.631816% |
Noise dominated data is calculated using 1-second bins in cleaned event files. If a bin has >2000 counts, and if more than 50% of those come from <1% of pixels, then it is considered to be noise-dominated and hence unusable.
| Quadrant | # 1 sec bins | Bins with >0 counts | Bins with >2000 counts | High rate bins dominated by noise | Noise dominated (total time) | Noise dominated (detector-on time) | Marked lightcurve |
|---|---|---|---|---|---|---|---|
| A | 129181 | 114011 | 0 | 0 | 0.00% | 0.00% |  |
| B | 129181 | 113989 | 0 | 0 | 0.00% | 0.00% |  |
| C | 129181 | 114009 | 0 | 0 | 0.00% | 0.00% |  |
| D | 129181 | 113972 | 0 | 0 | 0.00% | 0.00% |  |
Top three noisy pixels from each quadrant. If the there are fewer than three noisy pixels in the level2.evt file, extra rows are filled as -1
| Pixel properties | Quadrant properties | ||||||
|---|---|---|---|---|---|---|---|
| Quadrant | DetID | PixID | Counts | Sigma | Mean | Median | Sigma |
| A | 0 | 29 | 6655 | 11.52 | 1782 | 1671 | 432.5 |
| A | 7 | 110 | 5633 | 9.16 | 1782 | 1671 | 432.5 |
| A | 0 | 30 | 5251 | 8.28 | 1782 | 1671 | 432.5 |
| B | 2 | 9 | 5296 | 10.84 | 1732 | 1648 | 336.6 |
| B | 2 | 8 | 4465 | 8.37 | 1732 | 1648 | 336.6 |
| B | 5 | 225 | 4404 | 8.19 | 1732 | 1648 | 336.6 |
| C | 12 | 241 | 4725 | 6.89 | 1775 | 1658 | 444.9 |
| C | 3 | 126 | 4588 | 6.59 | 1775 | 1658 | 444.9 |
| C | 9 | 233 | 4512 | 6.42 | 1775 | 1658 | 444.9 |
| D | 3 | 14 | 4162 | 6.17 | 1636 | 1489 | 433.1 |
| D | 10 | 189 | 4037 | 5.88 | 1636 | 1489 | 433.1 |
| D | 6 | 231 | 3998 | 5.79 | 1636 | 1489 | 433.1 |
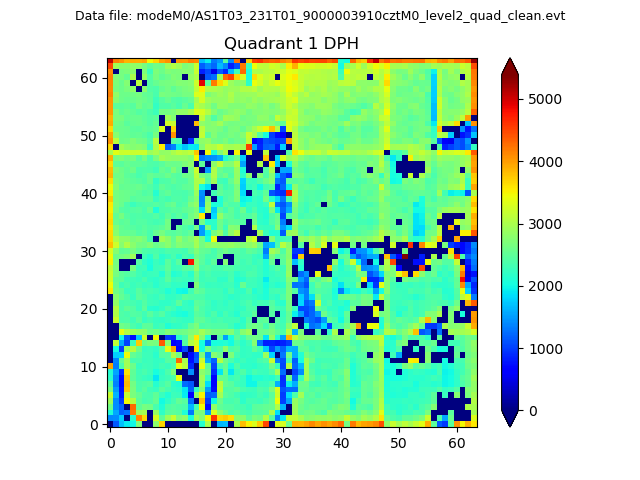
Histogram calculated using DETX and DETY for each event in the final _common_clean file
| Quadrant A |  |
 |
Quadrant B |
|---|---|---|---|
| Quadrant D | 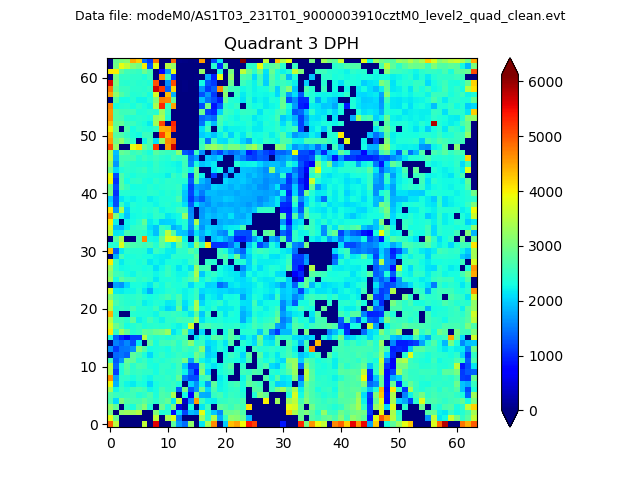 |
 |
Quadrant C |
| Plot type | Count rate plots | Images |
|---|---|---|
| Comparison with Poisson distribution Blue bars denote a histogram of data divided into 1 sec bins. Red curve is a Poisson curve with rate = median count rate of data. |
 |
 |
| Quadrant-wise count rates Data is divided into 100 sec bins |
 |
|
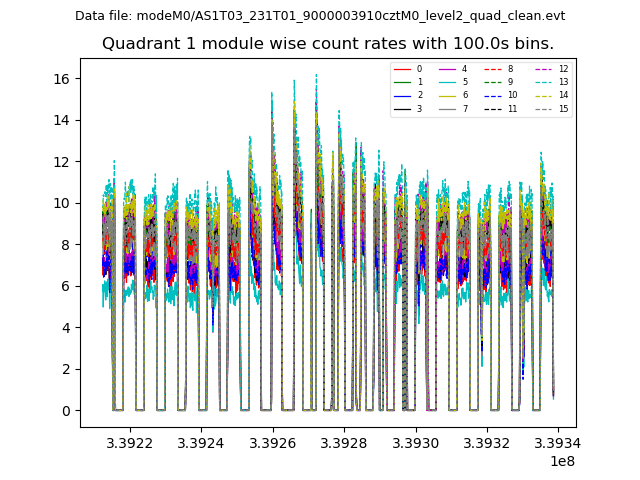
| Module-wise count rates for Quadrant A Data is divided into 100 sec bins |
 |
 |
| Module-wise count rates for Quadrant B Data is divided into 100 sec bins |
 |
 |
| Module-wise count rates for Quadrant C Data is divided into 100 sec bins |
 |
 |
| Module-wise count rates for Quadrant D Data is divided into 100 sec bins |
 |
 |
| Parameter | Plot |
|---|---|
| CZT HV Monitor |  |
| D_VDD | 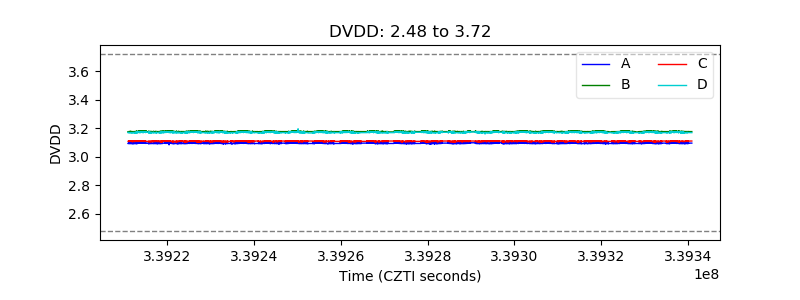 |
| Temperature 1 |  |
| Veto HV Monitor |  |
| Veto LLD |  |
| Alpha Counter |  |
| _CPM_Rate |  |
| CZT Counter |  |
| +2.5 Volts monitor |  |
| +5 Volts monitor |  |
| _ROLL_ROT |  |
| _Roll_DEC |  |
| _Roll_RA |  |
| Veto Counter |  |