| Param | Original file | Final file |
|---|---|---|
| Filename | modeM0/AS1T03_231T01_9000003910_27086cztM0_level2.evt | modeM0/AS1T03_231T01_9000003910_27086cztM0_level2_quad_clean.evt |
| Size (bytes) | 479,917,440 | 68,575,680 |
| Size | 457.7 MB | 65.4 MB |
| Events in quadrant A | 3,680,895 | 423,477 |
| Events in quadrant B | 3,917,210 | 423,747 |
| Events in quadrant C | 2,906,484 | 419,590 |
| Events in quadrant D | 3,631,715 | 399,410 |
| Mode M0 | |||
|---|---|---|---|
| Quadrant | BADHDUFLAG | Total packets | Discarded packets |
| A | 0 | 14599 | 0 |
| B | 0 | 15565 | 0 |
| C | 0 | 12214 | 0 |
| D | 0 | 14824 | 0 |
| Mode M9 | |||
|---|---|---|---|
| Quadrant | BADHDUFLAG | Total packets | Discarded packets |
| A | 0 | 4 | 0 |
| B | 0 | 4 | 0 |
| C | 0 | 4 | 0 |
| D | 0 | 4 | 0 |
| Quadrant | Total seconds | Saturated seconds | Saturation percentage |
|---|---|---|---|
| A | 5864 | 187 | 3.188950% |
| B | 5864 | 246 | 4.195089% |
| C | 5863 | 114 | 1.944397% |
| D | 5863 | 152 | 2.592529% |
Noise dominated data is calculated using 1-second bins in cleaned event files. If a bin has >2000 counts, and if more than 50% of those come from <1% of pixels, then it is considered to be noise-dominated and hence unusable.
| Quadrant | # 1 sec bins | Bins with >0 counts | Bins with >2000 counts | High rate bins dominated by noise | Noise dominated (total time) | Noise dominated (detector-on time) | Marked lightcurve |
|---|---|---|---|---|---|---|---|
| A | 6284 | 5865 | 47 | 47 | 0.75% | 0.80% |  |
| B | 6284 | 5865 | 69 | 69 | 1.10% | 1.18% | 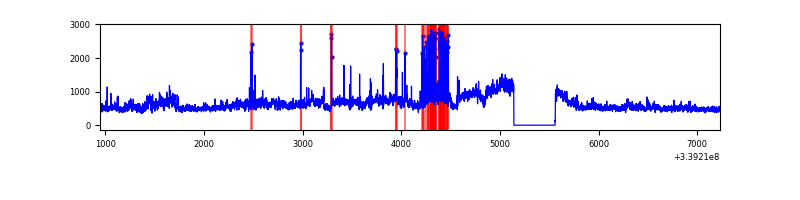 |
| C | 6283 | 5864 | 0 | 0 | 0.00% | 0.00% | 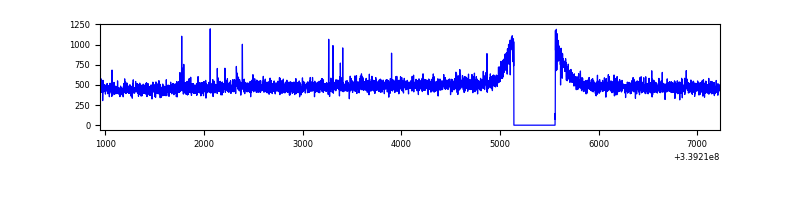 |
| D | 6283 | 5864 | 85 | 85 | 1.35% | 1.45% | 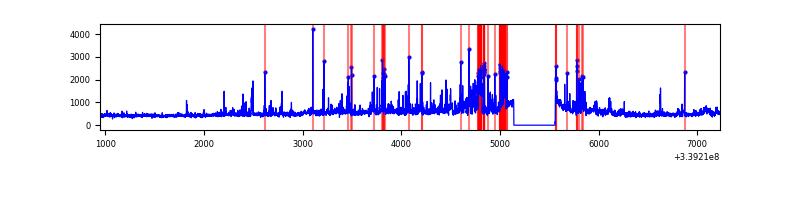 |
Top three noisy pixels from each quadrant. If the there are fewer than three noisy pixels in the level2.evt file, extra rows are filled as -1
| Pixel properties | Quadrant properties | ||||||
|---|---|---|---|---|---|---|---|
| Quadrant | DetID | PixID | Counts | Sigma | Mean | Median | Sigma |
| A | 14 | 235 | 811119 | 5431.76 | 730 | 714 | 149.2 |
| A | 8 | 192 | 28670 | 187.37 | 730 | 714 | 149.2 |
| A | 12 | 189 | 17235 | 110.73 | 730 | 714 | 149.2 |
| B | 0 | 189 | 625624 | 4430.17 | 725 | 705 | 141.1 |
| B | 3 | 112 | 258133 | 1824.96 | 725 | 705 | 141.1 |
| B | 7 | 205 | 148413 | 1047.13 | 725 | 705 | 141.1 |
| C | 14 | 238 | 112729 | 661.33 | 710 | 716 | 169.4 |
| C | 15 | 208 | 13972 | 78.26 | 710 | 716 | 169.4 |
| C | 4 | 224 | 7550 | 40.35 | 710 | 716 | 169.4 |
| D | 1 | 52 | 568272 | 3361.73 | 707 | 688 | 168.8 |
| D | 2 | 250 | 202355 | 1194.45 | 707 | 688 | 168.8 |
| D | 13 | 168 | 94239 | 554.09 | 707 | 688 | 168.8 |
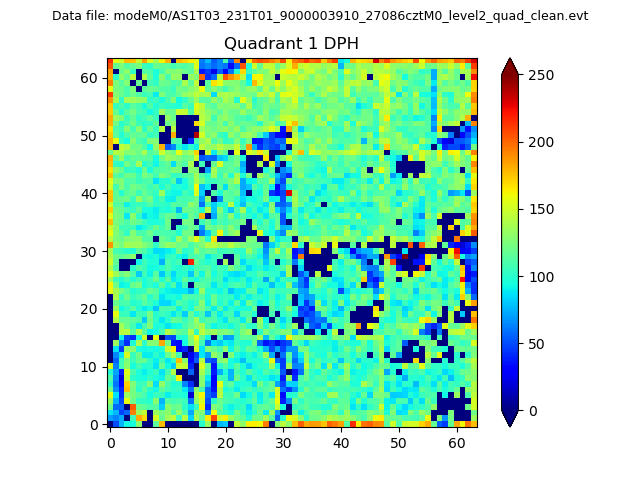
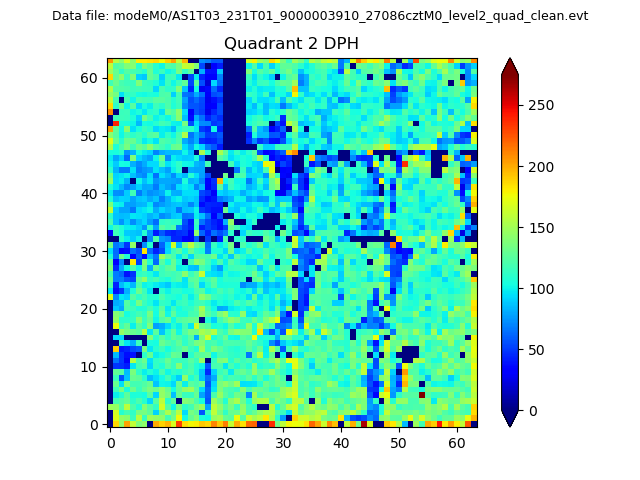
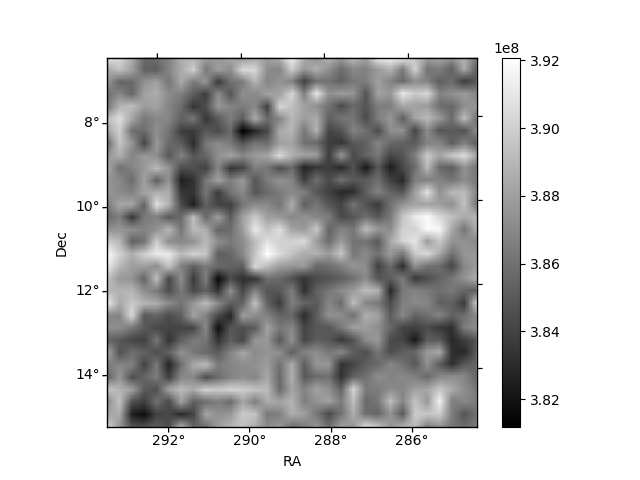
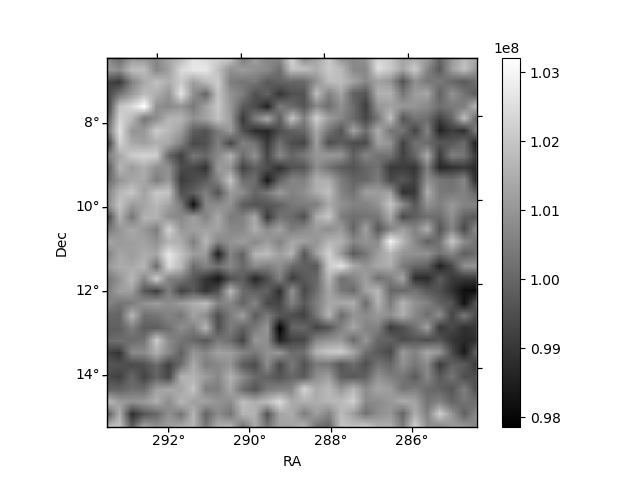
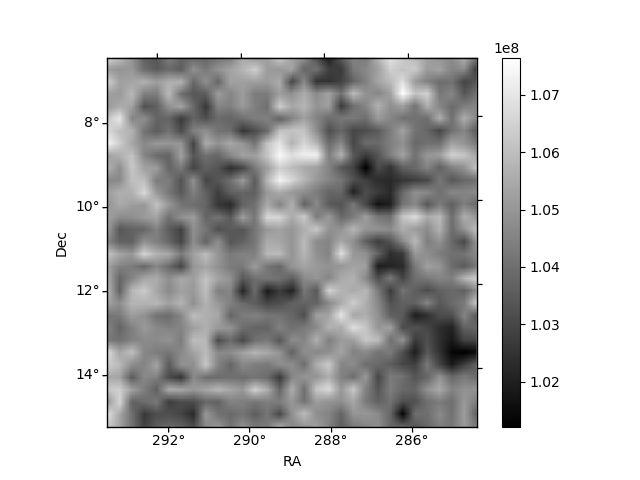
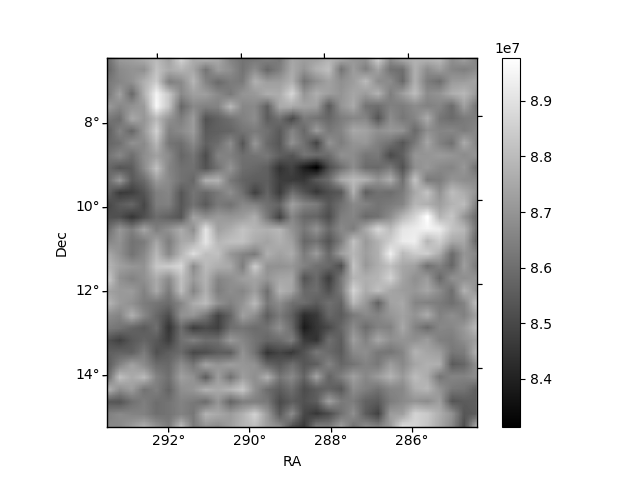
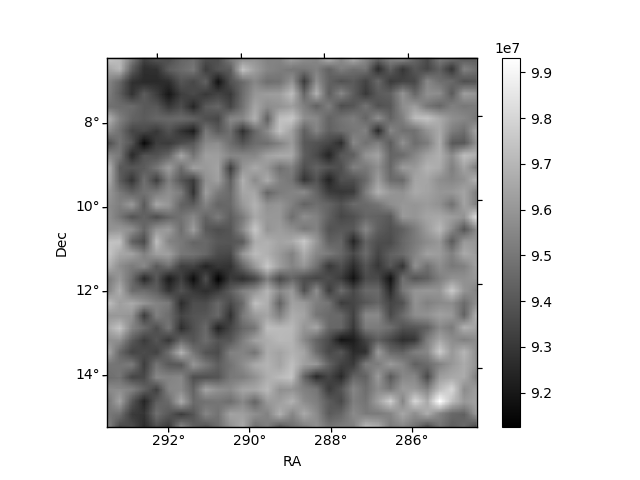
Histogram calculated using DETX and DETY for each event in the final _common_clean file
| Quadrant A | 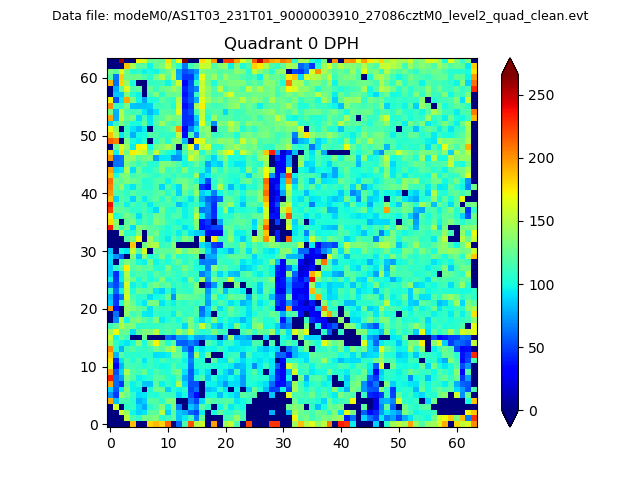 |
 |
Quadrant B |
|---|---|---|---|
| Quadrant D | 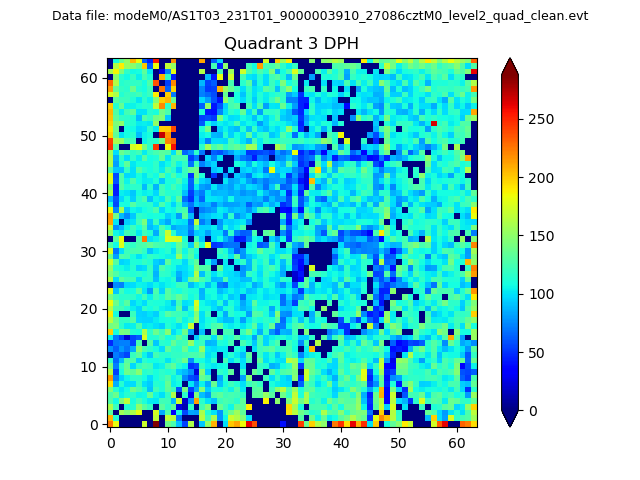 |
 |
Quadrant C |
| Plot type | Count rate plots | Images |
|---|---|---|
| Comparison with Poisson distribution Blue bars denote a histogram of data divided into 1 sec bins. Red curve is a Poisson curve with rate = median count rate of data. |
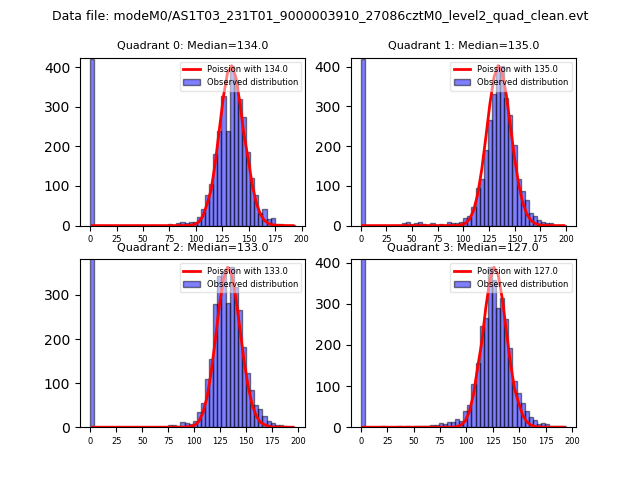 |
 |
| Quadrant-wise count rates Data is divided into 100 sec bins |
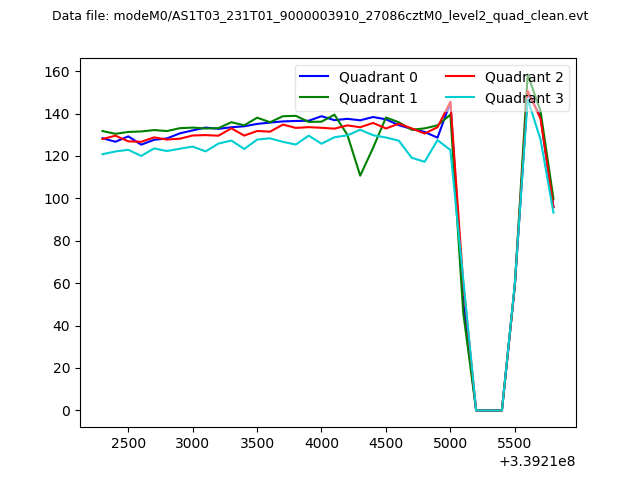 |
|
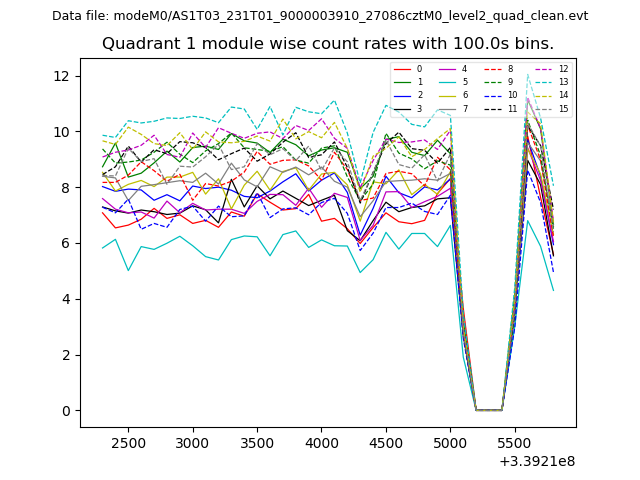
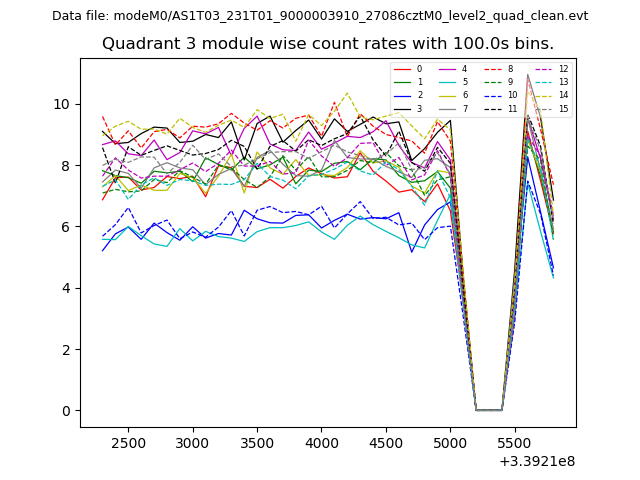
| Module-wise count rates for Quadrant A Data is divided into 100 sec bins |
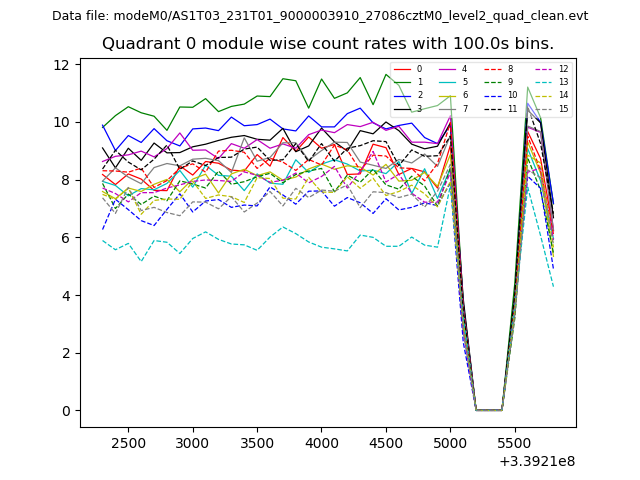 |
 |
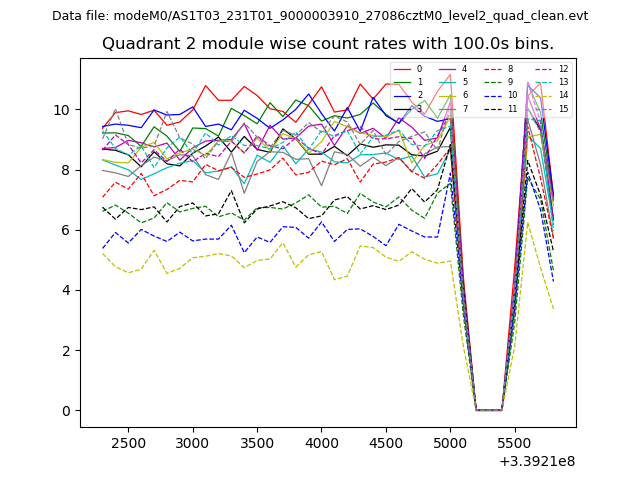
| Module-wise count rates for Quadrant B Data is divided into 100 sec bins |
 |
 |
| Module-wise count rates for Quadrant C Data is divided into 100 sec bins |
 |
 |
| Module-wise count rates for Quadrant D Data is divided into 100 sec bins |
 |
 |
| Parameter | Plot |
|---|---|
| CZT HV Monitor | 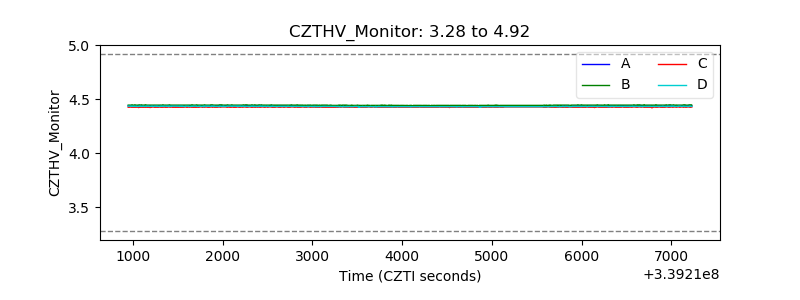 |
| D_VDD | 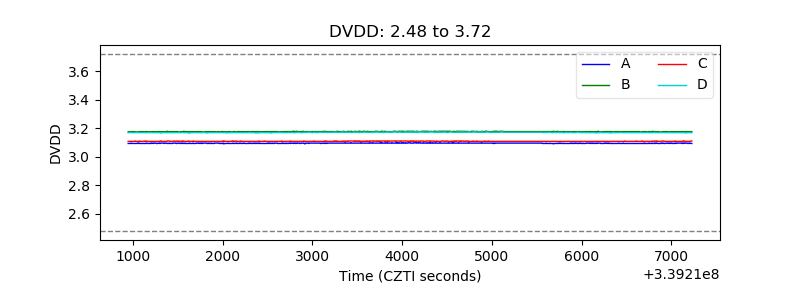 |
| Temperature 1 | 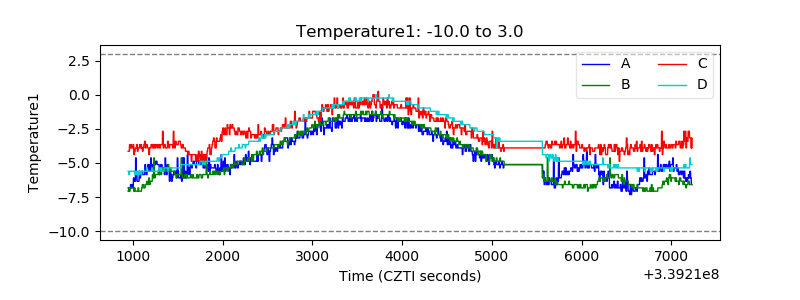 |
| Veto HV Monitor | 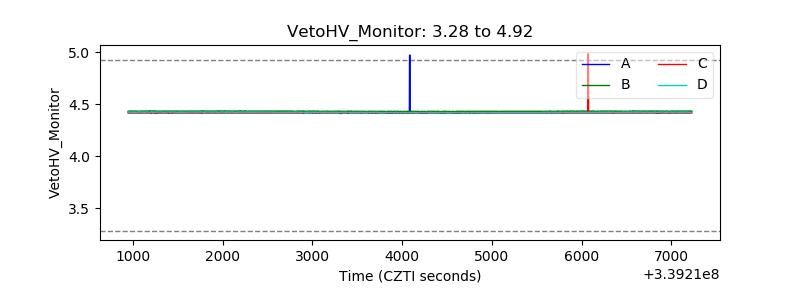 |
| Veto LLD | 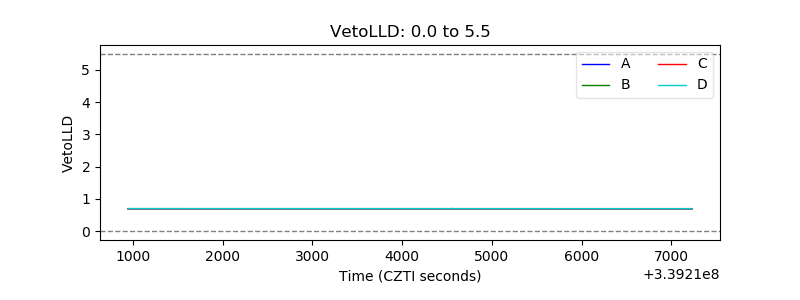 |
| Alpha Counter | 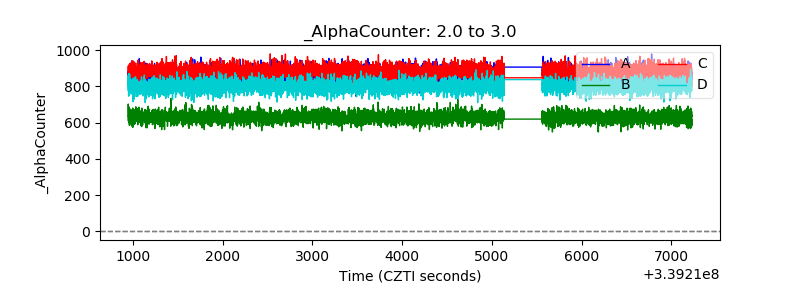 |
| _CPM_Rate | 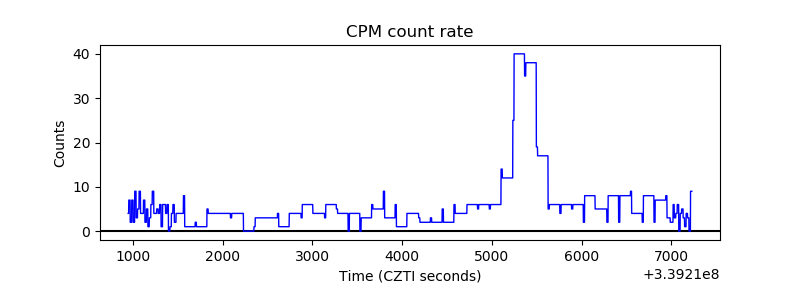 |
| CZT Counter | 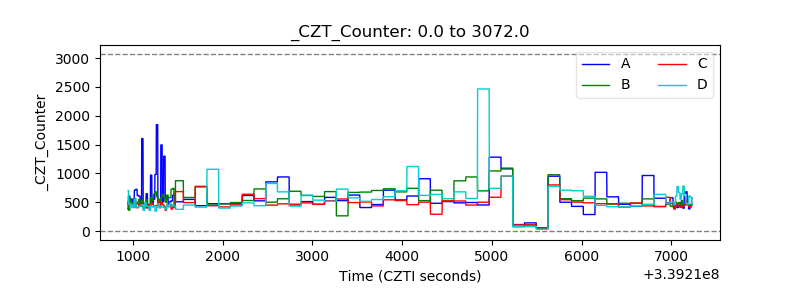 |
| +2.5 Volts monitor |  |
| +5 Volts monitor |  |
| _ROLL_ROT | 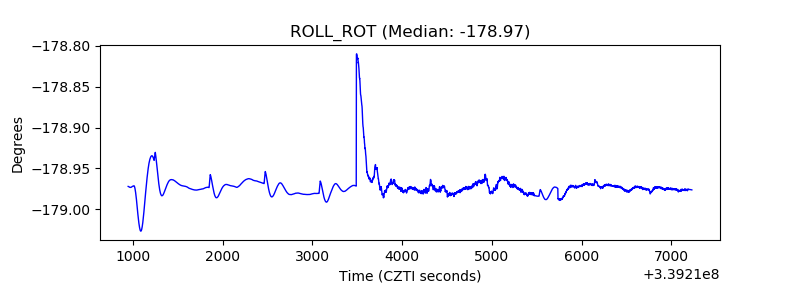 |
| _Roll_DEC |  |
| _Roll_RA | 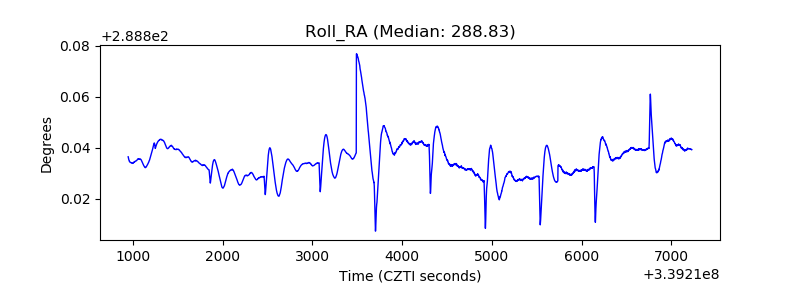 |
| Veto Counter | 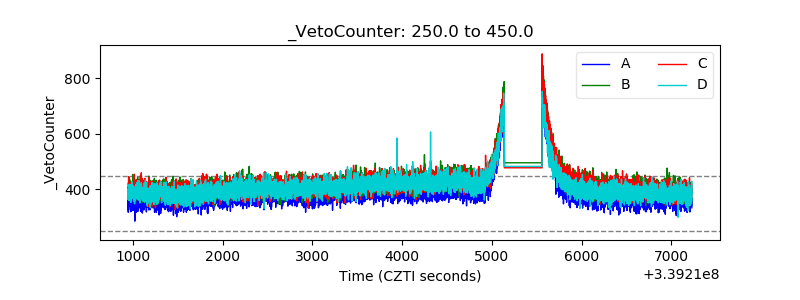 |