| Param | Original file | Final file |
|---|---|---|
| Filename | modeM0/AS1T03_231T01_9000003910_27087cztM0_level2.evt | modeM0/AS1T03_231T01_9000003910_27087cztM0_level2_quad_clean.evt |
| Size (bytes) | 242,064,000 | 29,782,080 |
| Size | 230.9 MB | 28.4 MB |
| Events in quadrant A | 2,015,500 | 165,242 |
| Events in quadrant B | 1,712,969 | 170,145 |
| Events in quadrant C | 1,594,586 | 162,758 |
| Events in quadrant D | 1,770,435 | 157,190 |
| Mode M0 | |||
|---|---|---|---|
| Quadrant | BADHDUFLAG | Total packets | Discarded packets |
| A | 0 | 8227 | 0 |
| B | 0 | 7190 | 0 |
| C | 0 | 6970 | 0 |
| D | 0 | 7484 | 0 |
| Quadrant | Total seconds | Saturated seconds | Saturation percentage |
|---|---|---|---|
| A | 3472 | 63 | 1.814516% |
| B | 3472 | 3 | 0.086406% |
| C | 3473 | 13 | 0.374316% |
| D | 3473 | 6 | 0.172761% |
Noise dominated data is calculated using 1-second bins in cleaned event files. If a bin has >2000 counts, and if more than 50% of those come from <1% of pixels, then it is considered to be noise-dominated and hence unusable.
| Quadrant | # 1 sec bins | Bins with >0 counts | Bins with >2000 counts | High rate bins dominated by noise | Noise dominated (total time) | Noise dominated (detector-on time) | Marked lightcurve |
|---|---|---|---|---|---|---|---|
| A | 3472 | 3472 | 40 | 40 | 1.15% | 1.15% | 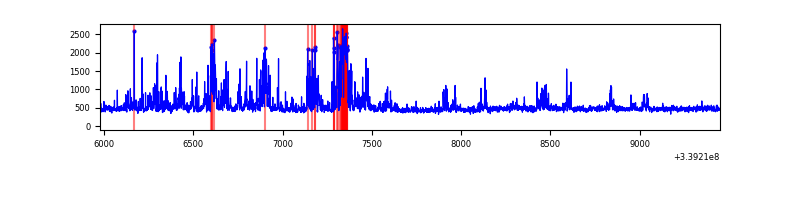 |
| B | 3472 | 3472 | 0 | 0 | 0.00% | 0.00% | 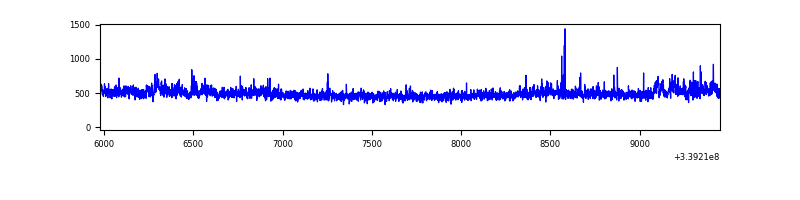 |
| C | 3473 | 3473 | 0 | 0 | 0.00% | 0.00% | 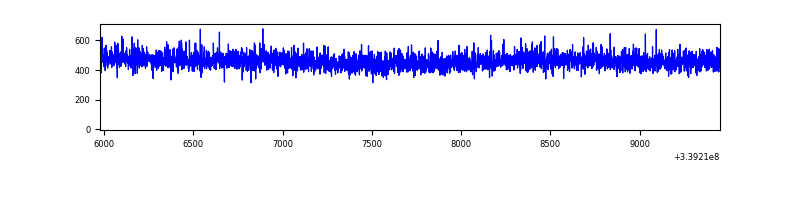 |
| D | 3473 | 3473 | 3 | 3 | 0.09% | 0.09% | 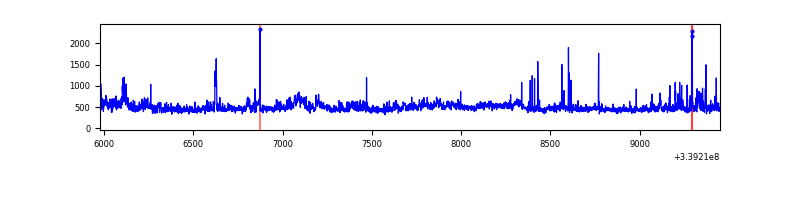 |
Top three noisy pixels from each quadrant. If the there are fewer than three noisy pixels in the level2.evt file, extra rows are filled as -1
| Pixel properties | Quadrant properties | ||||||
|---|---|---|---|---|---|---|---|
| Quadrant | DetID | PixID | Counts | Sigma | Mean | Median | Sigma |
| A | 14 | 235 | 438317 | 5285.12 | 402 | 395 | 82.9 |
| A | 12 | 189 | 14120 | 165.64 | 402 | 395 | 82.9 |
| A | 4 | 2 | 10715 | 124.55 | 402 | 395 | 82.9 |
| B | 3 | 112 | 83109 | 1042.89 | 404 | 393 | 79.3 |
| B | 0 | 189 | 26257 | 326.1 | 404 | 393 | 79.3 |
| B | 0 | 219 | 11840 | 144.33 | 404 | 393 | 79.3 |
| C | 14 | 238 | 63453 | 673.09 | 391 | 393 | 93.7 |
| C | 13 | 61 | 2766 | 25.33 | 391 | 393 | 93.7 |
| C | 15 | 208 | 1859 | 15.65 | 391 | 393 | 93.7 |
| D | 1 | 52 | 249726 | 2616.15 | 392 | 382 | 95.3 |
| D | 2 | 250 | 20617 | 212.31 | 392 | 382 | 95.3 |
| D | 12 | 233 | 18613 | 191.28 | 392 | 382 | 95.3 |
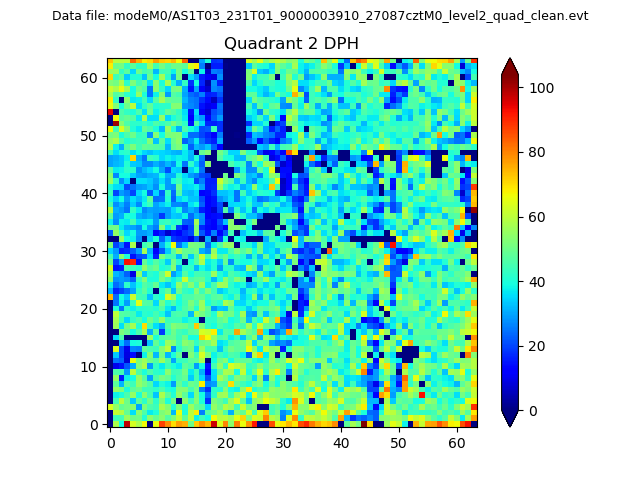
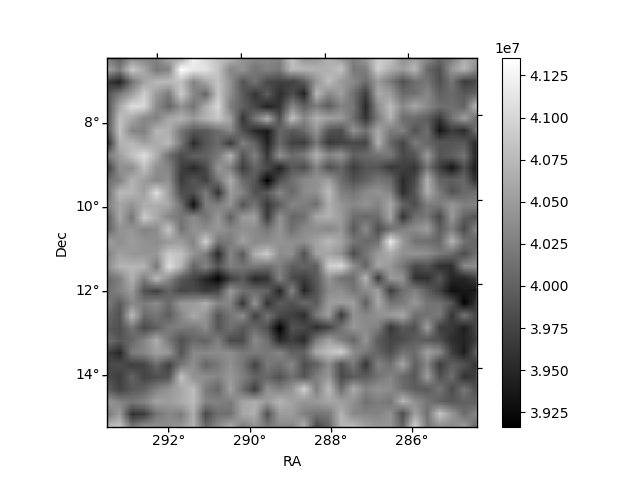
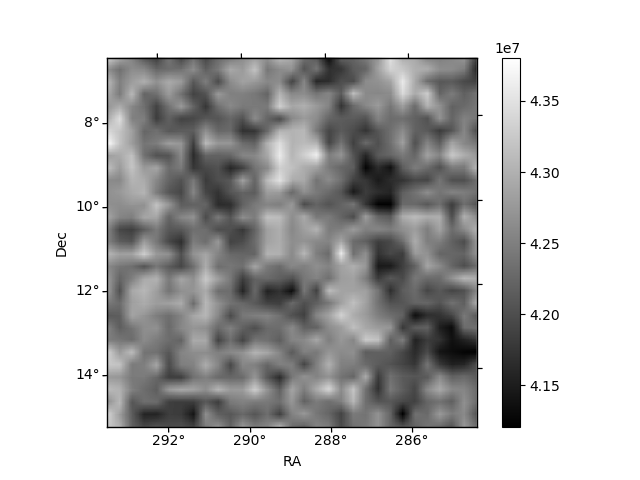
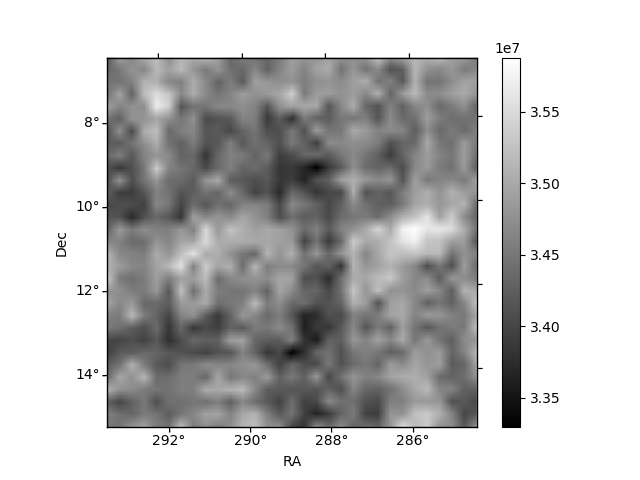
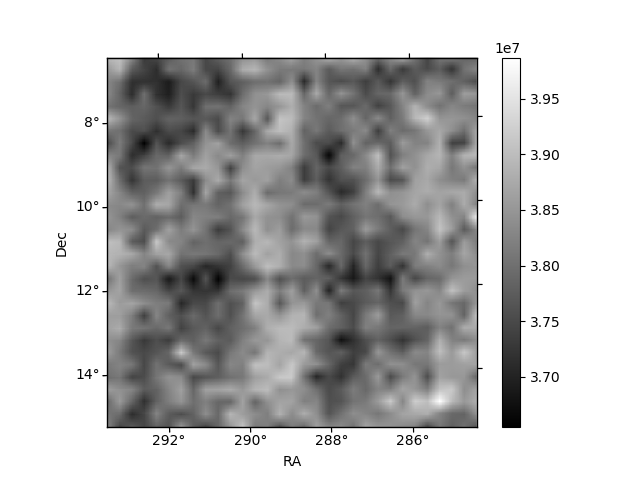
Histogram calculated using DETX and DETY for each event in the final _common_clean file
| Quadrant A | 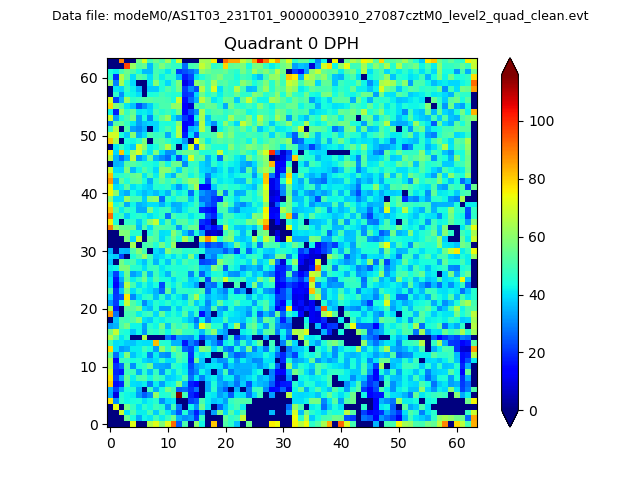 |
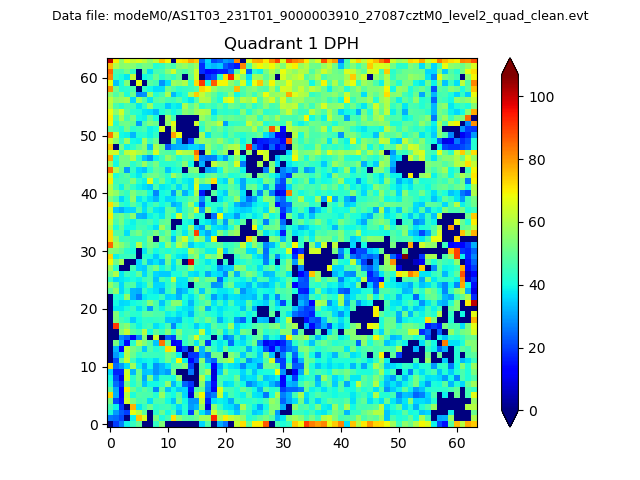 |
Quadrant B |
|---|---|---|---|
| Quadrant D | 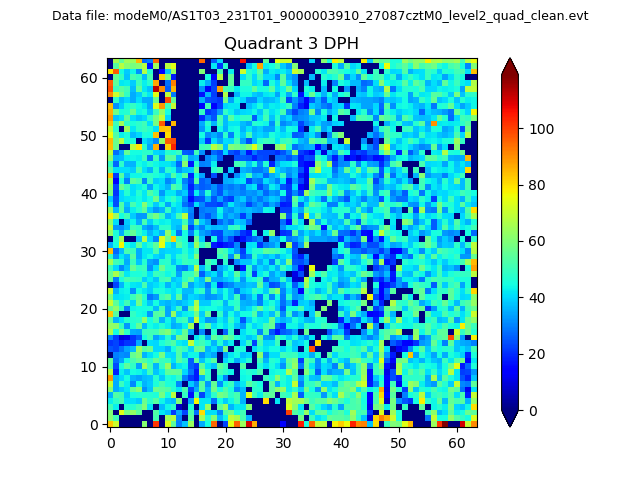 |
 |
Quadrant C |
| Plot type | Count rate plots | Images |
|---|---|---|
| Comparison with Poisson distribution Blue bars denote a histogram of data divided into 1 sec bins. Red curve is a Poisson curve with rate = median count rate of data. |
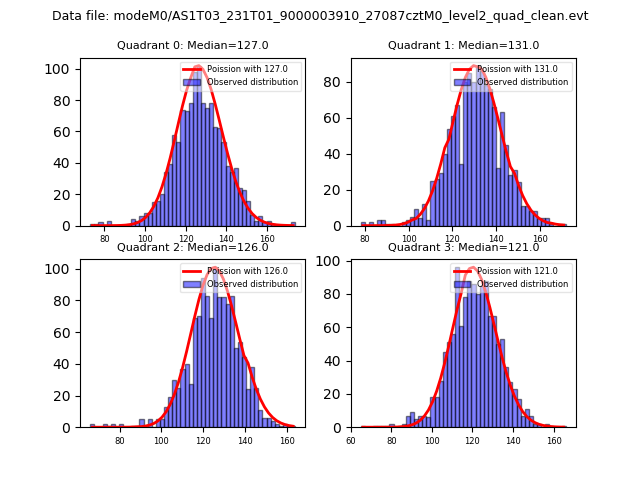 |
 |
| Quadrant-wise count rates Data is divided into 100 sec bins |
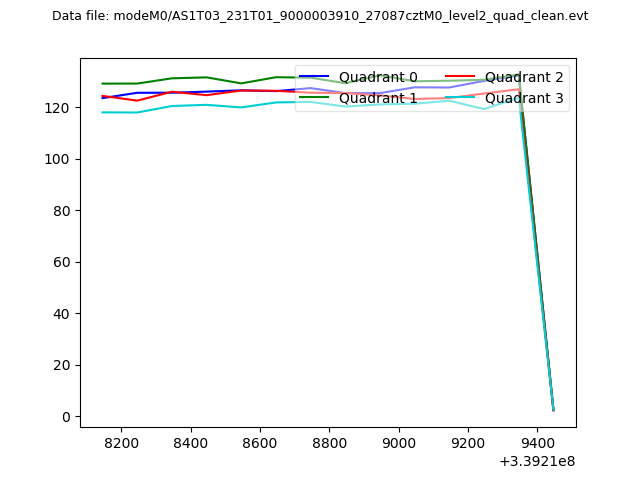 |
|
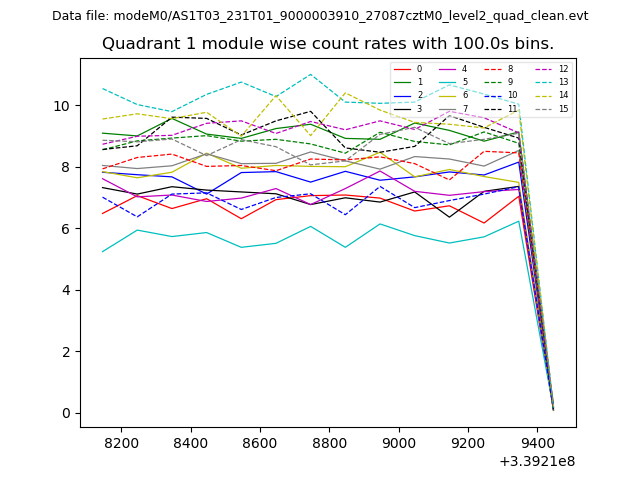
| Module-wise count rates for Quadrant A Data is divided into 100 sec bins |
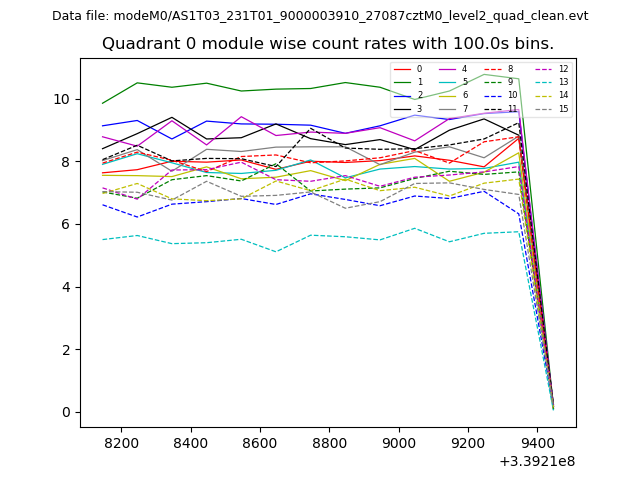 |
 |
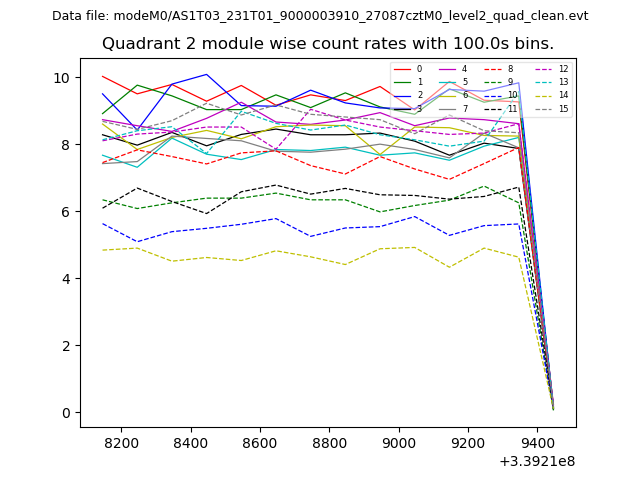
| Module-wise count rates for Quadrant B Data is divided into 100 sec bins |
 |
 |
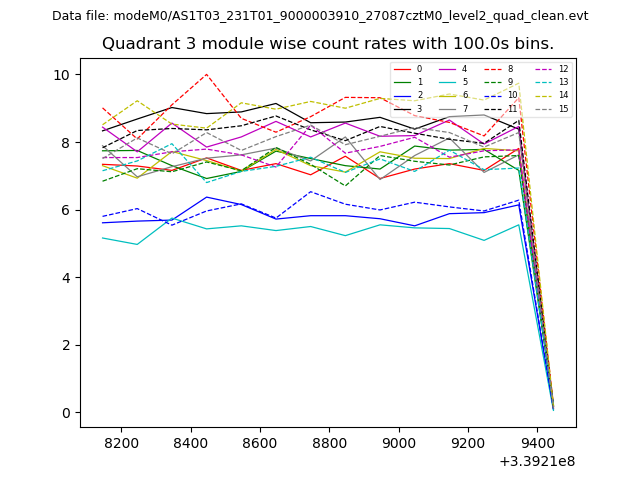
| Module-wise count rates for Quadrant C Data is divided into 100 sec bins |
 |
 |
| Module-wise count rates for Quadrant D Data is divided into 100 sec bins |
 |
 |
| Parameter | Plot |
|---|---|
| CZT HV Monitor | 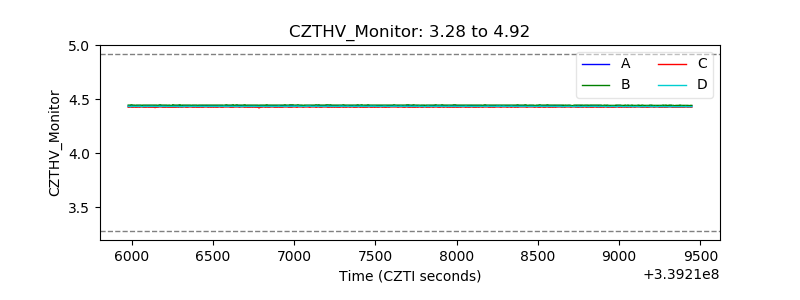 |
| D_VDD |  |
| Temperature 1 | 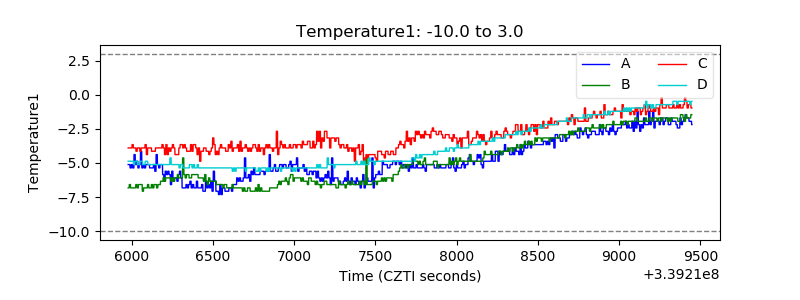 |
| Veto HV Monitor | 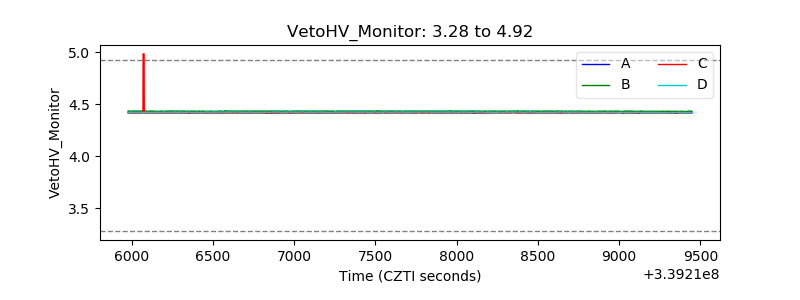 |
| Veto LLD | 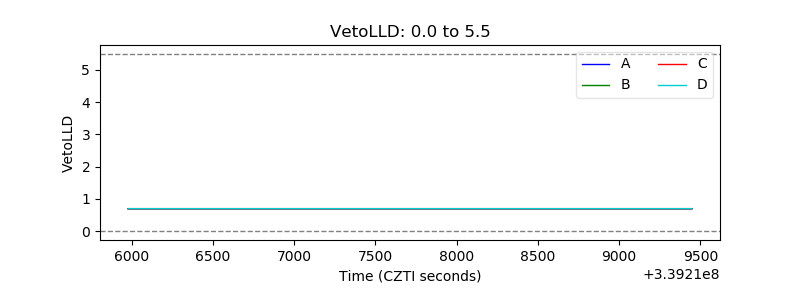 |
| Alpha Counter | 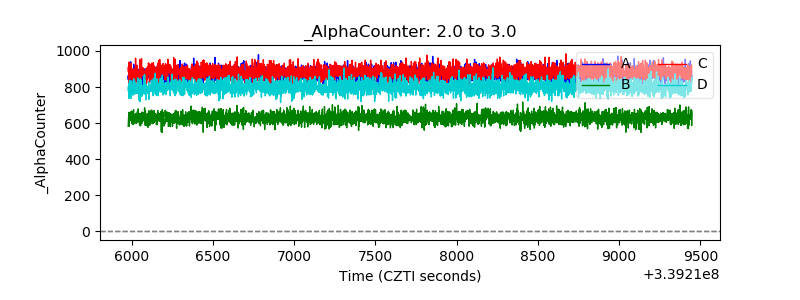 |
| _CPM_Rate | 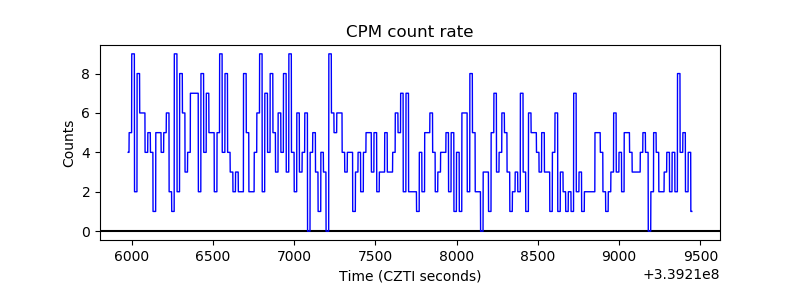 |
| CZT Counter | 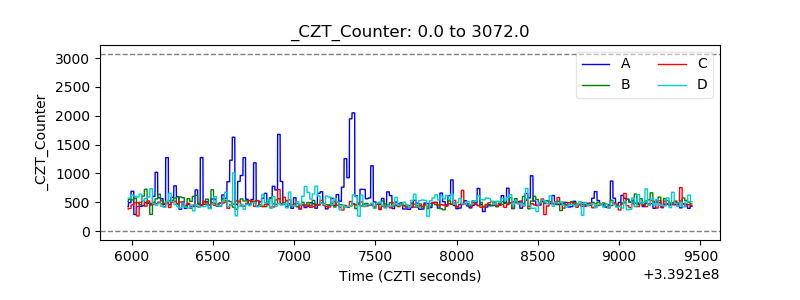 |
| +2.5 Volts monitor |  |
| +5 Volts monitor |  |
| _ROLL_ROT | 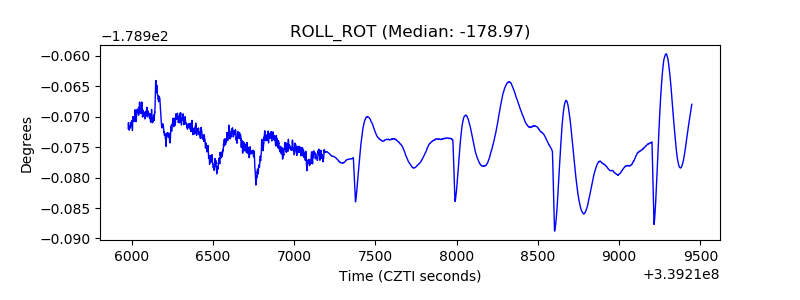 |
| _Roll_DEC | 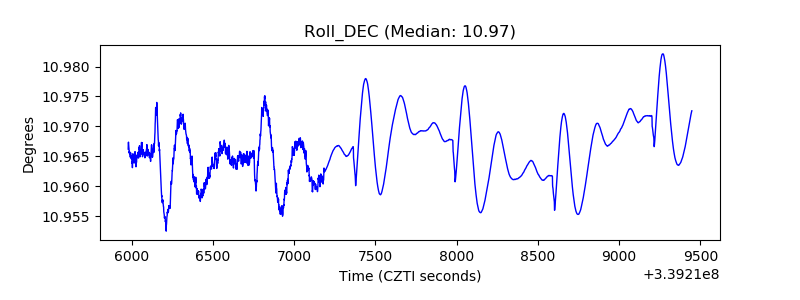 |
| _Roll_RA |  |
| Veto Counter | 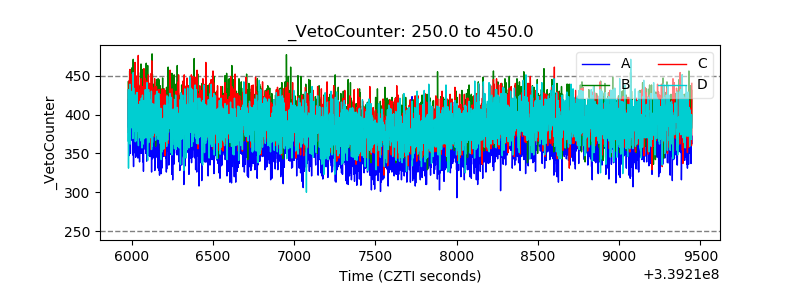 |