| Param | Original file | Final file |
|---|---|---|
| Filename | modeM0/AS1T03_231T01_9000003910_27088cztM0_level2.evt | modeM0/AS1T03_231T01_9000003910_27088cztM0_level2_quad_clean.evt |
| Size (bytes) | 918,737,280 | 147,726,720 |
| Size | 876.2 MB | 140.9 MB |
| Events in quadrant A | 7,078,800 | 910,653 |
| Events in quadrant B | 7,243,363 | 927,600 |
| Events in quadrant C | 6,118,050 | 900,344 |
| Events in quadrant D | 6,537,257 | 870,298 |
| Mode M0 | |||
|---|---|---|---|
| Quadrant | BADHDUFLAG | Total packets | Discarded packets |
| A | 0 | 28920 | 0 |
| B | 0 | 29413 | 0 |
| C | 0 | 25903 | 0 |
| D | 0 | 27592 | 0 |
| Mode M9 | |||
|---|---|---|---|
| Quadrant | BADHDUFLAG | Total packets | Discarded packets |
| A | 0 | 5 | 0 |
| B | 0 | 5 | 0 |
| C | 0 | 5 | 0 |
| D | 0 | 5 | 0 |
| Quadrant | Total seconds | Saturated seconds | Saturation percentage |
|---|---|---|---|
| A | 12509 | 447 | 3.573427% |
| B | 12510 | 374 | 2.989608% |
| C | 12510 | 310 | 2.478018% |
| D | 12510 | 249 | 1.990408% |
Noise dominated data is calculated using 1-second bins in cleaned event files. If a bin has >2000 counts, and if more than 50% of those come from <1% of pixels, then it is considered to be noise-dominated and hence unusable.
| Quadrant | # 1 sec bins | Bins with >0 counts | Bins with >2000 counts | High rate bins dominated by noise | Noise dominated (total time) | Noise dominated (detector-on time) | Marked lightcurve |
|---|---|---|---|---|---|---|---|
| A | 13009 | 12512 | 87 | 87 | 0.67% | 0.70% | 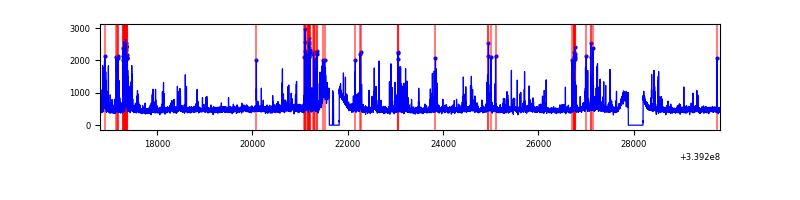 |
| B | 13010 | 12513 | 14 | 14 | 0.11% | 0.11% | 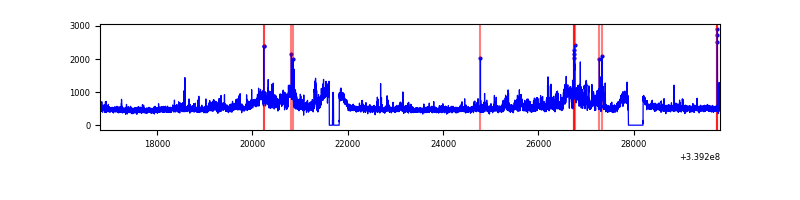 |
| C | 13010 | 12513 | 0 | 0 | 0.00% | 0.00% | 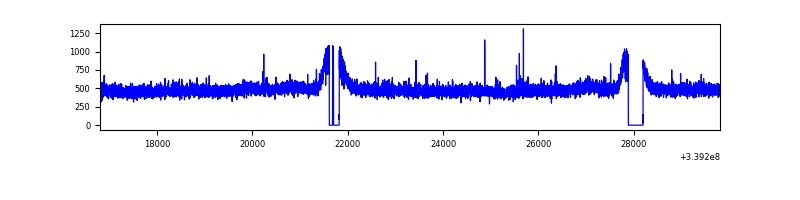 |
| D | 13010 | 12513 | 52 | 52 | 0.40% | 0.42% | 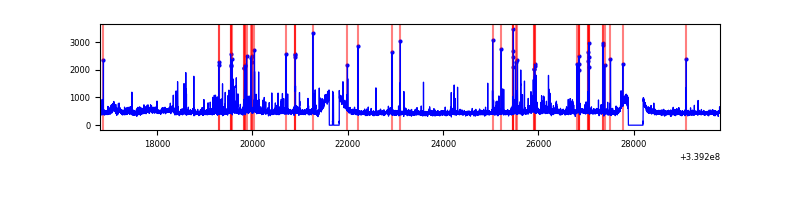 |
Top three noisy pixels from each quadrant. If the there are fewer than three noisy pixels in the level2.evt file, extra rows are filled as -1
| Pixel properties | Quadrant properties | ||||||
|---|---|---|---|---|---|---|---|
| Quadrant | DetID | PixID | Counts | Sigma | Mean | Median | Sigma |
| A | 14 | 235 | 980769 | 3136.13 | 1545 | 1513 | 312.3 |
| A | 12 | 189 | 118720 | 375.36 | 1545 | 1513 | 312.3 |
| A | 13 | 254 | 20918 | 62.15 | 1545 | 1513 | 312.3 |
| B | 0 | 189 | 764777 | 2555.23 | 1543 | 1504 | 298.7 |
| B | 3 | 112 | 358859 | 1196.33 | 1543 | 1504 | 298.7 |
| B | 0 | 219 | 40025 | 128.96 | 1543 | 1504 | 298.7 |
| C | 14 | 238 | 235024 | 661.39 | 1500 | 1510 | 353.1 |
| C | 15 | 208 | 21116 | 55.53 | 1500 | 1510 | 353.1 |
| C | 3 | 233 | 11291 | 27.7 | 1500 | 1510 | 353.1 |
| D | 1 | 52 | 403822 | 1106.22 | 1510 | 1470 | 363.7 |
| D | 2 | 250 | 182587 | 497.96 | 1510 | 1470 | 363.7 |
| D | 7 | 38 | 118012 | 320.42 | 1510 | 1470 | 363.7 |
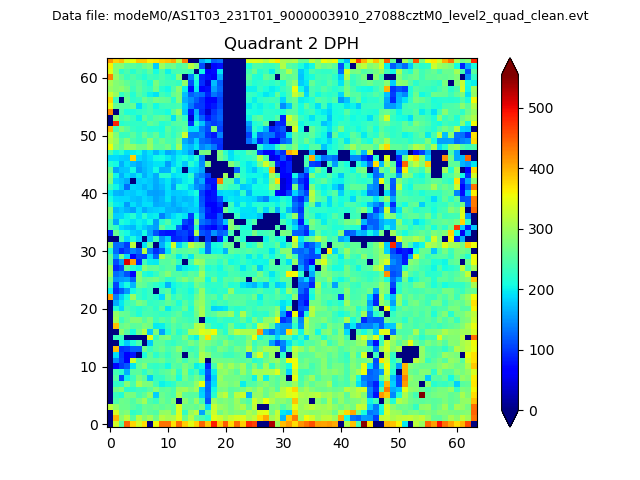
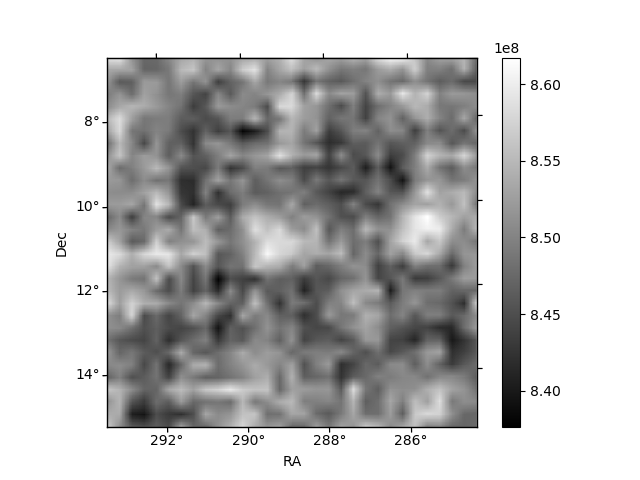
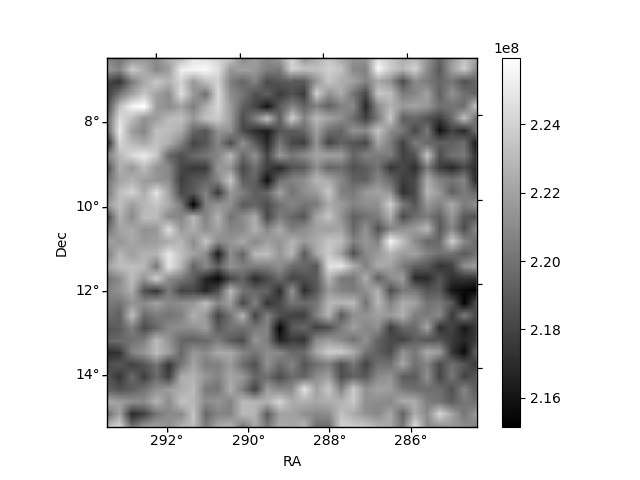
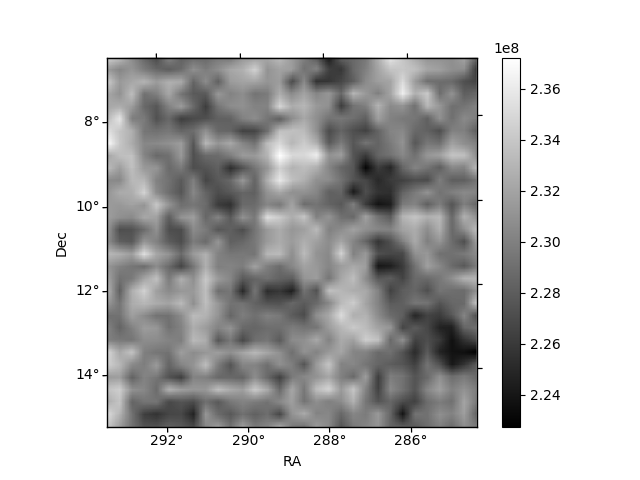
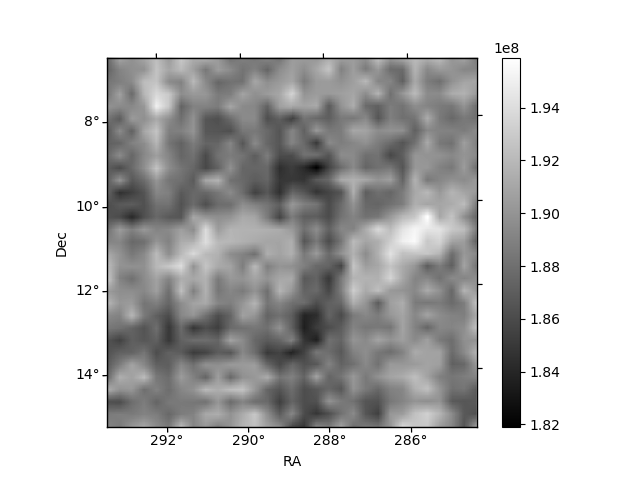
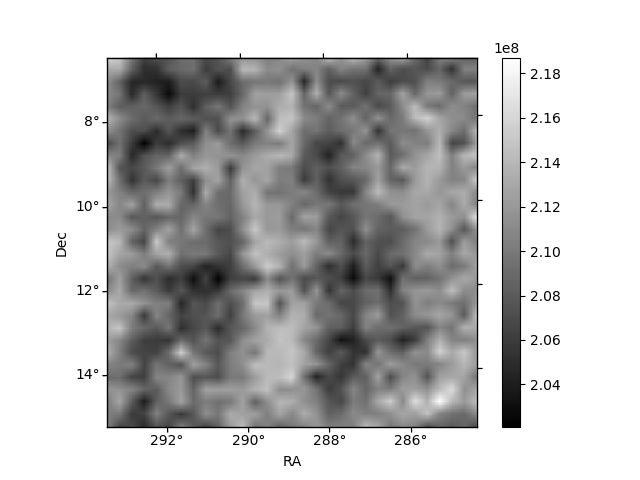
Histogram calculated using DETX and DETY for each event in the final _common_clean file
| Quadrant A | 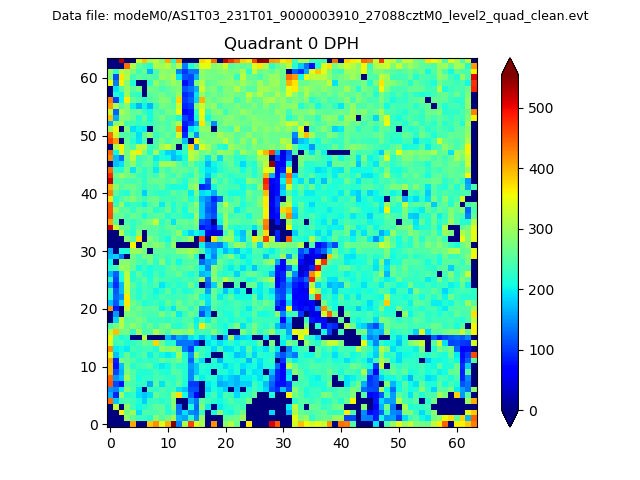 |
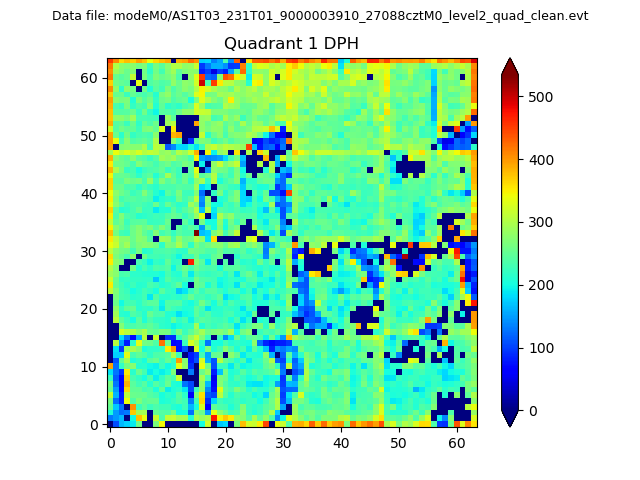 |
Quadrant B |
|---|---|---|---|
| Quadrant D | 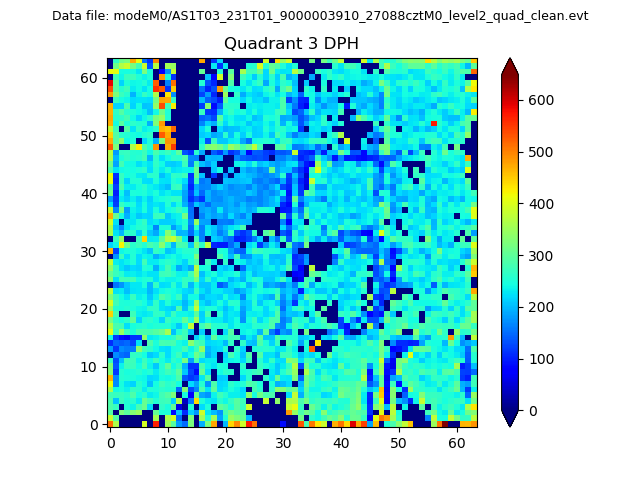 |
 |
Quadrant C |
| Plot type | Count rate plots | Images |
|---|---|---|
| Comparison with Poisson distribution Blue bars denote a histogram of data divided into 1 sec bins. Red curve is a Poisson curve with rate = median count rate of data. |
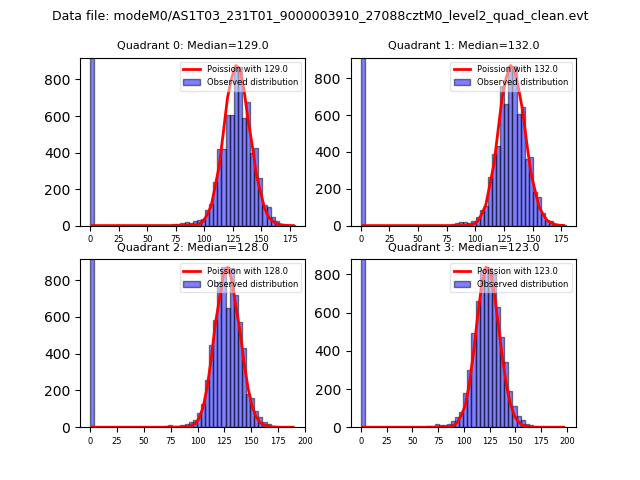 |
 |
| Quadrant-wise count rates Data is divided into 100 sec bins |
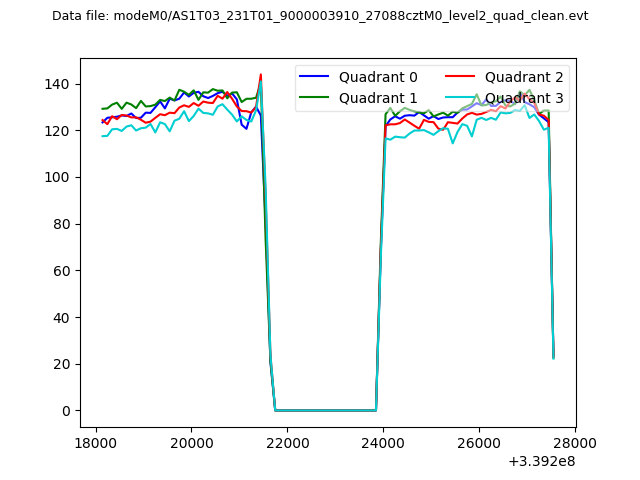 |
|
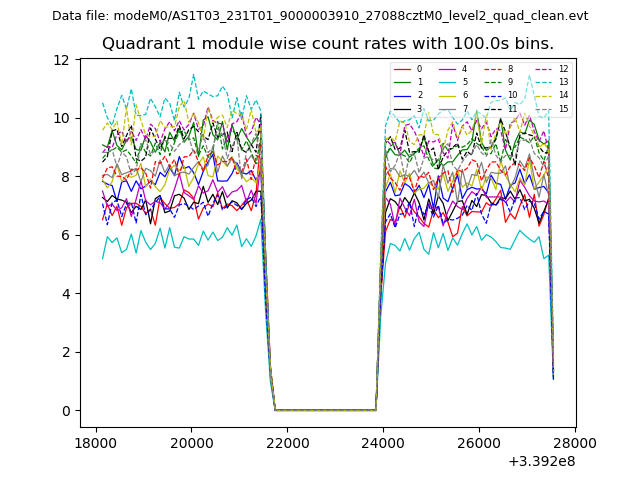
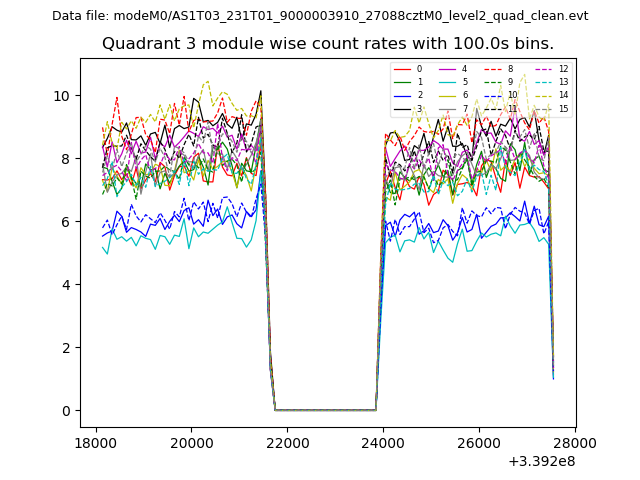
| Module-wise count rates for Quadrant A Data is divided into 100 sec bins |
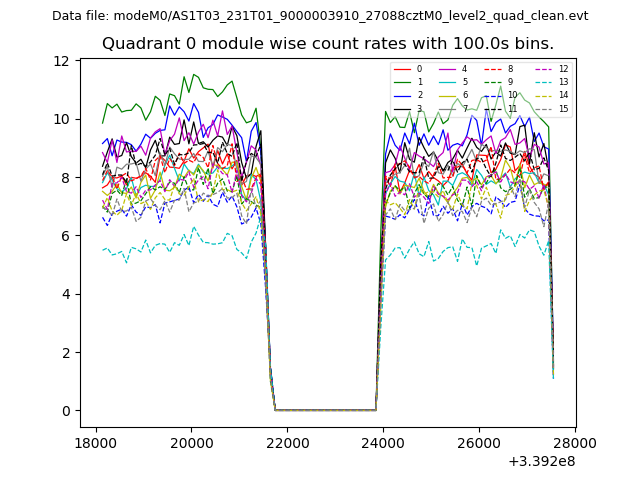 |
 |
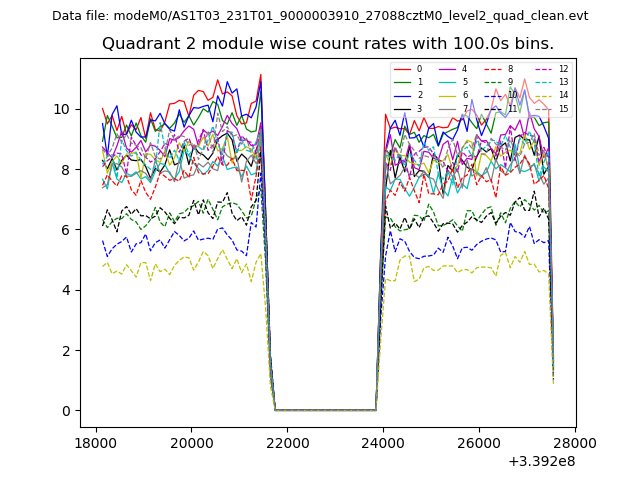
| Module-wise count rates for Quadrant B Data is divided into 100 sec bins |
 |
 |
| Module-wise count rates for Quadrant C Data is divided into 100 sec bins |
 |
 |
| Module-wise count rates for Quadrant D Data is divided into 100 sec bins |
 |
 |
| Parameter | Plot |
|---|---|
| CZT HV Monitor | 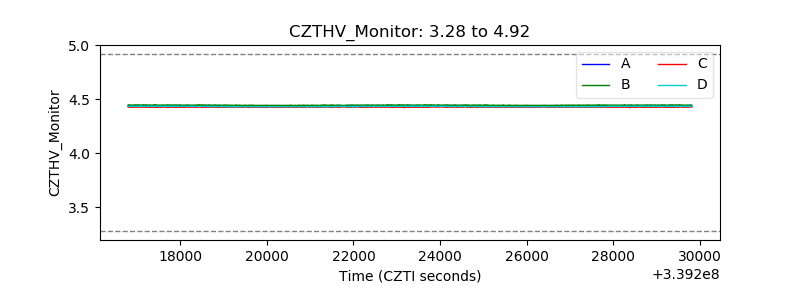 |
| D_VDD | 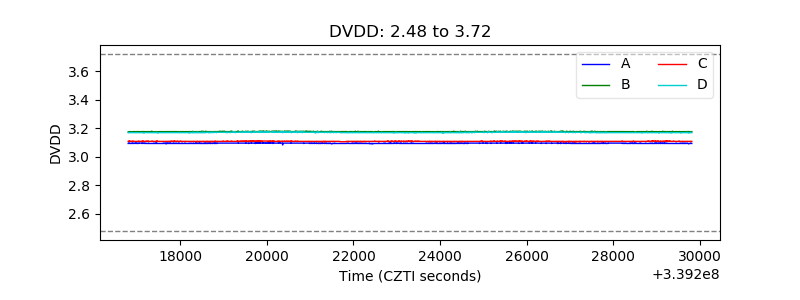 |
| Temperature 1 |  |
| Veto HV Monitor | 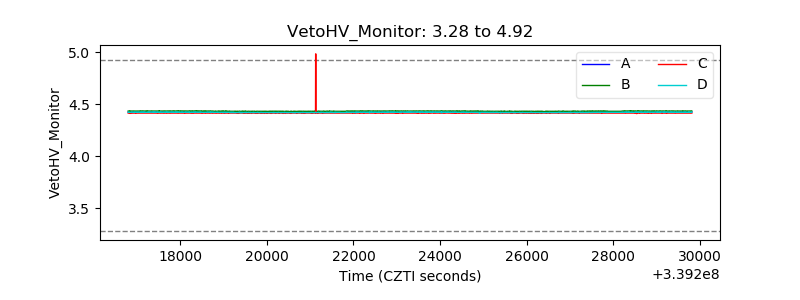 |
| Veto LLD | 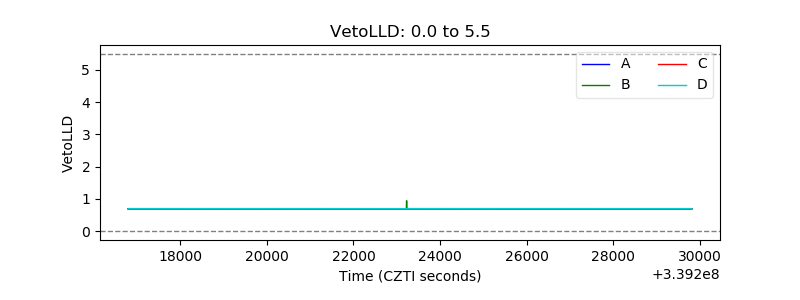 |
| Alpha Counter | 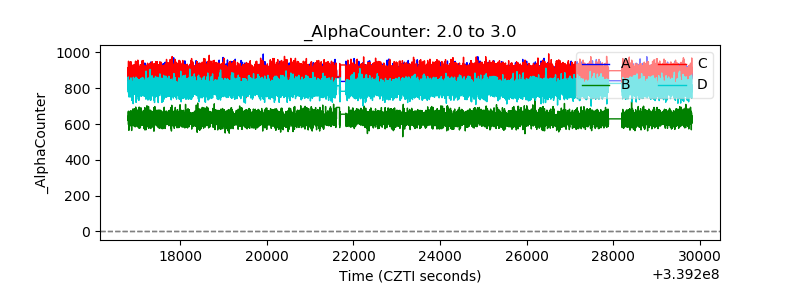 |
| _CPM_Rate | 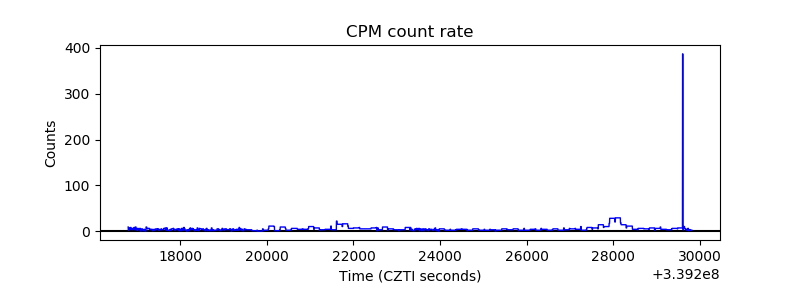 |
| CZT Counter |  |
| +2.5 Volts monitor |  |
| +5 Volts monitor |  |
| _ROLL_ROT | 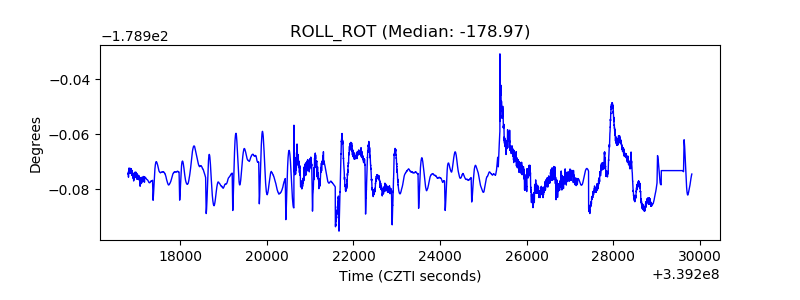 |
| _Roll_DEC | 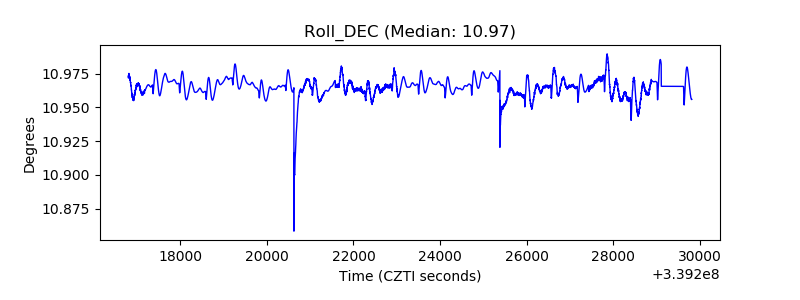 |
| _Roll_RA | 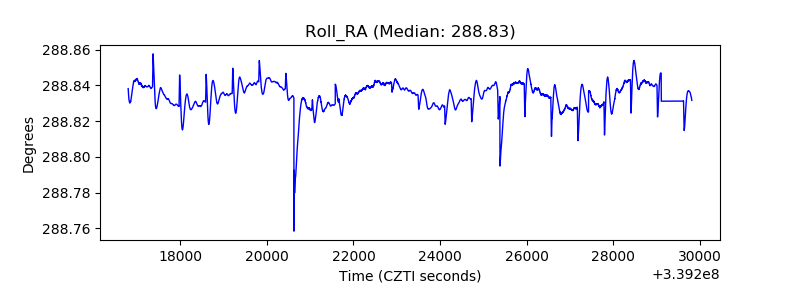 |
| Veto Counter | 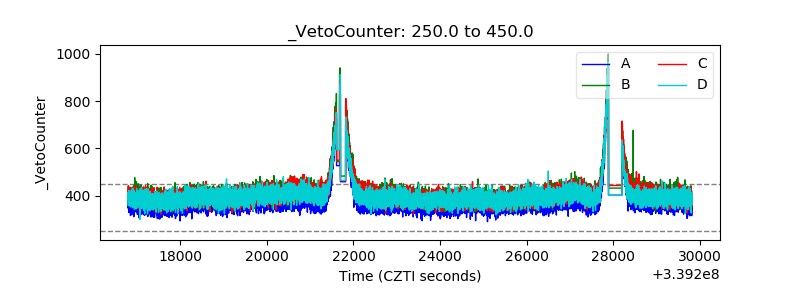 |