| Param | Original file | Final file |
|---|---|---|
| Filename | modeM0/AS1T03_231T01_9000003910_27091cztM0_level2.evt | modeM0/AS1T03_231T01_9000003910_27091cztM0_level2_quad_clean.evt |
| Size (bytes) | 1,474,424,640 | 237,553,920 |
| Size | 1.4 GB | 226.5 MB |
| Events in quadrant A | 9,681,096 | 1,524,676 |
| Events in quadrant B | 12,048,677 | 1,520,613 |
| Events in quadrant C | 8,766,268 | 1,484,521 |
| Events in quadrant D | 12,927,186 | 1,408,602 |
| Mode M0 | |||
|---|---|---|---|
| Quadrant | BADHDUFLAG | Total packets | Discarded packets |
| A | 0 | 40212 | 0 |
| B | 0 | 47506 | 0 |
| C | 0 | 37337 | 0 |
| D | 0 | 50304 | 0 |
| Mode M9 | |||
|---|---|---|---|
| Quadrant | BADHDUFLAG | Total packets | Discarded packets |
| A | 0 | 20 | 0 |
| B | 0 | 20 | 0 |
| C | 0 | 20 | 0 |
| D | 0 | 20 | 0 |
| Quadrant | Total seconds | Saturated seconds | Saturation percentage |
|---|---|---|---|
| A | 18223 | 387 | 2.123690% |
| B | 18224 | 554 | 3.039947% |
| C | 18224 | 283 | 1.552897% |
| D | 18223 | 1008 | 5.531471% |
Noise dominated data is calculated using 1-second bins in cleaned event files. If a bin has >2000 counts, and if more than 50% of those come from <1% of pixels, then it is considered to be noise-dominated and hence unusable.
| Quadrant | # 1 sec bins | Bins with >0 counts | Bins with >2000 counts | High rate bins dominated by noise | Noise dominated (total time) | Noise dominated (detector-on time) | Marked lightcurve |
|---|---|---|---|---|---|---|---|
| A | 20253 | 18226 | 122 | 122 | 0.60% | 0.67% | 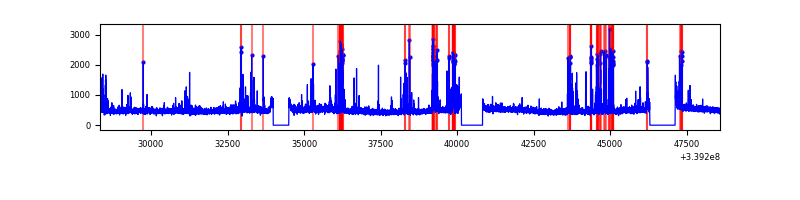 |
| B | 20254 | 18227 | 227 | 227 | 1.12% | 1.25% | 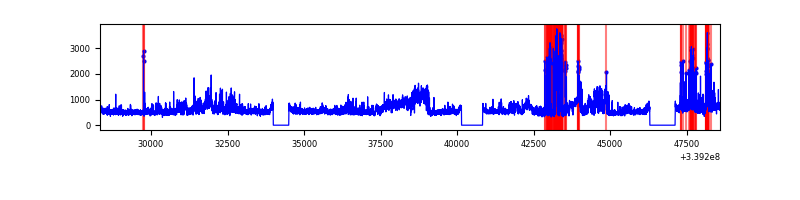 |
| C | 20254 | 18227 | 6 | 6 | 0.03% | 0.03% | 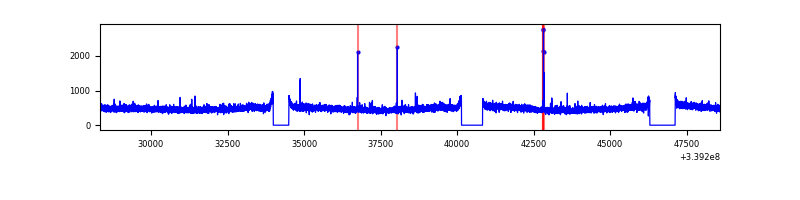 |
| D | 20253 | 18226 | 949 | 949 | 4.69% | 5.21% | 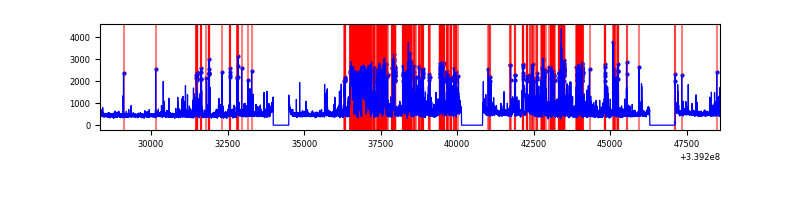 |
Top three noisy pixels from each quadrant. If the there are fewer than three noisy pixels in the level2.evt file, extra rows are filled as -1
| Pixel properties | Quadrant properties | ||||||
|---|---|---|---|---|---|---|---|
| Quadrant | DetID | PixID | Counts | Sigma | Mean | Median | Sigma |
| A | 14 | 235 | 974478 | 2178.56 | 2223 | 2176 | 446.3 |
| A | 12 | 189 | 110887 | 243.58 | 2223 | 2176 | 446.3 |
| A | 13 | 254 | 29179 | 60.5 | 2223 | 2176 | 446.3 |
| B | 0 | 189 | 2740686 | 6512.87 | 2203 | 2145 | 420.5 |
| B | 3 | 112 | 445217 | 1053.73 | 2203 | 2145 | 420.5 |
| B | 10 | 245 | 108230 | 252.29 | 2203 | 2145 | 420.5 |
| C | 14 | 238 | 339703 | 670.42 | 2147 | 2163 | 503.5 |
| C | 15 | 208 | 40816 | 76.77 | 2147 | 2163 | 503.5 |
| C | 4 | 224 | 18329 | 32.11 | 2147 | 2163 | 503.5 |
| D | 1 | 52 | 3693260 | 7214.25 | 2138 | 2078 | 511.7 |
| D | 2 | 250 | 566258 | 1102.66 | 2138 | 2078 | 511.7 |
| D | 11 | 176 | 287808 | 558.45 | 2138 | 2078 | 511.7 |
Histogram calculated using DETX and DETY for each event in the final _common_clean file
| Quadrant A |  |
 |
Quadrant B |
|---|---|---|---|
| Quadrant D | 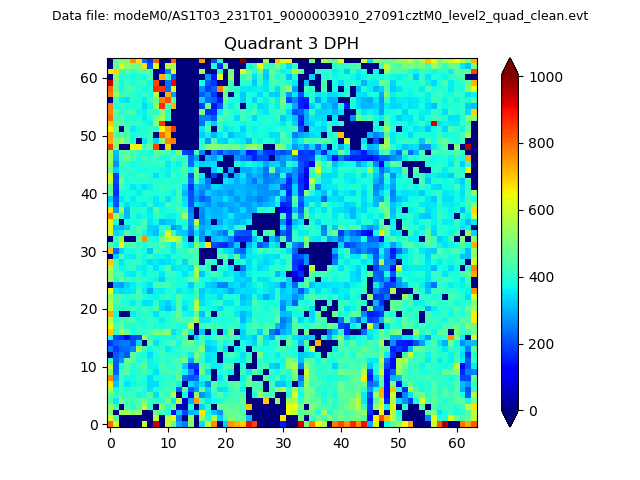 |
 |
Quadrant C |
| Plot type | Count rate plots | Images |
|---|---|---|
| Comparison with Poisson distribution Blue bars denote a histogram of data divided into 1 sec bins. Red curve is a Poisson curve with rate = median count rate of data. |
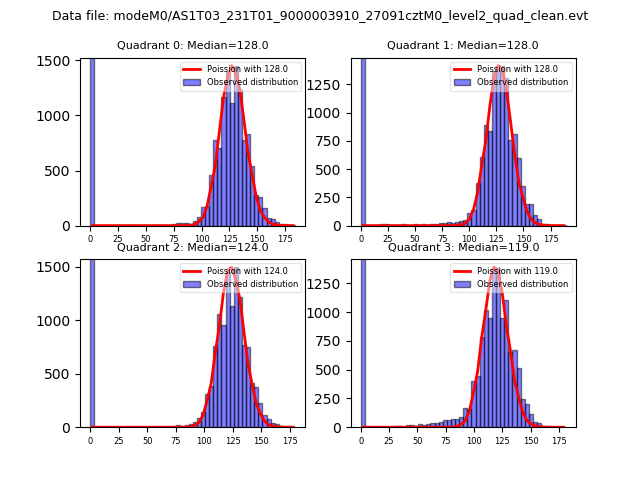 |
 |
| Quadrant-wise count rates Data is divided into 100 sec bins |
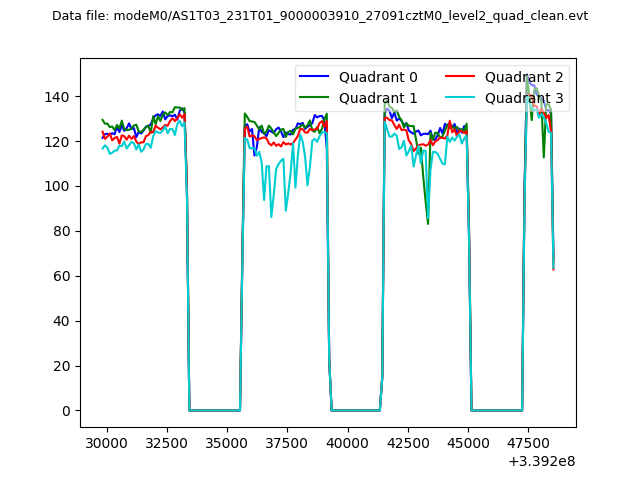 |
|
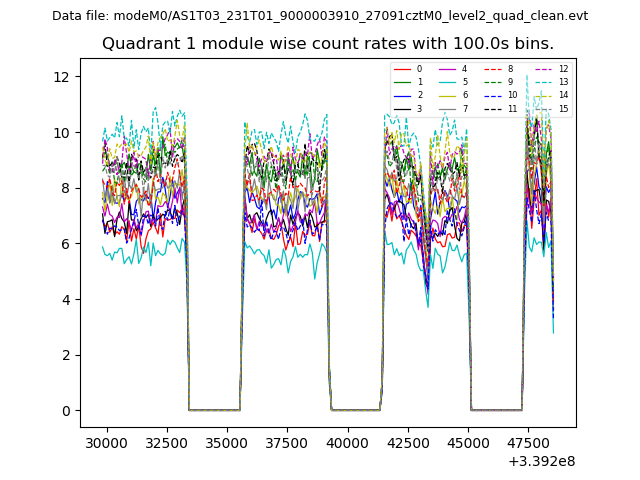
| Module-wise count rates for Quadrant A Data is divided into 100 sec bins |
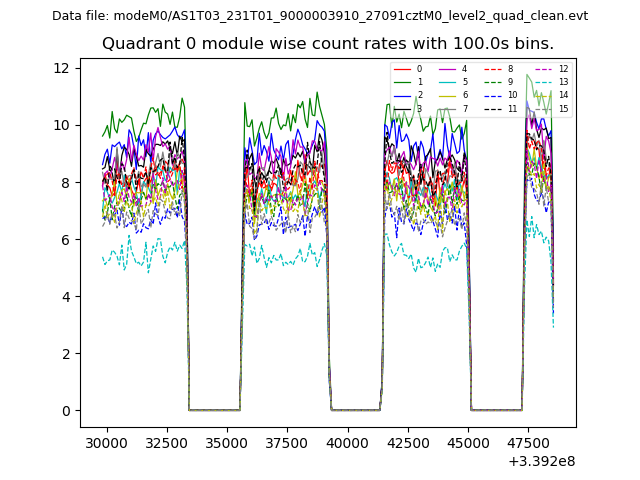 |
 |
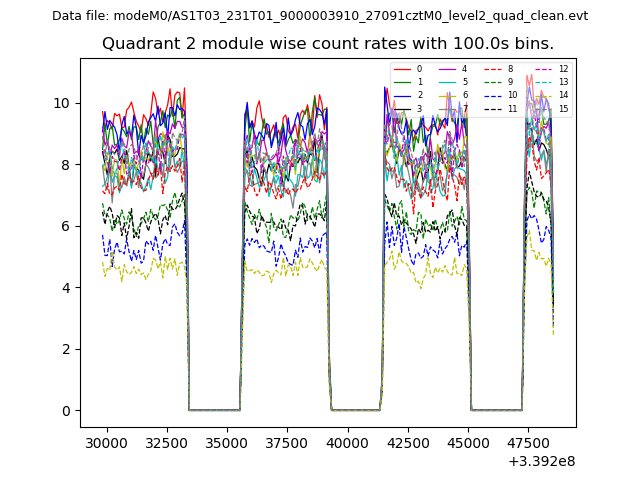
| Module-wise count rates for Quadrant B Data is divided into 100 sec bins |
 |
 |
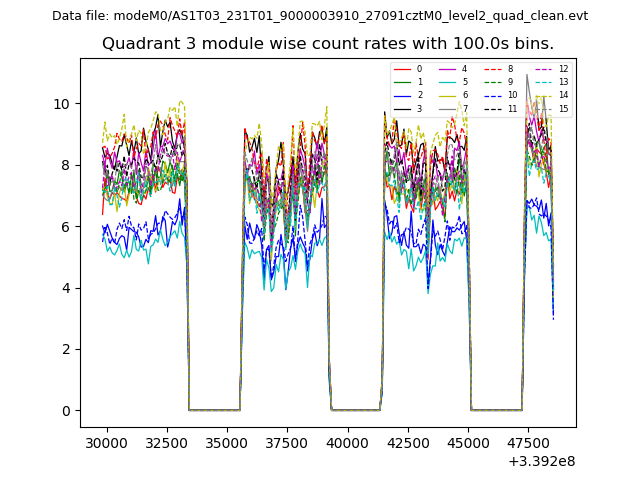
| Module-wise count rates for Quadrant C Data is divided into 100 sec bins |
 |
 |
| Module-wise count rates for Quadrant D Data is divided into 100 sec bins |
 |
 |
| Parameter | Plot |
|---|---|
| CZT HV Monitor | 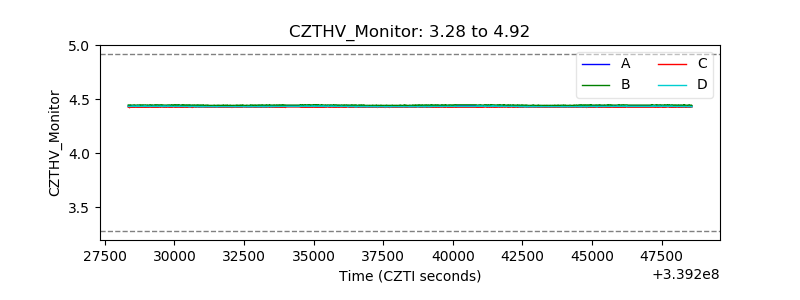 |
| D_VDD | 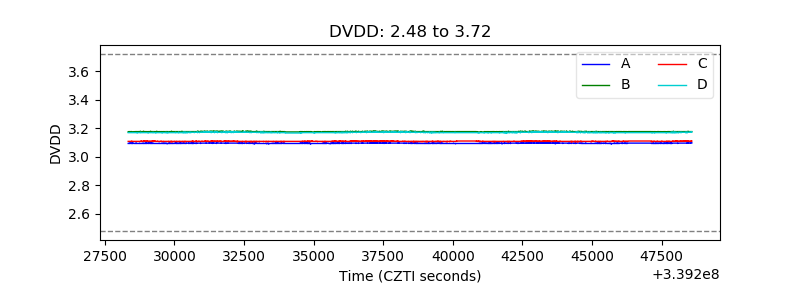 |
| Temperature 1 | 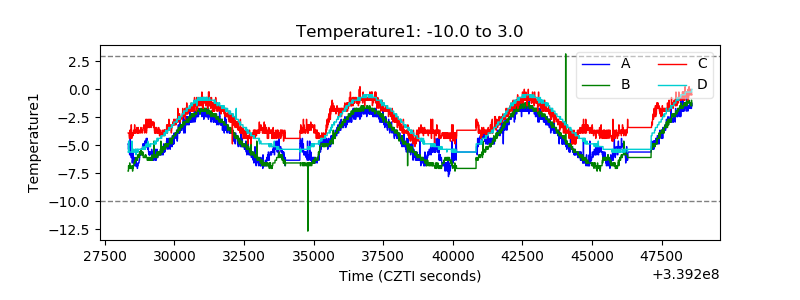 |
| Veto HV Monitor | 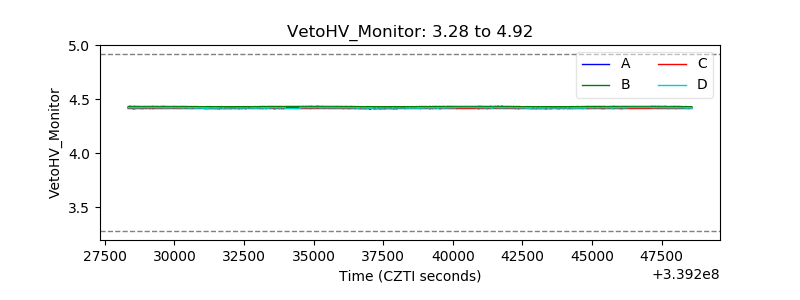 |
| Veto LLD | 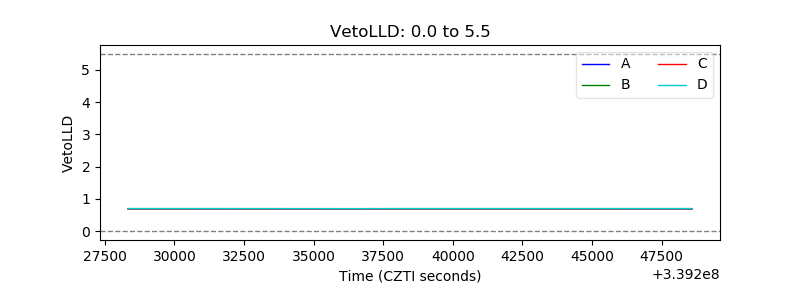 |
| Alpha Counter | 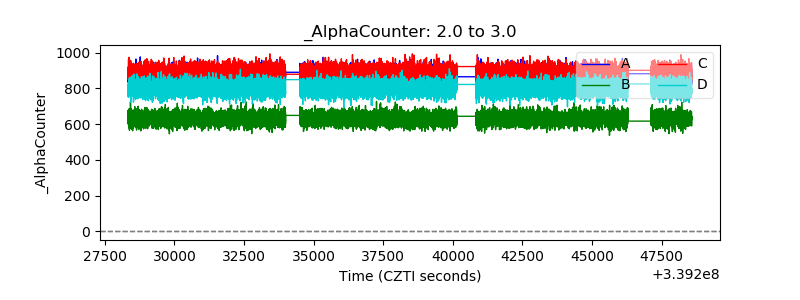 |
| _CPM_Rate | 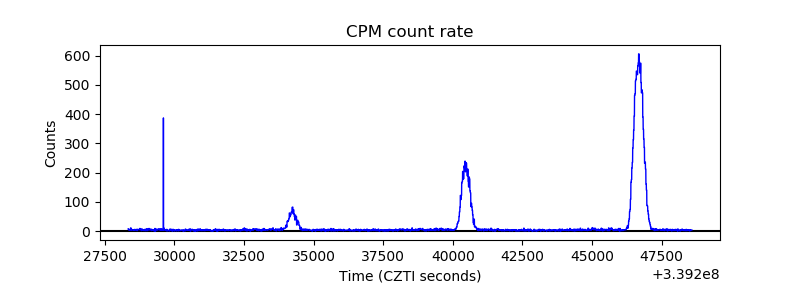 |
| CZT Counter |  |
| +2.5 Volts monitor |  |
| +5 Volts monitor | 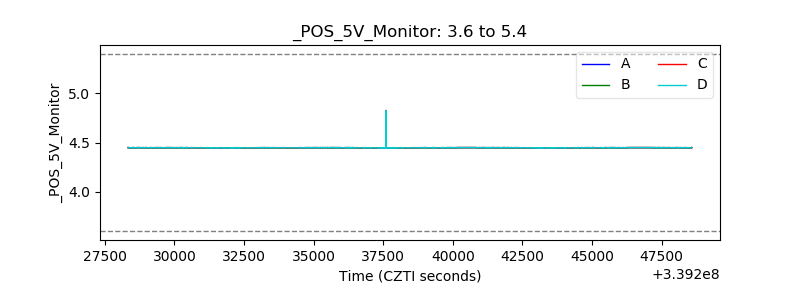 |
| _ROLL_ROT | 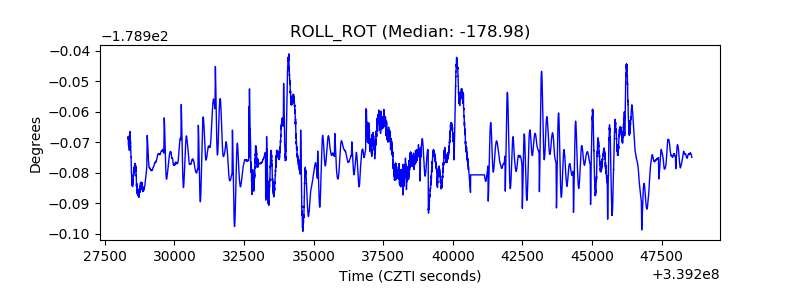 |
| _Roll_DEC | 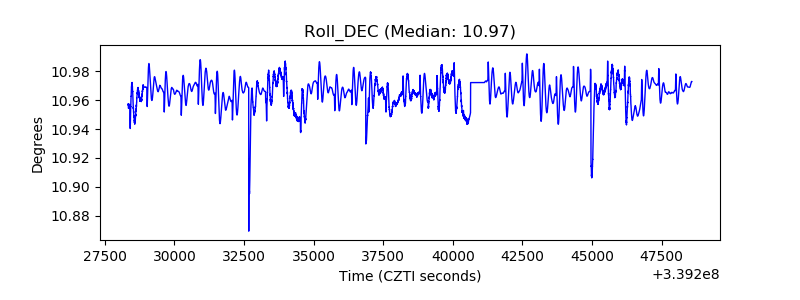 |
| _Roll_RA | 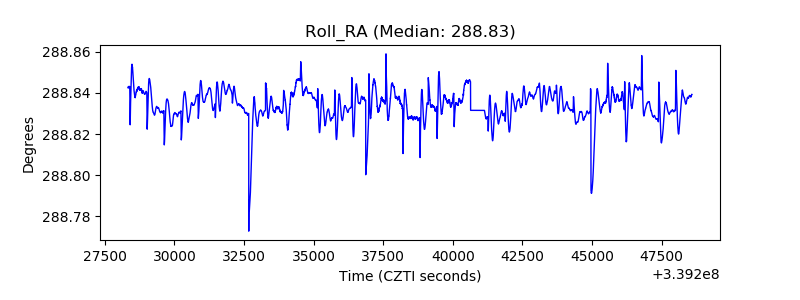 |
| Veto Counter | 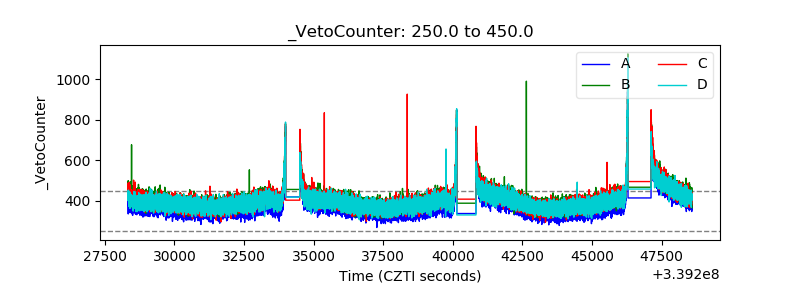 |