| Param | Original file | Final file |
|---|---|---|
| Filename | modeM0/AS1T03_231T01_9000003910_27092cztM0_level2.evt | modeM0/AS1T03_231T01_9000003910_27092cztM0_level2_quad_clean.evt |
| Size (bytes) | 564,433,920 | 101,882,880 |
| Size | 538.3 MB | 97.2 MB |
| Events in quadrant A | 3,819,164 | 683,037 |
| Events in quadrant B | 4,770,887 | 678,863 |
| Events in quadrant C | 3,167,746 | 655,103 |
| Events in quadrant D | 4,898,653 | 617,959 |
| Mode M0 | |||
|---|---|---|---|
| Quadrant | BADHDUFLAG | Total packets | Discarded packets |
| A | 0 | 15587 | 0 |
| B | 0 | 18842 | 0 |
| C | 0 | 13475 | 0 |
| D | 0 | 18723 | 0 |
| Mode M9 | |||
|---|---|---|---|
| Quadrant | BADHDUFLAG | Total packets | Discarded packets |
| A | 0 | 10 | 0 |
| B | 0 | 10 | 0 |
| C | 0 | 10 | 0 |
| D | 0 | 10 | 0 |
| Quadrant | Total seconds | Saturated seconds | Saturation percentage |
|---|---|---|---|
| A | 6462 | 130 | 2.011761% |
| B | 6462 | 194 | 3.002167% |
| C | 6462 | 101 | 1.562984% |
| D | 6463 | 410 | 6.343803% |
Noise dominated data is calculated using 1-second bins in cleaned event files. If a bin has >2000 counts, and if more than 50% of those come from <1% of pixels, then it is considered to be noise-dominated and hence unusable.
| Quadrant | # 1 sec bins | Bins with >0 counts | Bins with >2000 counts | High rate bins dominated by noise | Noise dominated (total time) | Noise dominated (detector-on time) | Marked lightcurve |
|---|---|---|---|---|---|---|---|
| A | 7447 | 6463 | 40 | 40 | 0.54% | 0.62% | 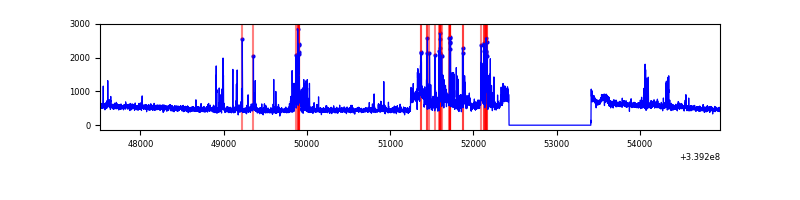 |
| B | 7447 | 6463 | 69 | 69 | 0.93% | 1.07% | 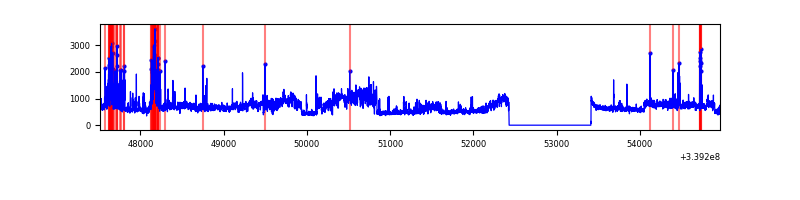 |
| C | 7447 | 6463 | 0 | 0 | 0.00% | 0.00% | 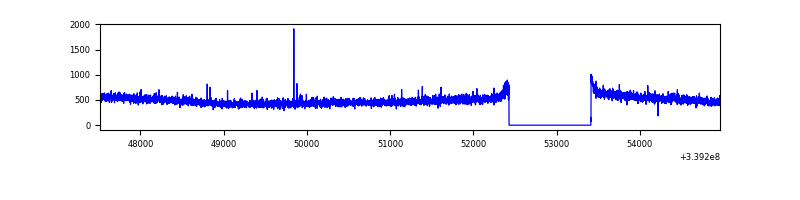 |
| D | 7448 | 6464 | 349 | 349 | 4.69% | 5.40% | 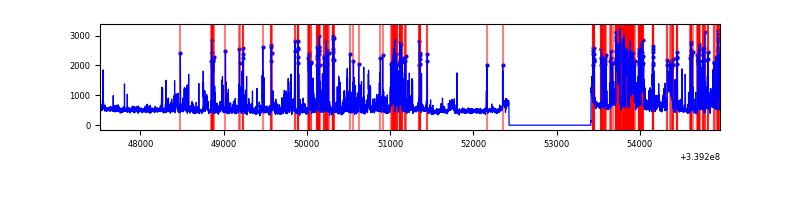 |
Top three noisy pixels from each quadrant. If the there are fewer than three noisy pixels in the level2.evt file, extra rows are filled as -1
| Pixel properties | Quadrant properties | ||||||
|---|---|---|---|---|---|---|---|
| Quadrant | DetID | PixID | Counts | Sigma | Mean | Median | Sigma |
| A | 6 | 16 | 400889 | 2431.71 | 815 | 797 | 164.5 |
| A | 14 | 235 | 247709 | 1500.7 | 815 | 797 | 164.5 |
| A | 12 | 189 | 25705 | 151.39 | 815 | 797 | 164.5 |
| B | 0 | 189 | 1397254 | 9195.41 | 798 | 777 | 151.9 |
| B | 10 | 245 | 170630 | 1118.43 | 798 | 777 | 151.9 |
| B | 3 | 112 | 35683 | 229.85 | 798 | 777 | 151.9 |
| C | 14 | 238 | 125187 | 682.37 | 778 | 782 | 182.3 |
| C | 15 | 208 | 5346 | 25.03 | 778 | 782 | 182.3 |
| C | 13 | 61 | 5303 | 24.8 | 778 | 782 | 182.3 |
| D | 1 | 52 | 1506951 | 8101.47 | 775 | 753 | 185.9 |
| D | 2 | 250 | 209177 | 1121.06 | 775 | 753 | 185.9 |
| D | 11 | 176 | 150573 | 805.85 | 775 | 753 | 185.9 |
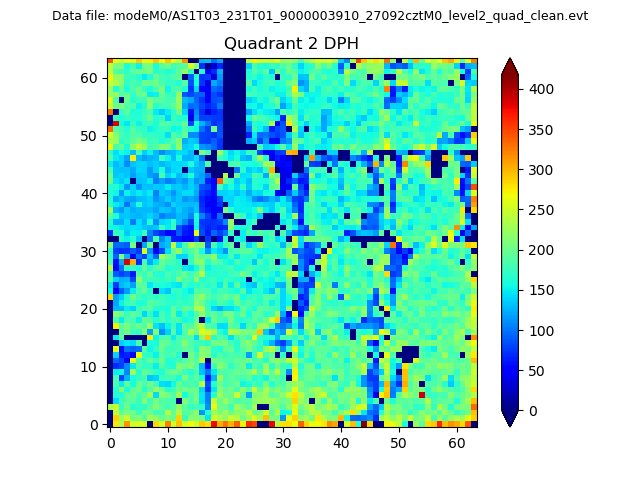
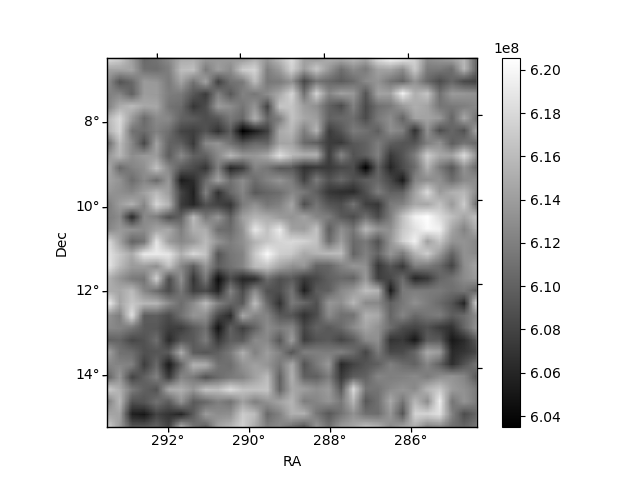
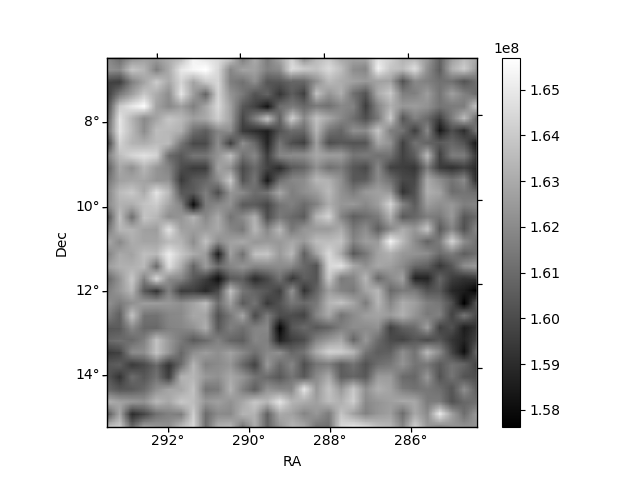
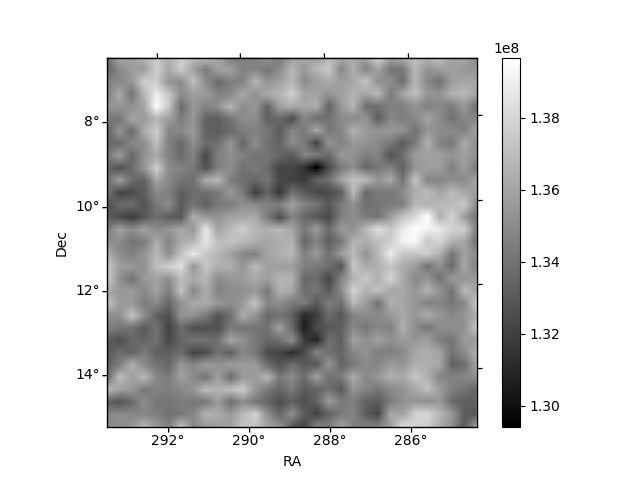
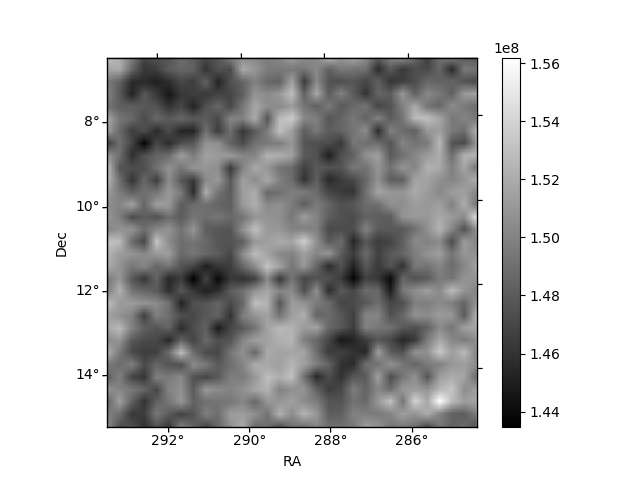
Histogram calculated using DETX and DETY for each event in the final _common_clean file
| Quadrant A | 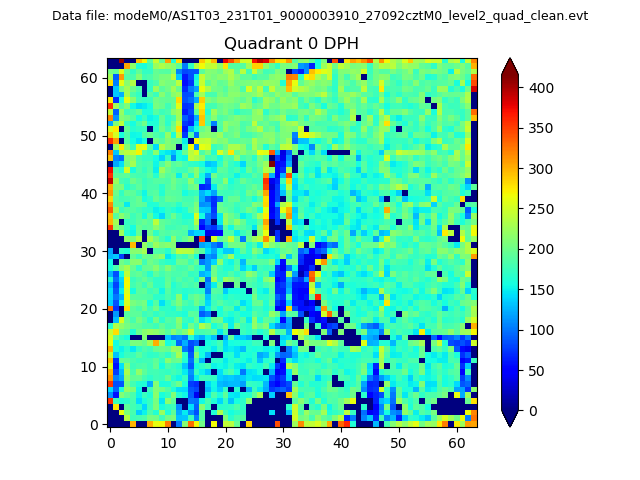 |
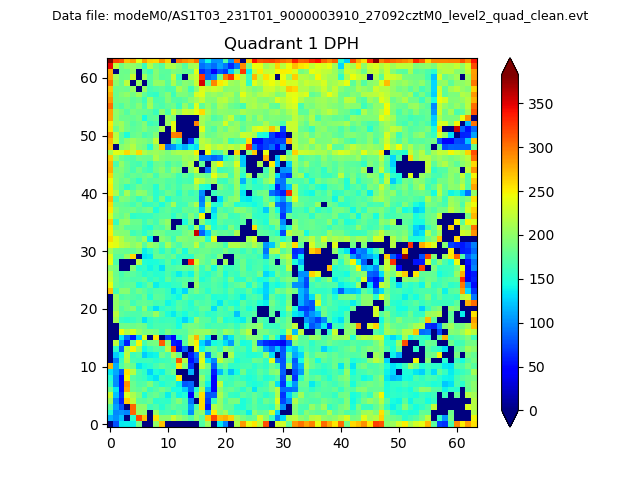 |
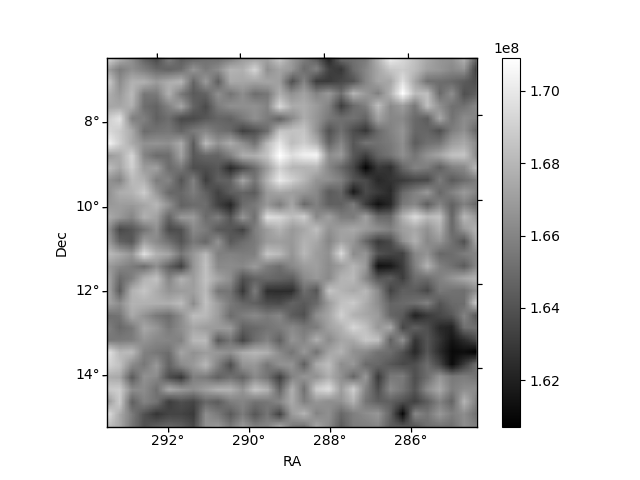
Quadrant B |
|---|---|---|---|
| Quadrant D | 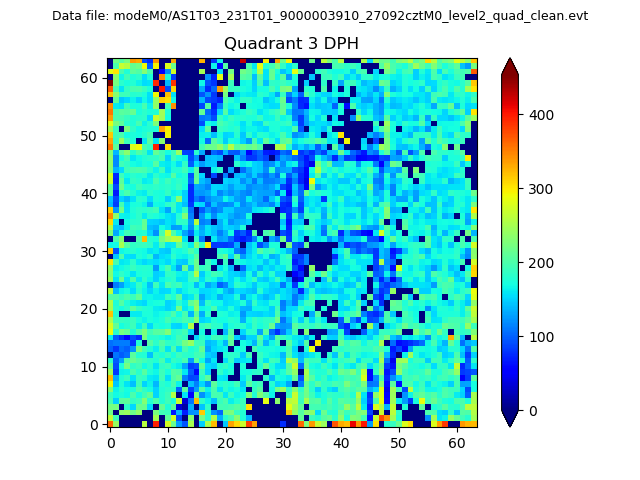 |
 |
Quadrant C |
| Plot type | Count rate plots | Images |
|---|---|---|
| Comparison with Poisson distribution Blue bars denote a histogram of data divided into 1 sec bins. Red curve is a Poisson curve with rate = median count rate of data. |
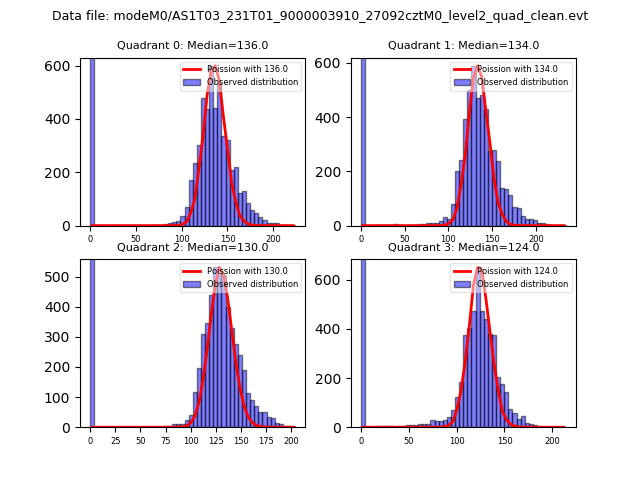 |
 |
| Quadrant-wise count rates Data is divided into 100 sec bins |
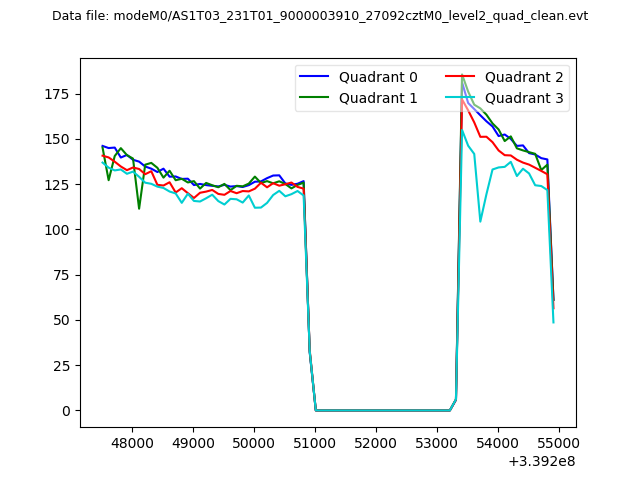 |
|
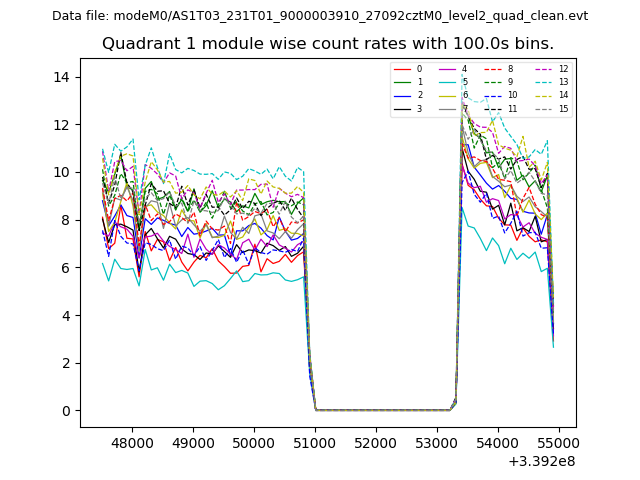
| Module-wise count rates for Quadrant A Data is divided into 100 sec bins |
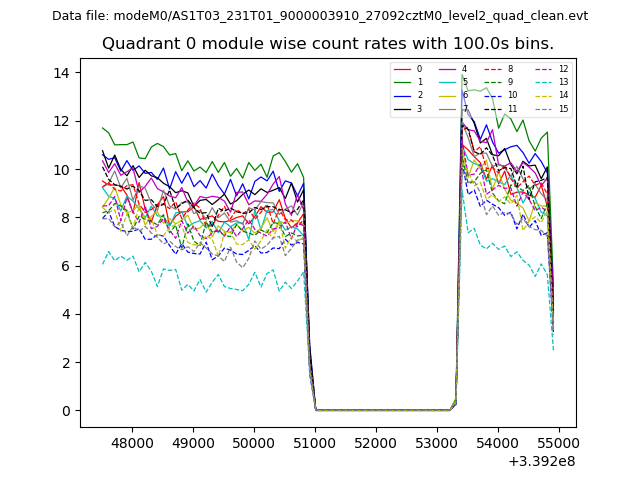 |
 |
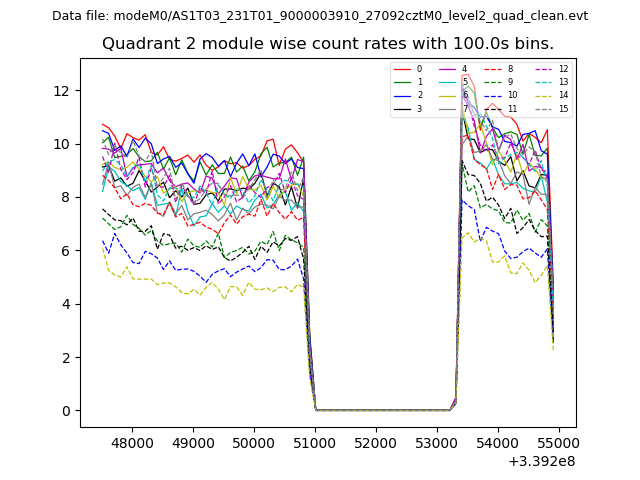
| Module-wise count rates for Quadrant B Data is divided into 100 sec bins |
 |
 |
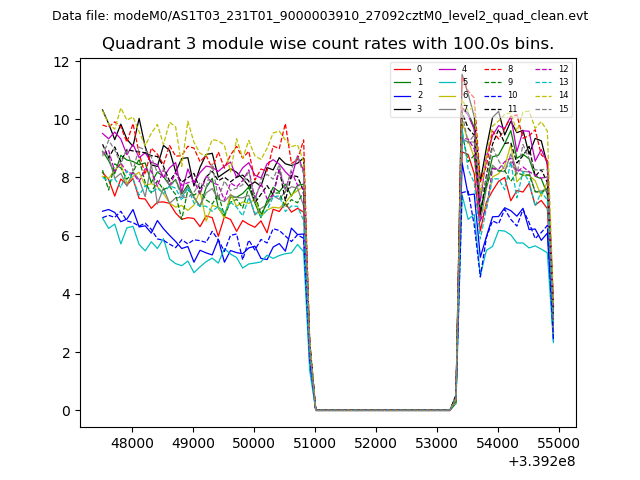
| Module-wise count rates for Quadrant C Data is divided into 100 sec bins |
 |
 |
| Module-wise count rates for Quadrant D Data is divided into 100 sec bins |
 |
 |
| Parameter | Plot |
|---|---|
| CZT HV Monitor | 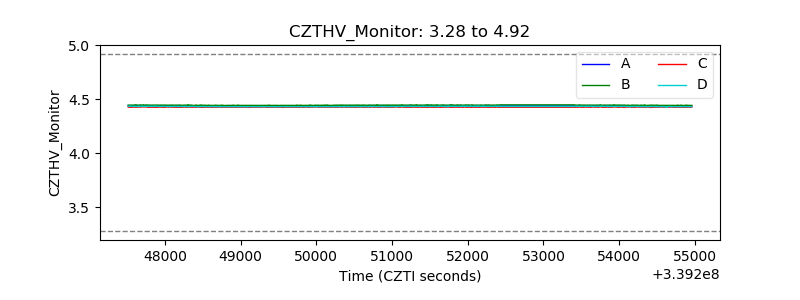 |
| D_VDD | 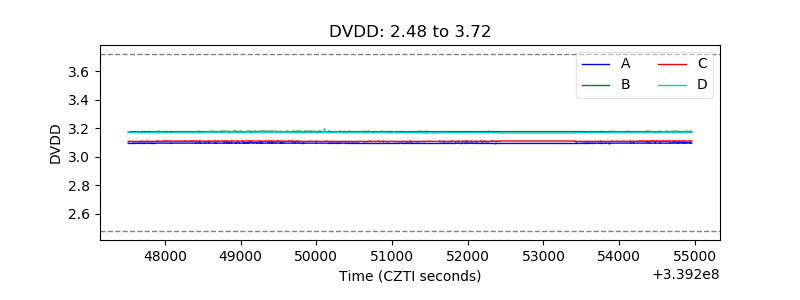 |
| Temperature 1 | 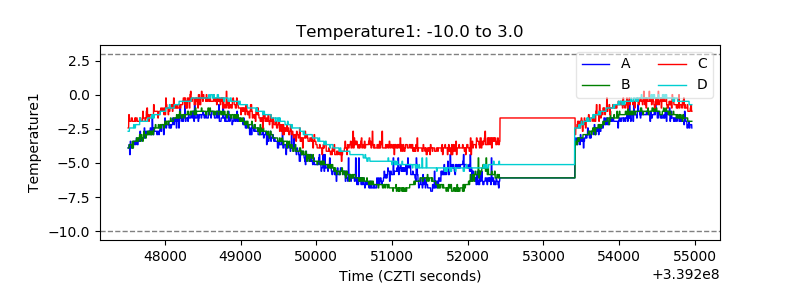 |
| Veto HV Monitor | 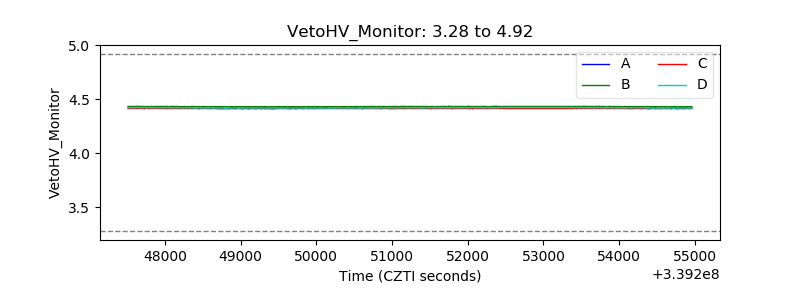 |
| Veto LLD | 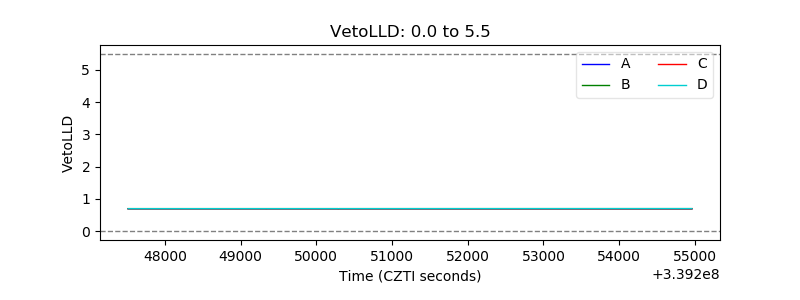 |
| Alpha Counter | 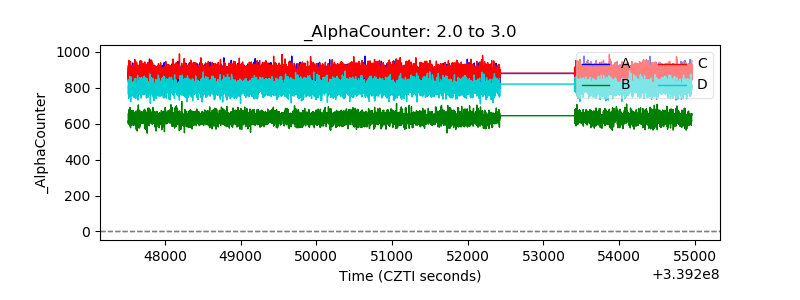 |
| _CPM_Rate | 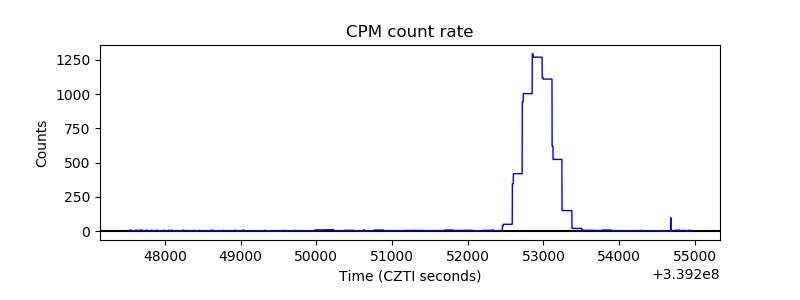 |
| CZT Counter | 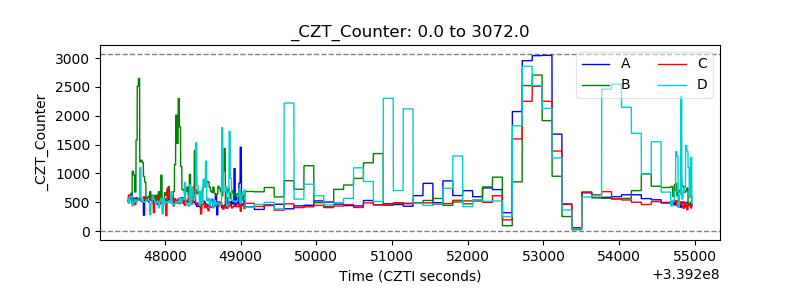 |
| +2.5 Volts monitor |  |
| +5 Volts monitor |  |
| _ROLL_ROT | 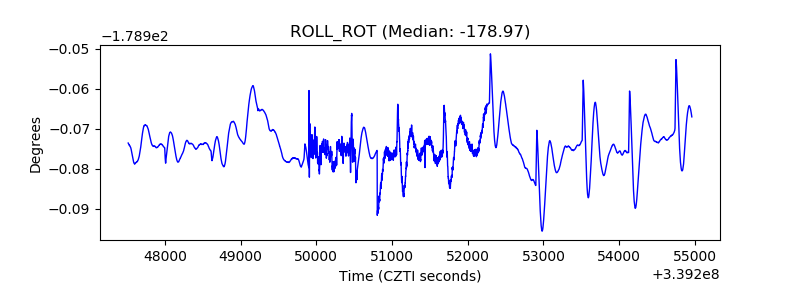 |
| _Roll_DEC | 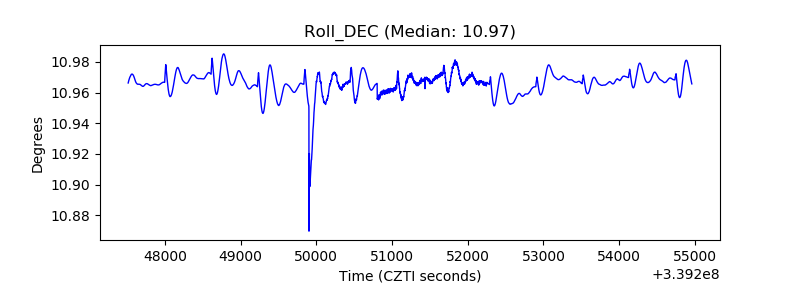 |
| _Roll_RA | 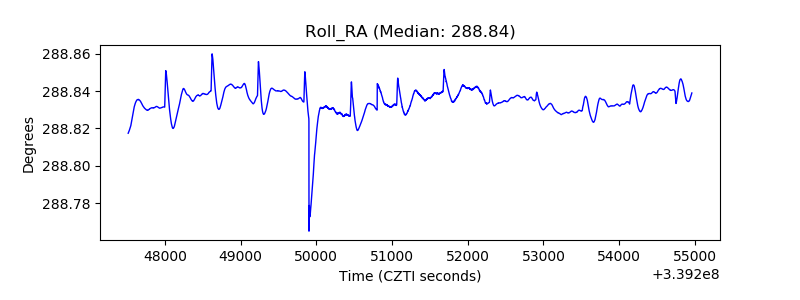 |
| Veto Counter | 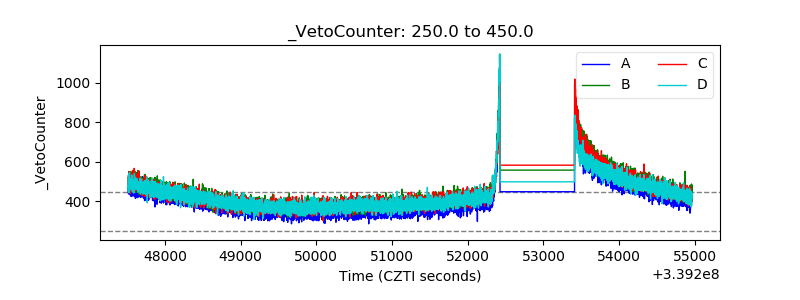 |