| Param | Original file | Final file |
|---|---|---|
| Filename | modeM0/AS1T03_231T01_9000003910_27094cztM0_level2.evt | modeM0/AS1T03_231T01_9000003910_27094cztM0_level2_quad_clean.evt |
| Size (bytes) | 561,326,400 | 92,635,200 |
| Size | 535.3 MB | 88.3 MB |
| Events in quadrant A | 3,671,049 | 622,074 |
| Events in quadrant B | 4,772,906 | 619,185 |
| Events in quadrant C | 3,014,758 | 592,065 |
| Events in quadrant D | 5,133,312 | 551,269 |
| Mode M0 | |||
|---|---|---|---|
| Quadrant | BADHDUFLAG | Total packets | Discarded packets |
| A | 0 | 14870 | 0 |
| B | 0 | 18409 | 0 |
| C | 0 | 12766 | 0 |
| D | 0 | 19376 | 0 |
| Mode M9 | |||
|---|---|---|---|
| Quadrant | BADHDUFLAG | Total packets | Discarded packets |
| A | 0 | 12 | 0 |
| B | 0 | 12 | 0 |
| C | 0 | 12 | 0 |
| D | 0 | 12 | 0 |
| Quadrant | Total seconds | Saturated seconds | Saturation percentage |
|---|---|---|---|
| A | 6031 | 199 | 3.299619% |
| B | 6031 | 169 | 2.802189% |
| C | 6032 | 91 | 1.508621% |
| D | 6032 | 491 | 8.139920% |
Noise dominated data is calculated using 1-second bins in cleaned event files. If a bin has >2000 counts, and if more than 50% of those come from <1% of pixels, then it is considered to be noise-dominated and hence unusable.
| Quadrant | # 1 sec bins | Bins with >0 counts | Bins with >2000 counts | High rate bins dominated by noise | Noise dominated (total time) | Noise dominated (detector-on time) | Marked lightcurve |
|---|---|---|---|---|---|---|---|
| A | 7176 | 6032 | 79 | 79 | 1.10% | 1.31% | 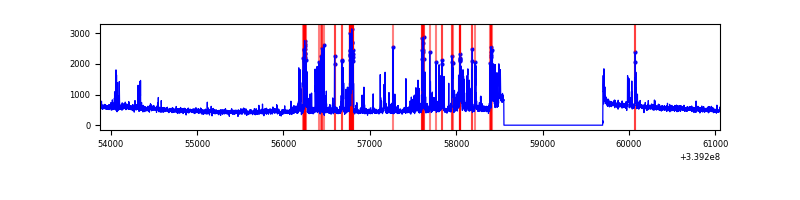 |
| B | 7176 | 6032 | 59 | 59 | 0.82% | 0.98% | 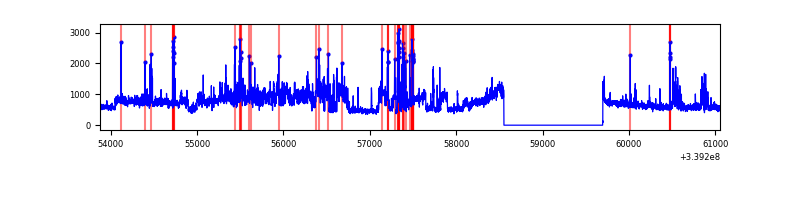 |
| C | 7177 | 6033 | 0 | 0 | 0.00% | 0.00% | 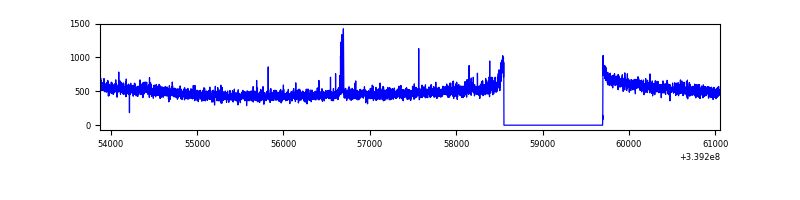 |
| D | 7177 | 6033 | 463 | 463 | 6.45% | 7.67% | 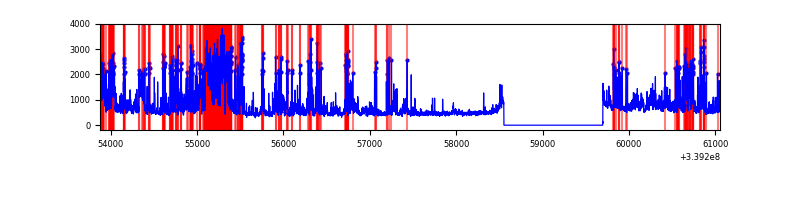 |
Top three noisy pixels from each quadrant. If the there are fewer than three noisy pixels in the level2.evt file, extra rows are filled as -1
| Pixel properties | Quadrant properties | ||||||
|---|---|---|---|---|---|---|---|
| Quadrant | DetID | PixID | Counts | Sigma | Mean | Median | Sigma |
| A | 14 | 235 | 636892 | 4120.1 | 770 | 758 | 154.4 |
| A | 6 | 16 | 46306 | 295.0 | 770 | 758 | 154.4 |
| A | 12 | 189 | 15693 | 96.73 | 770 | 758 | 154.4 |
| B | 0 | 189 | 1281506 | 8856.67 | 760 | 742 | 144.6 |
| B | 10 | 245 | 308433 | 2127.73 | 760 | 742 | 144.6 |
| B | 3 | 112 | 85360 | 585.15 | 760 | 742 | 144.6 |
| C | 14 | 238 | 121137 | 700.24 | 734 | 739 | 171.9 |
| C | 2 | 16 | 21487 | 120.67 | 734 | 739 | 171.9 |
| C | 15 | 208 | 9515 | 51.04 | 734 | 739 | 171.9 |
| D | 1 | 52 | 1930947 | 11080.02 | 728 | 709 | 174.2 |
| D | 2 | 250 | 140585 | 802.92 | 728 | 709 | 174.2 |
| D | 7 | 38 | 136001 | 776.61 | 728 | 709 | 174.2 |
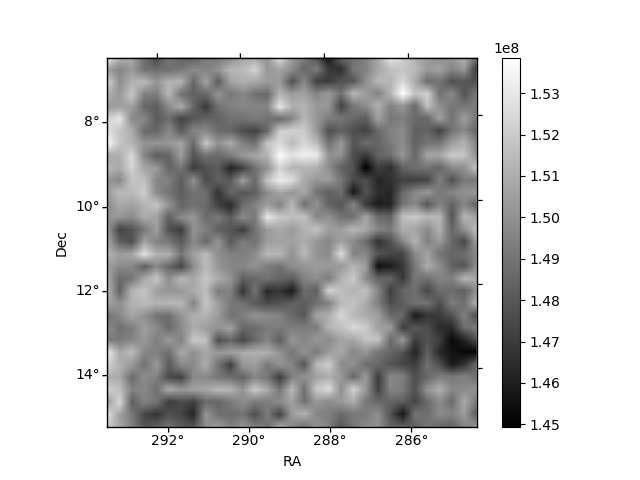
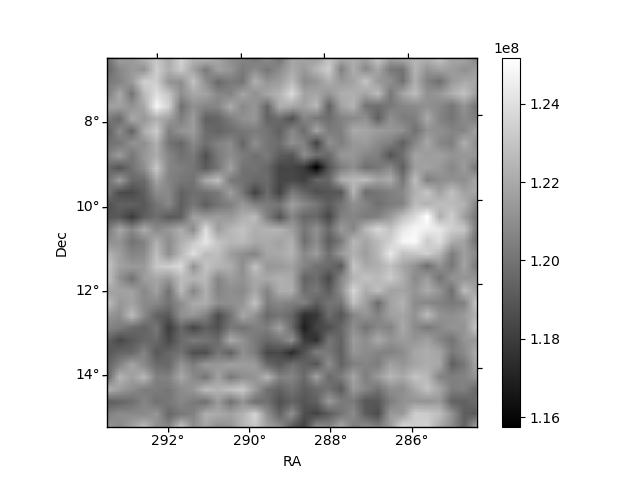
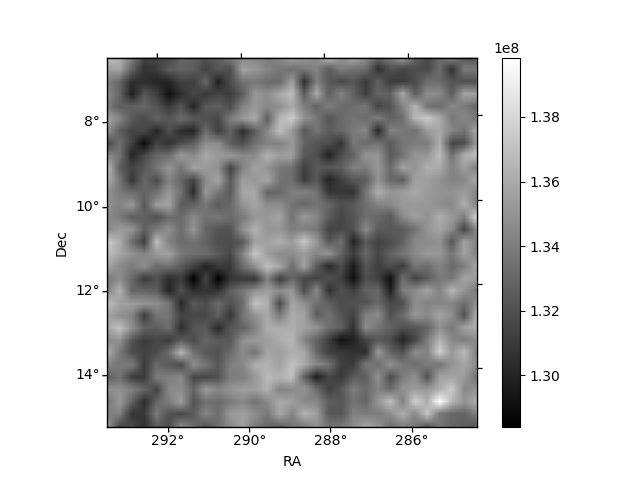
Histogram calculated using DETX and DETY for each event in the final _common_clean file
| Quadrant A | 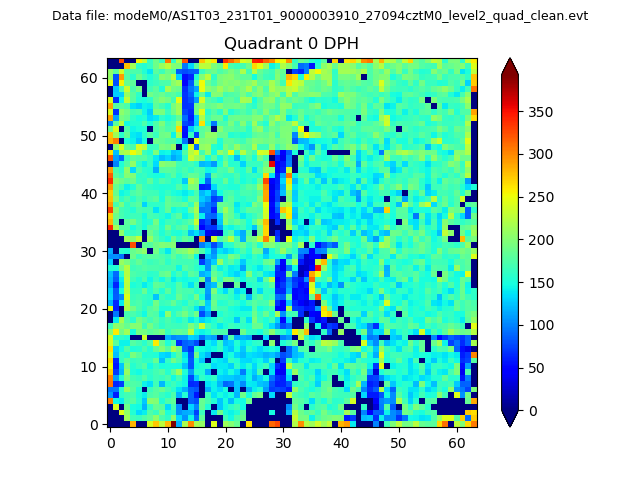 |
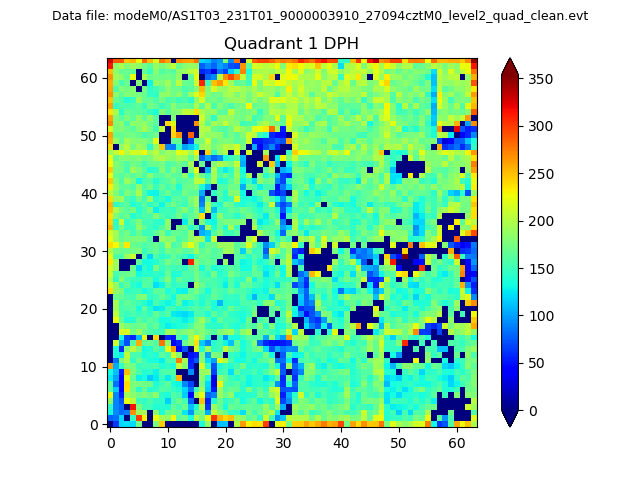 |
Quadrant B |
|---|---|---|---|
| Quadrant D | 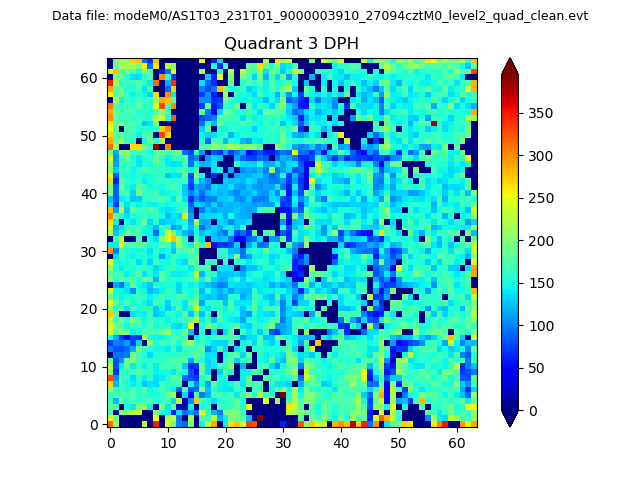 |
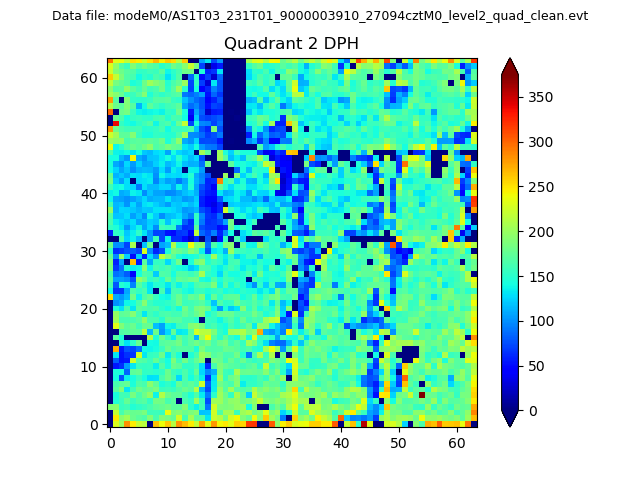 |
Quadrant C |
| Plot type | Count rate plots | Images |
|---|---|---|
| Comparison with Poisson distribution Blue bars denote a histogram of data divided into 1 sec bins. Red curve is a Poisson curve with rate = median count rate of data. |
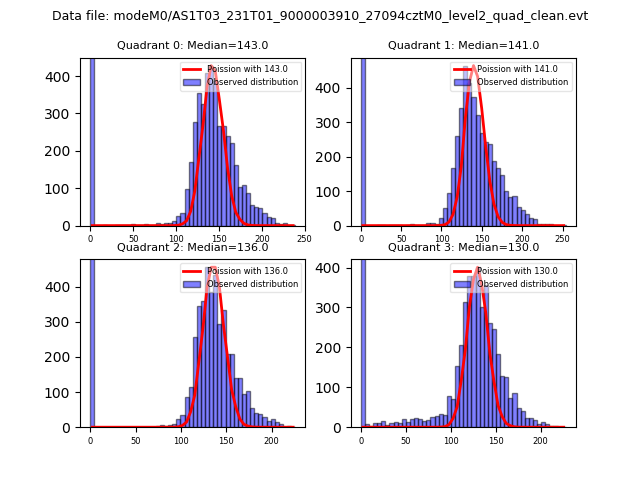 |
 |
| Quadrant-wise count rates Data is divided into 100 sec bins |
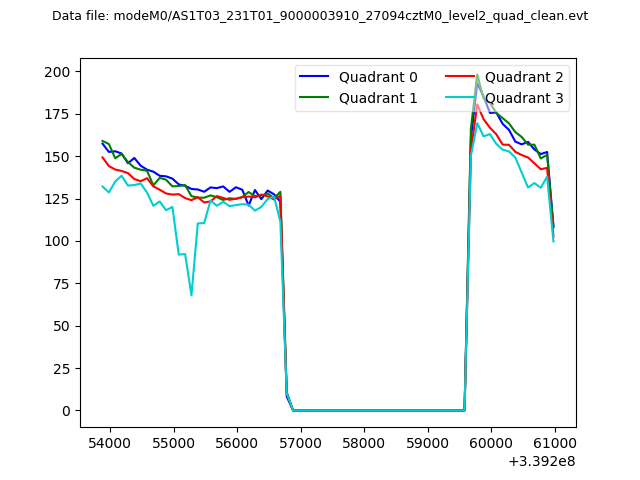 |
|
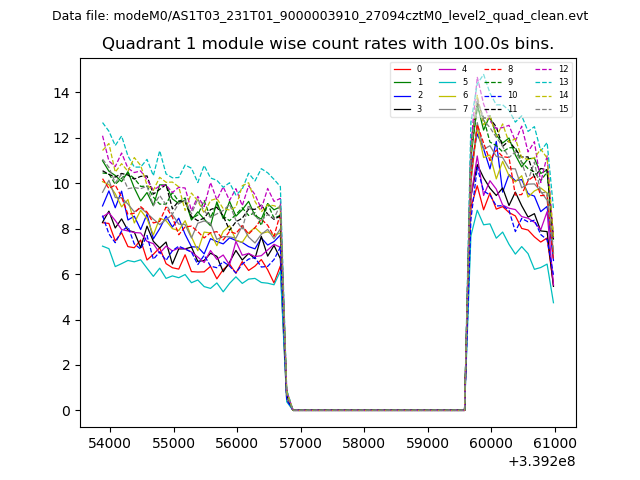
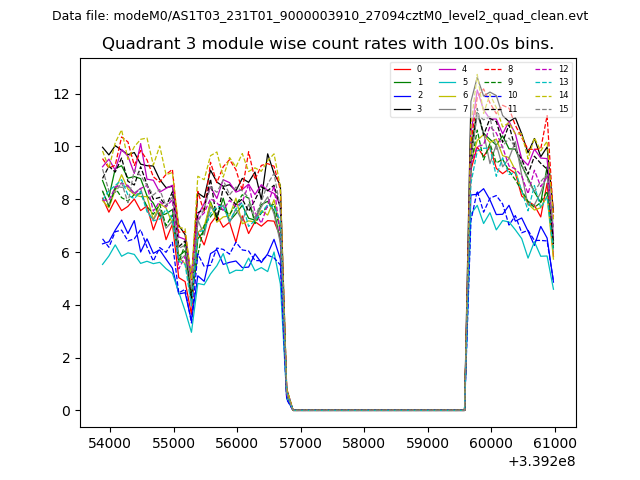
| Module-wise count rates for Quadrant A Data is divided into 100 sec bins |
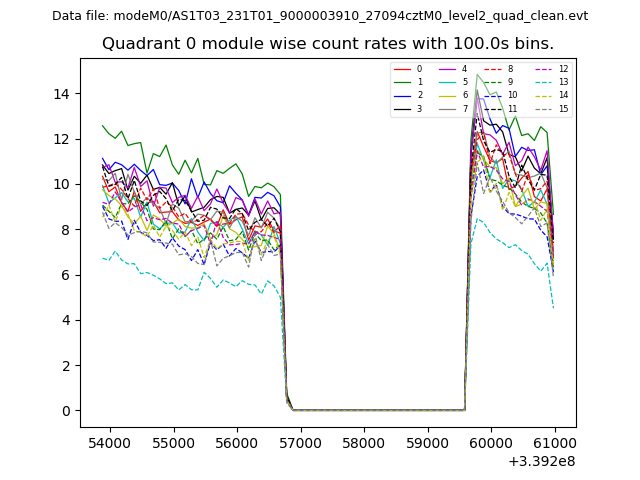 |
 |
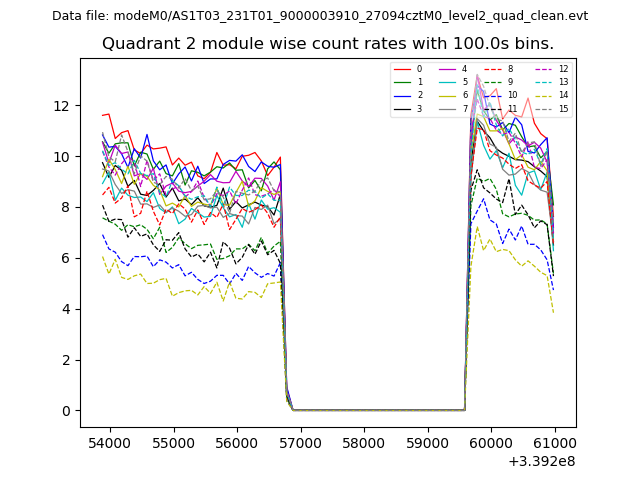
| Module-wise count rates for Quadrant B Data is divided into 100 sec bins |
 |
 |
| Module-wise count rates for Quadrant C Data is divided into 100 sec bins |
 |
 |
| Module-wise count rates for Quadrant D Data is divided into 100 sec bins |
 |
 |
| Parameter | Plot |
|---|---|
| CZT HV Monitor | 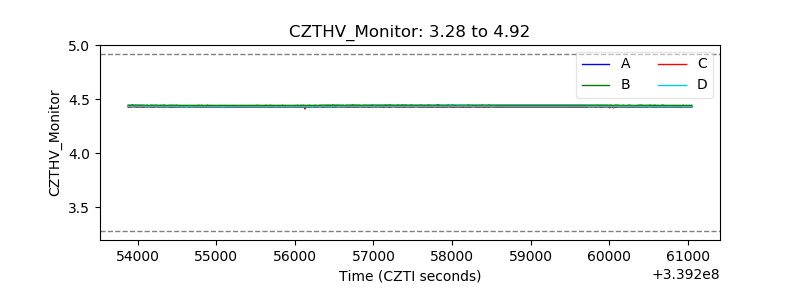 |
| D_VDD |  |
| Temperature 1 | 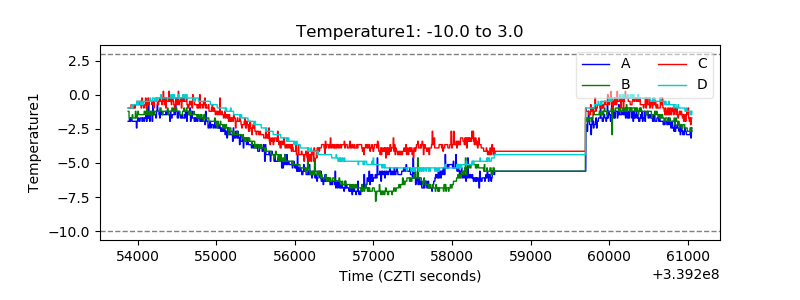 |
| Veto HV Monitor |  |
| Veto LLD | 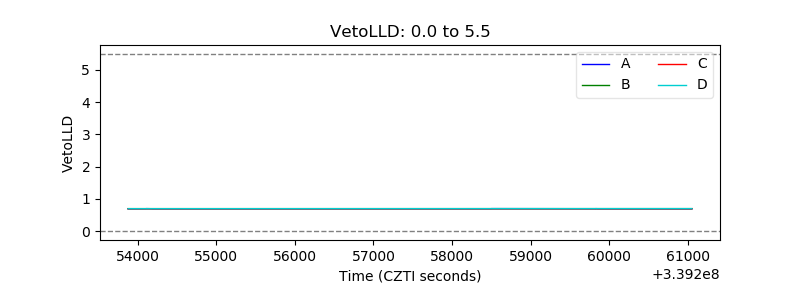 |
| Alpha Counter | 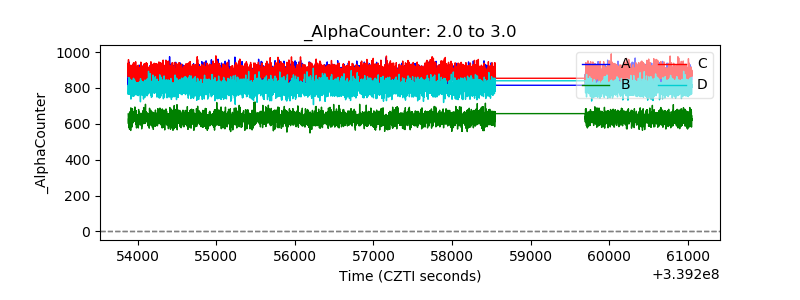 |
| _CPM_Rate |  |
| CZT Counter | 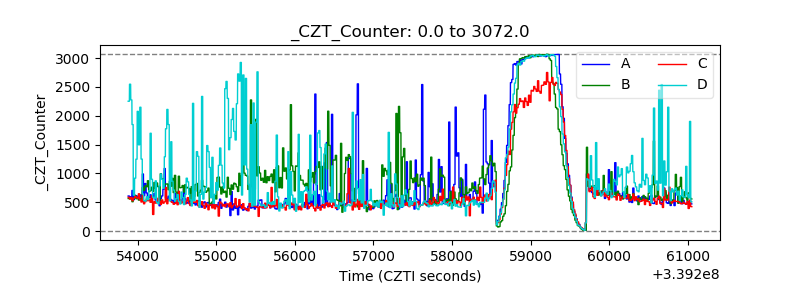 |
| +2.5 Volts monitor |  |
| +5 Volts monitor |  |
| _ROLL_ROT | 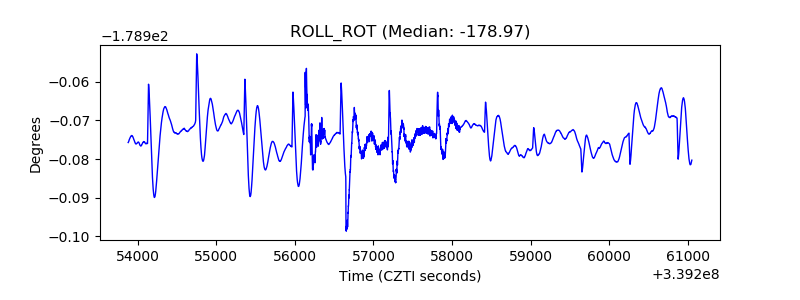 |
| _Roll_DEC | 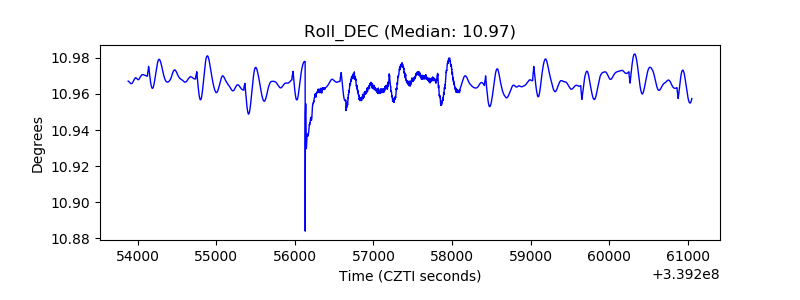 |
| _Roll_RA |  |
| Veto Counter | 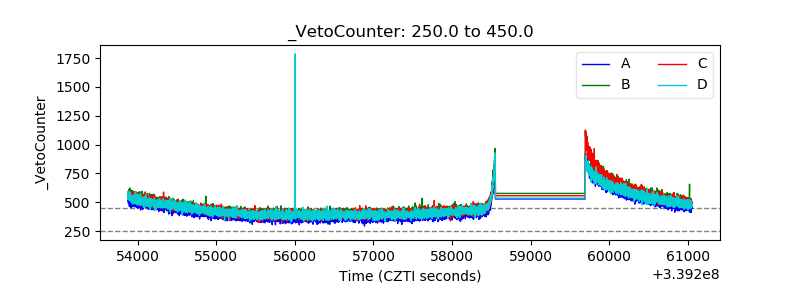 |