| Param | Original file | Final file |
|---|---|---|
| Filename | modeM0/AS1T03_231T01_9000003910_27095cztM0_level2.evt | modeM0/AS1T03_231T01_9000003910_27095cztM0_level2_quad_clean.evt |
| Size (bytes) | 533,378,880 | 100,920,960 |
| Size | 508.7 MB | 96.2 MB |
| Events in quadrant A | 3,512,570 | 676,612 |
| Events in quadrant B | 3,748,698 | 685,393 |
| Events in quadrant C | 3,335,271 | 641,743 |
| Events in quadrant D | 5,127,620 | 610,429 |
| Mode M0 | |||
|---|---|---|---|
| Quadrant | BADHDUFLAG | Total packets | Discarded packets |
| A | 0 | 14563 | 0 |
| B | 0 | 15279 | 0 |
| C | 0 | 13843 | 0 |
| D | 0 | 19617 | 0 |
| Mode M9 | |||
|---|---|---|---|
| Quadrant | BADHDUFLAG | Total packets | Discarded packets |
| A | 0 | 14 | 0 |
| B | 0 | 15 | 0 |
| C | 0 | 15 | 0 |
| D | 0 | 15 | 0 |
| Quadrant | Total seconds | Saturated seconds | Saturation percentage |
|---|---|---|---|
| A | 6339 | 81 | 1.277804% |
| B | 6339 | 79 | 1.246253% |
| C | 6339 | 101 | 1.593311% |
| D | 6339 | 342 | 5.395173% |
Noise dominated data is calculated using 1-second bins in cleaned event files. If a bin has >2000 counts, and if more than 50% of those come from <1% of pixels, then it is considered to be noise-dominated and hence unusable.
| Quadrant | # 1 sec bins | Bins with >0 counts | Bins with >2000 counts | High rate bins dominated by noise | Noise dominated (total time) | Noise dominated (detector-on time) | Marked lightcurve |
|---|---|---|---|---|---|---|---|
| A | 7574 | 6340 | 9 | 9 | 0.12% | 0.14% |  |
| B | 7574 | 6340 | 9 | 9 | 0.12% | 0.14% | 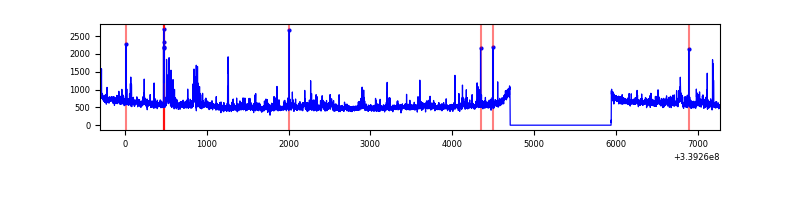 |
| C | 7574 | 6340 | 7 | 7 | 0.09% | 0.11% | 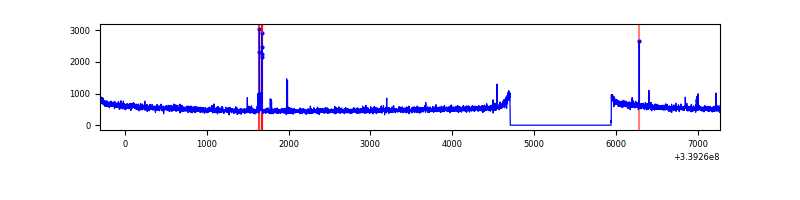 |
| D | 7574 | 6340 | 182 | 182 | 2.40% | 2.87% | 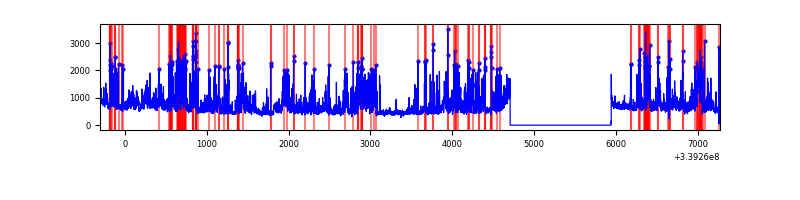 |
Top three noisy pixels from each quadrant. If the there are fewer than three noisy pixels in the level2.evt file, extra rows are filled as -1
| Pixel properties | Quadrant properties | ||||||
|---|---|---|---|---|---|---|---|
| Quadrant | DetID | PixID | Counts | Sigma | Mean | Median | Sigma |
| A | 14 | 235 | 181455 | 1073.75 | 851 | 837 | 168.2 |
| A | 13 | 248 | 27875 | 160.74 | 851 | 837 | 168.2 |
| A | 12 | 189 | 19237 | 109.39 | 851 | 837 | 168.2 |
| B | 3 | 112 | 138993 | 876.1 | 845 | 826 | 157.7 |
| B | 10 | 245 | 124522 | 784.34 | 845 | 826 | 157.7 |
| B | 3 | 64 | 59169 | 369.95 | 845 | 826 | 157.7 |
| C | 14 | 238 | 133034 | 704.89 | 807 | 812 | 187.6 |
| C | 15 | 208 | 27640 | 143.02 | 807 | 812 | 187.6 |
| C | 2 | 16 | 9678 | 47.27 | 807 | 812 | 187.6 |
| D | 1 | 52 | 1668384 | 8753.01 | 803 | 783 | 190.5 |
| D | 2 | 250 | 157082 | 820.39 | 803 | 783 | 190.5 |
| D | 7 | 38 | 132408 | 690.88 | 803 | 783 | 190.5 |
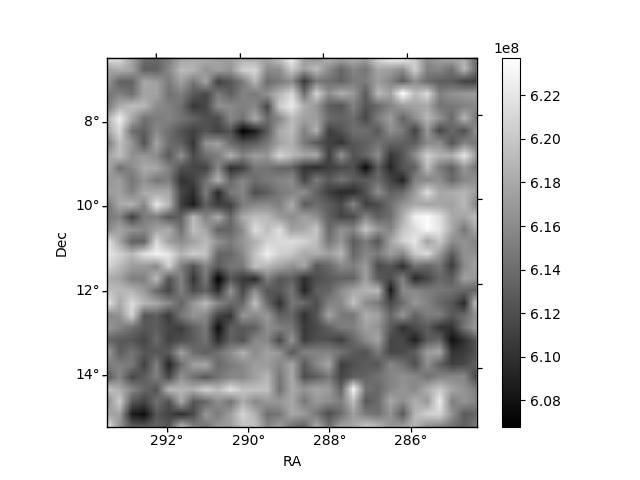
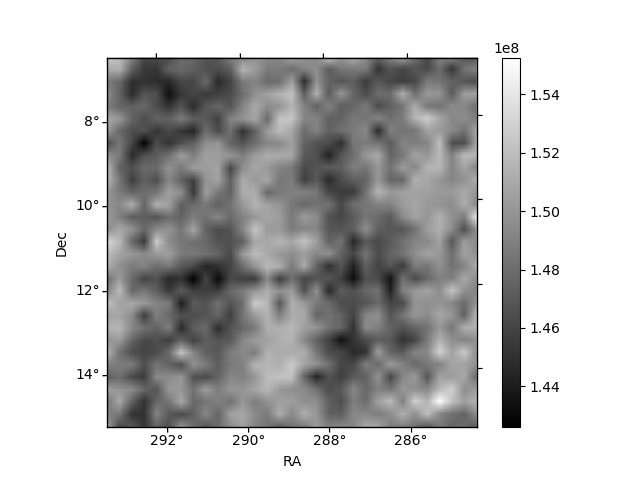
Histogram calculated using DETX and DETY for each event in the final _common_clean file
| Quadrant A |  |
 |
Quadrant B |
|---|---|---|---|
| Quadrant D | 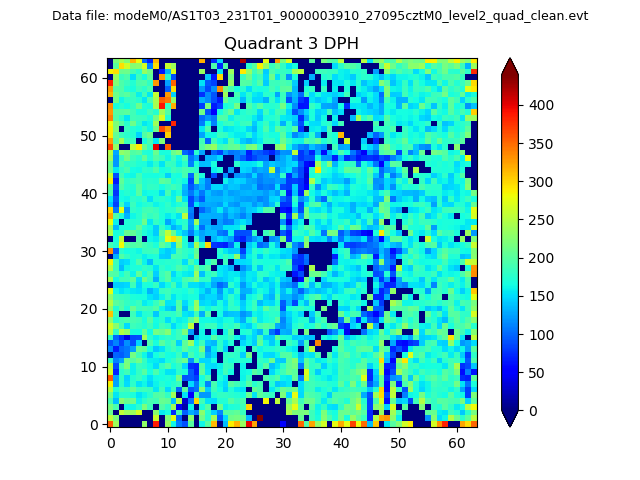 |
 |
Quadrant C |
| Plot type | Count rate plots | Images |
|---|---|---|
| Comparison with Poisson distribution Blue bars denote a histogram of data divided into 1 sec bins. Red curve is a Poisson curve with rate = median count rate of data. |
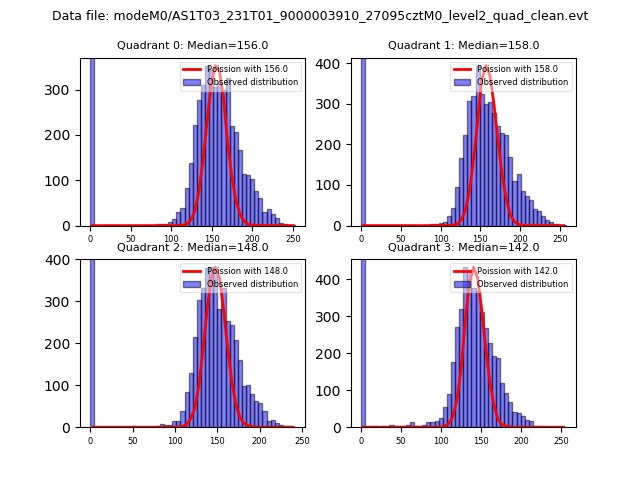 |
 |
| Quadrant-wise count rates Data is divided into 100 sec bins |
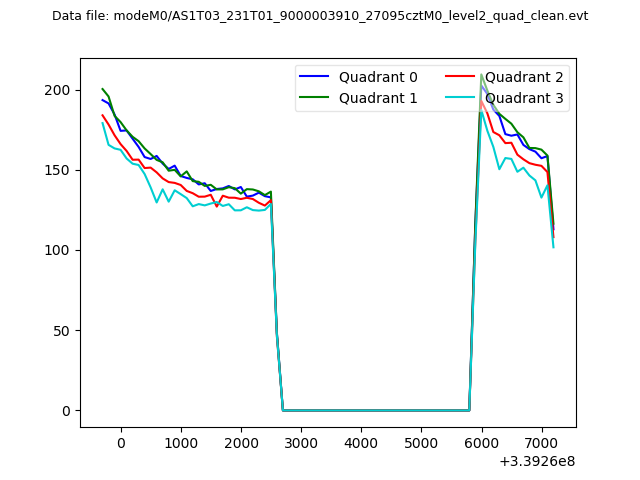 |
|
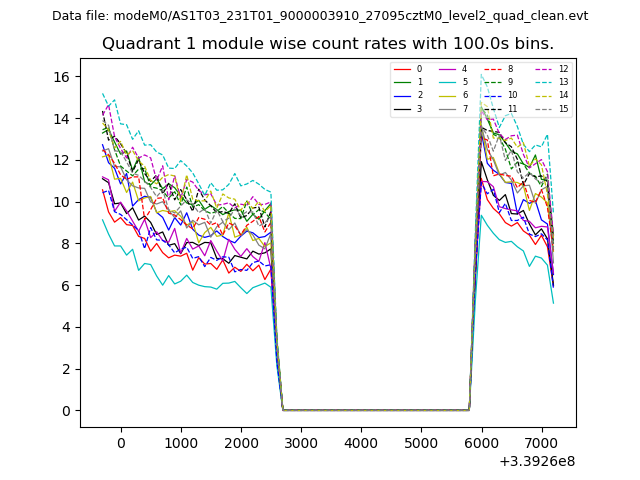
| Module-wise count rates for Quadrant A Data is divided into 100 sec bins |
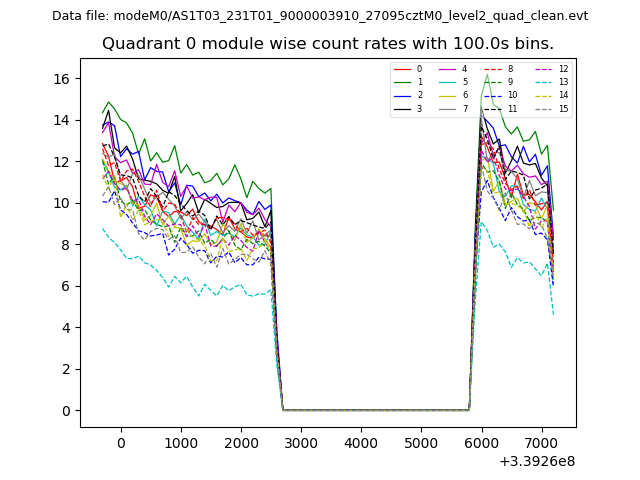 |
 |
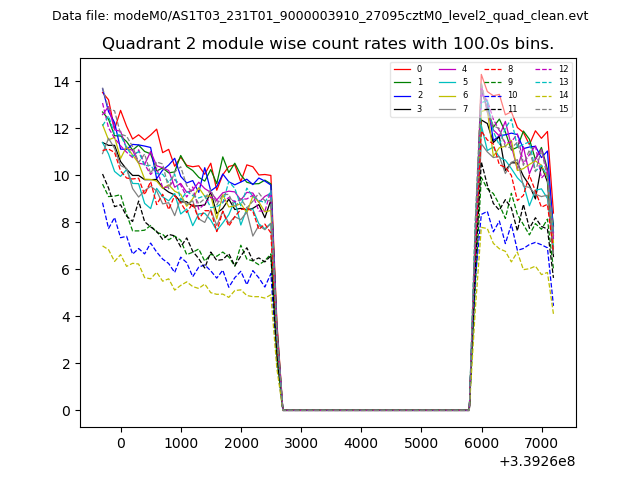
| Module-wise count rates for Quadrant B Data is divided into 100 sec bins |
 |
 |
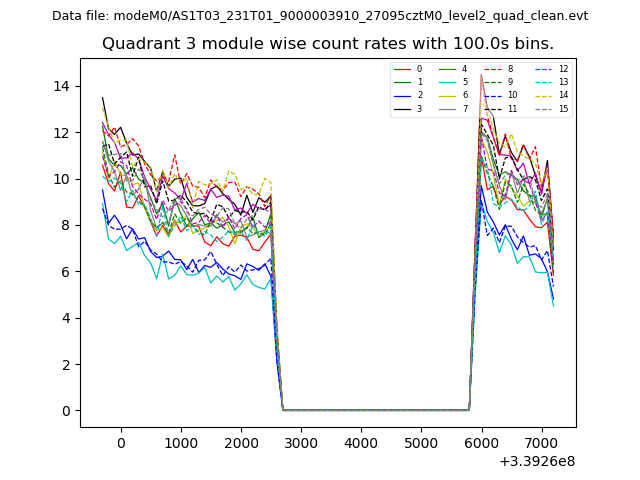
| Module-wise count rates for Quadrant C Data is divided into 100 sec bins |
 |
 |
| Module-wise count rates for Quadrant D Data is divided into 100 sec bins |
 |
 |
| Parameter | Plot |
|---|---|
| CZT HV Monitor | 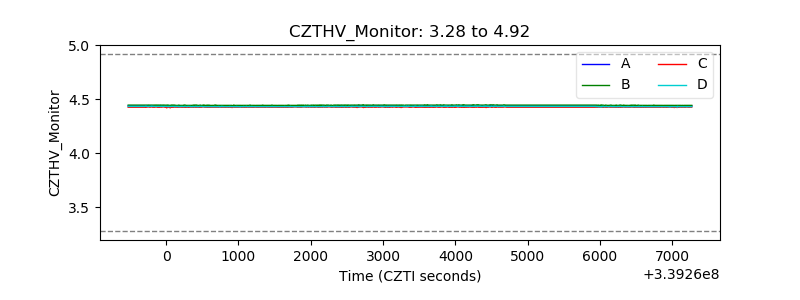 |
| D_VDD | 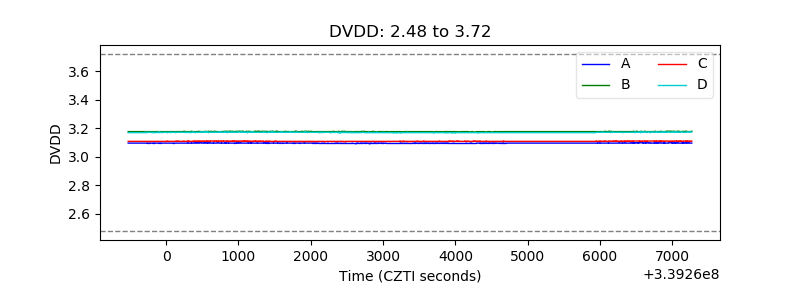 |
| Temperature 1 | 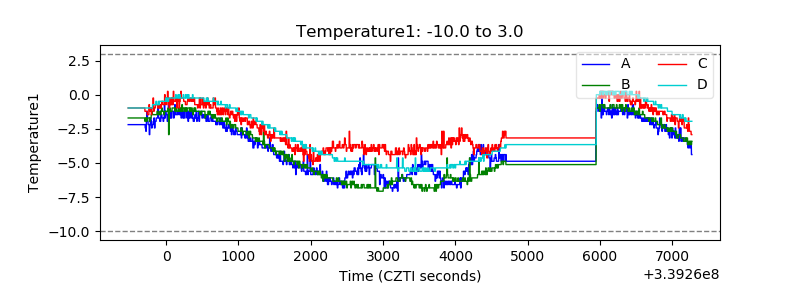 |
| Veto HV Monitor | 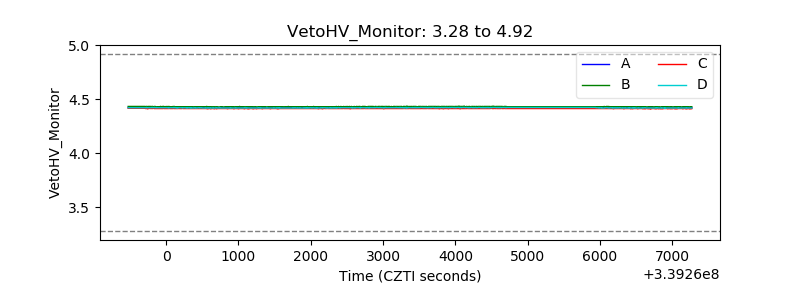 |
| Veto LLD | 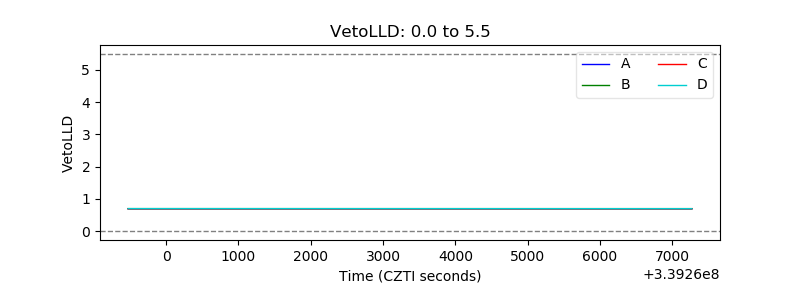 |
| Alpha Counter | 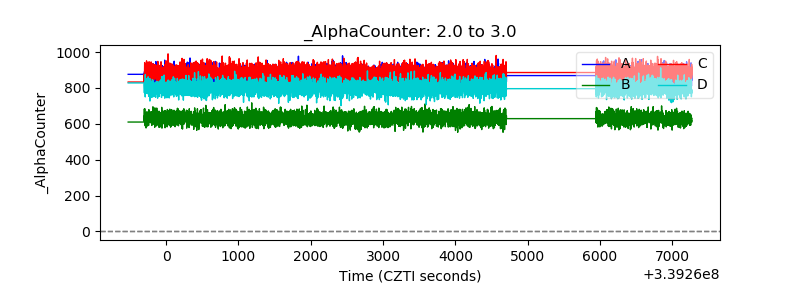 |
| _CPM_Rate | 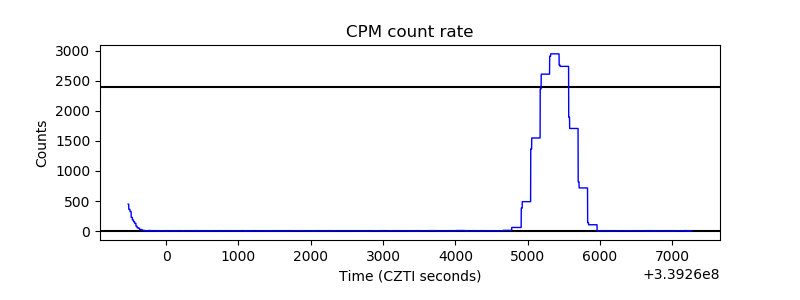 |
| CZT Counter |  |
| +2.5 Volts monitor |  |
| +5 Volts monitor |  |
| _ROLL_ROT | 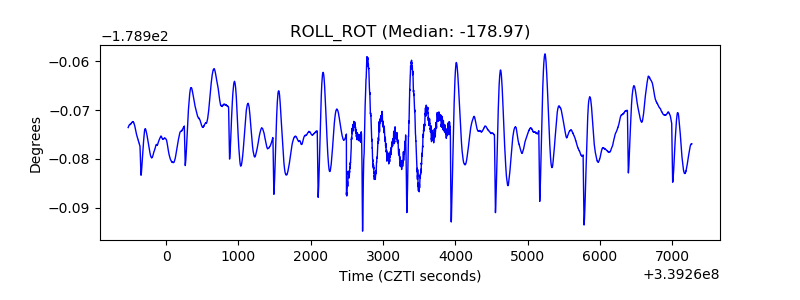 |
| _Roll_DEC | 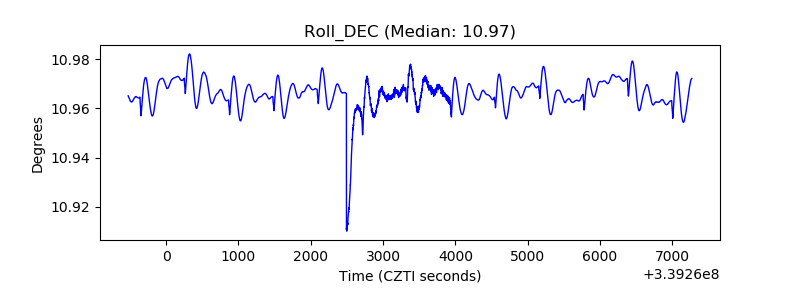 |
| _Roll_RA | 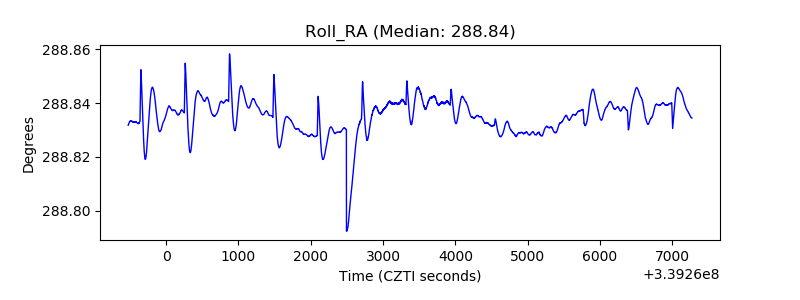 |
| Veto Counter | 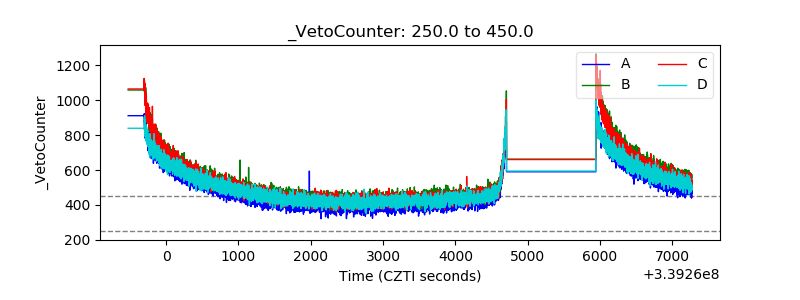 |