| Param | Original file | Final file |
|---|---|---|
| Filename | modeM0/AS1T03_231T01_9000003910_27096cztM0_level2.evt | modeM0/AS1T03_231T01_9000003910_27096cztM0_level2_quad_clean.evt |
| Size (bytes) | 584,136,000 | 96,664,320 |
| Size | 557.1 MB | 92.2 MB |
| Events in quadrant A | 4,025,729 | 647,348 |
| Events in quadrant B | 4,387,090 | 658,348 |
| Events in quadrant C | 3,331,212 | 618,231 |
| Events in quadrant D | 5,524,469 | 568,020 |
| Mode M0 | |||
|---|---|---|---|
| Quadrant | BADHDUFLAG | Total packets | Discarded packets |
| A | 0 | 16031 | 0 |
| B | 0 | 17303 | 0 |
| C | 0 | 13660 | 0 |
| D | 0 | 20716 | 0 |
| Mode M9 | |||
|---|---|---|---|
| Quadrant | BADHDUFLAG | Total packets | Discarded packets |
| A | 0 | 13 | 0 |
| B | 0 | 13 | 0 |
| C | 0 | 13 | 0 |
| D | 0 | 13 | 0 |
| Quadrant | Total seconds | Saturated seconds | Saturation percentage |
|---|---|---|---|
| A | 6233 | 216 | 3.465426% |
| B | 6233 | 123 | 1.973368% |
| C | 6233 | 91 | 1.459971% |
| D | 6234 | 485 | 7.779917% |
Noise dominated data is calculated using 1-second bins in cleaned event files. If a bin has >2000 counts, and if more than 50% of those come from <1% of pixels, then it is considered to be noise-dominated and hence unusable.
| Quadrant | # 1 sec bins | Bins with >0 counts | Bins with >2000 counts | High rate bins dominated by noise | Noise dominated (total time) | Noise dominated (detector-on time) | Marked lightcurve |
|---|---|---|---|---|---|---|---|
| A | 7548 | 6234 | 108 | 108 | 1.43% | 1.73% | 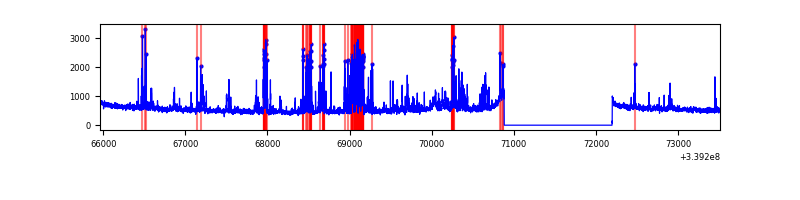 |
| B | 7548 | 6234 | 26 | 26 | 0.34% | 0.42% | 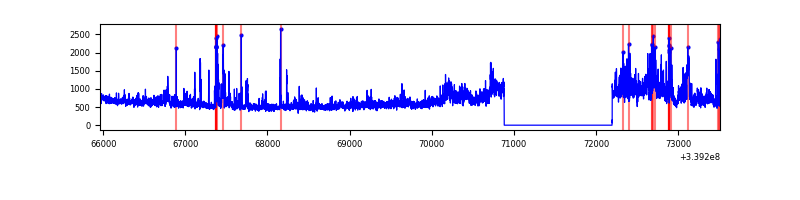 |
| C | 7548 | 6234 | 1 | 1 | 0.01% | 0.02% | 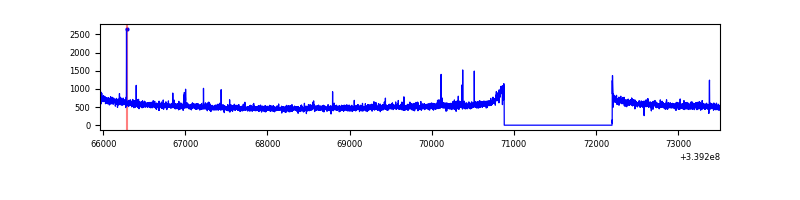 |
| D | 7549 | 6235 | 412 | 412 | 5.46% | 6.61% | 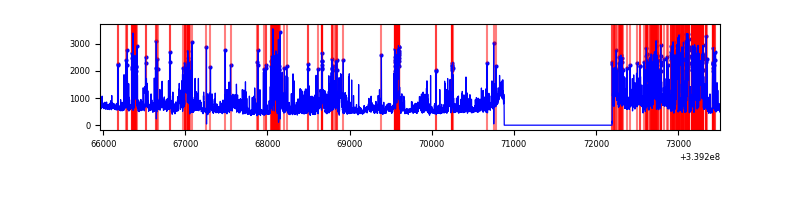 |
Top three noisy pixels from each quadrant. If the there are fewer than three noisy pixels in the level2.evt file, extra rows are filled as -1
| Pixel properties | Quadrant properties | ||||||
|---|---|---|---|---|---|---|---|
| Quadrant | DetID | PixID | Counts | Sigma | Mean | Median | Sigma |
| A | 14 | 235 | 652103 | 3921.29 | 838 | 824 | 166.1 |
| A | 6 | 16 | 61354 | 364.45 | 838 | 824 | 166.1 |
| A | 13 | 248 | 34391 | 202.1 | 838 | 824 | 166.1 |
| B | 3 | 112 | 773340 | 4933.22 | 842 | 822 | 156.6 |
| B | 10 | 246 | 139745 | 887.15 | 842 | 822 | 156.6 |
| B | 10 | 245 | 72996 | 460.9 | 842 | 822 | 156.6 |
| C | 14 | 238 | 132619 | 701.81 | 807 | 815 | 187.8 |
| C | 15 | 208 | 15669 | 79.09 | 807 | 815 | 187.8 |
| C | 3 | 233 | 11480 | 56.79 | 807 | 815 | 187.8 |
| D | 1 | 52 | 1868162 | 10011.88 | 789 | 769 | 186.5 |
| D | 2 | 250 | 431968 | 2311.84 | 789 | 769 | 186.5 |
| D | 7 | 38 | 117790 | 627.4 | 789 | 769 | 186.5 |
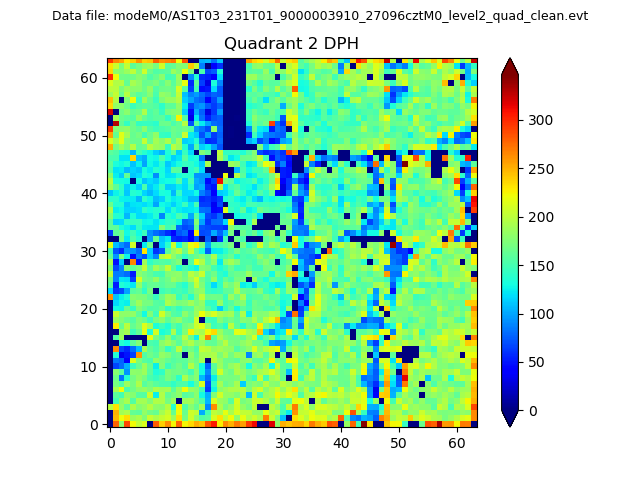
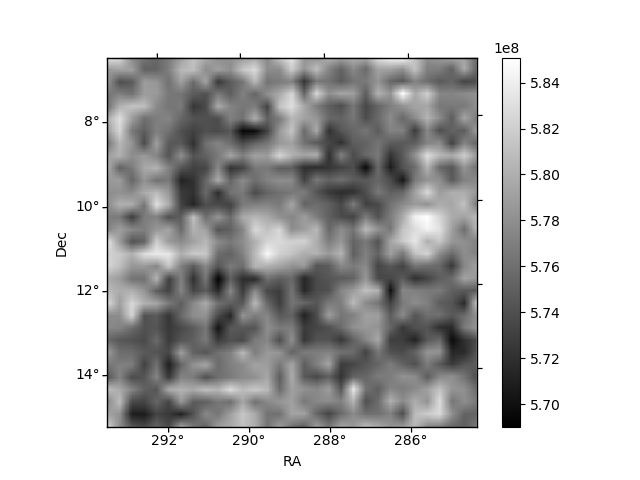
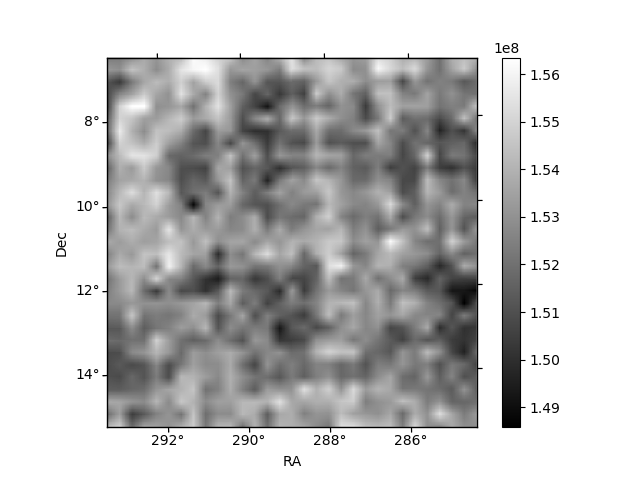
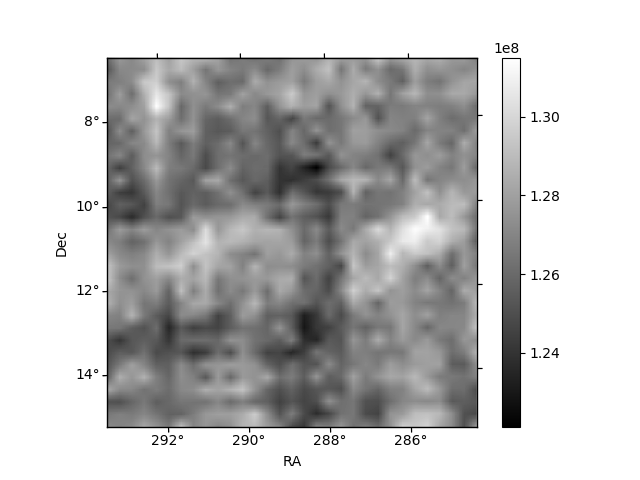
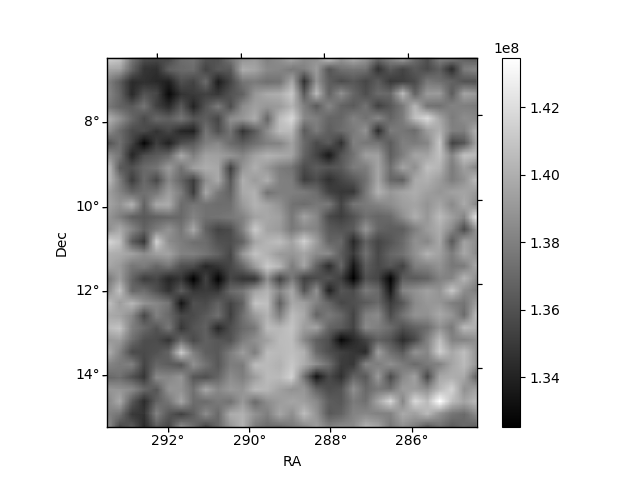
Histogram calculated using DETX and DETY for each event in the final _common_clean file
| Quadrant A | 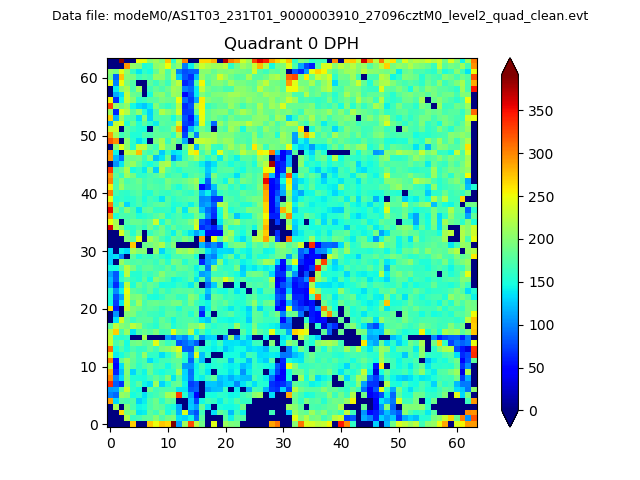 |
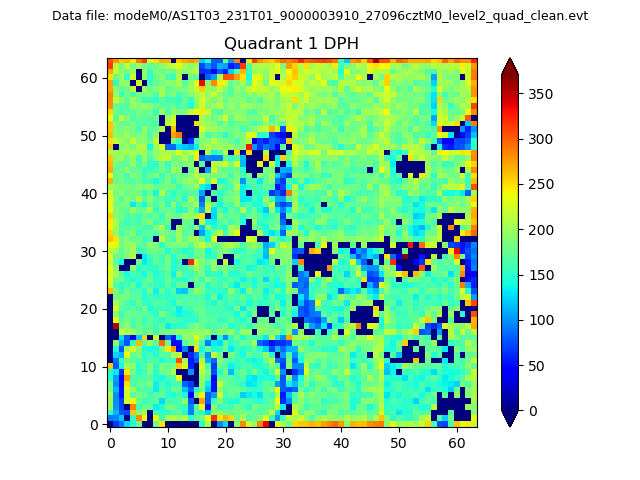 |
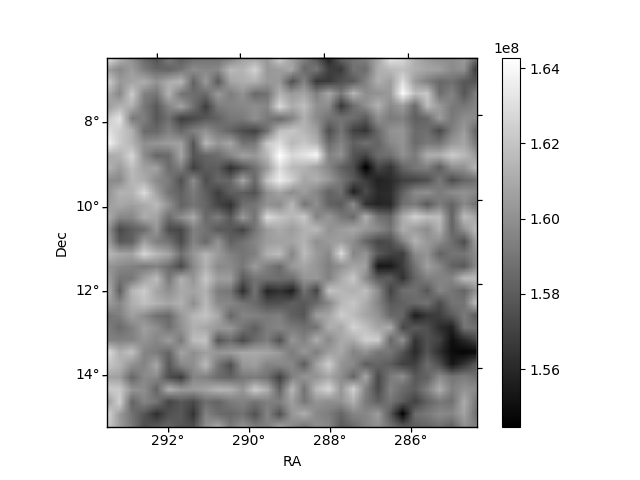
Quadrant B |
|---|---|---|---|
| Quadrant D | 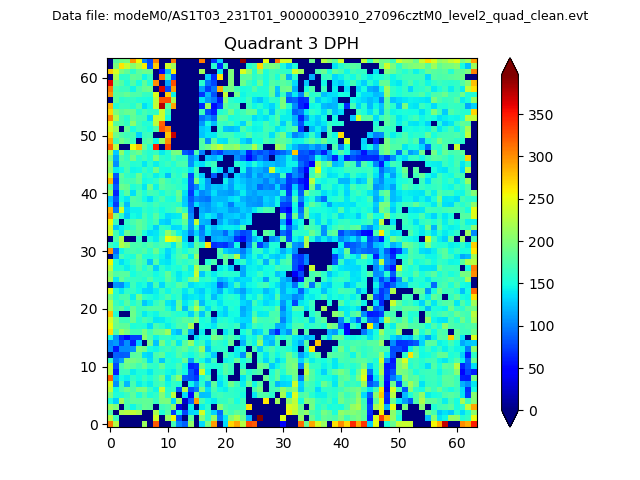 |
 |
Quadrant C |
| Plot type | Count rate plots | Images |
|---|---|---|
| Comparison with Poisson distribution Blue bars denote a histogram of data divided into 1 sec bins. Red curve is a Poisson curve with rate = median count rate of data. |
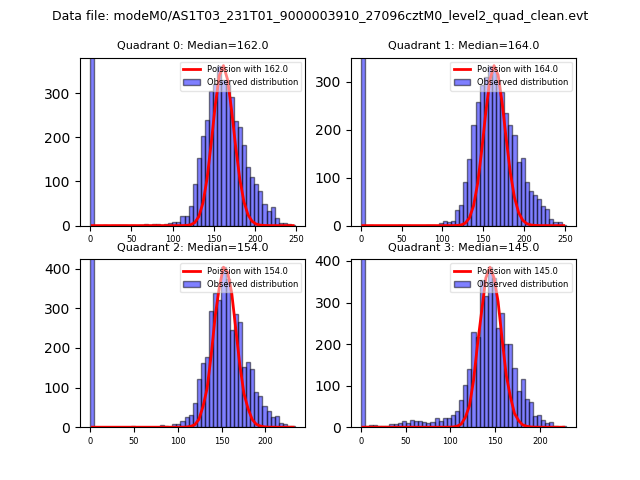 |
 |
| Quadrant-wise count rates Data is divided into 100 sec bins |
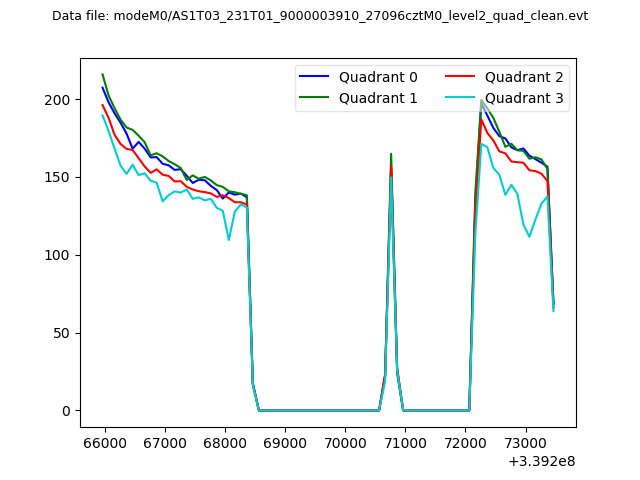 |
|
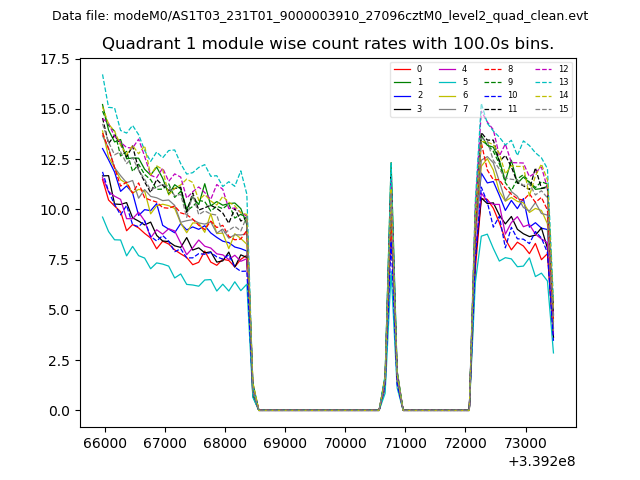
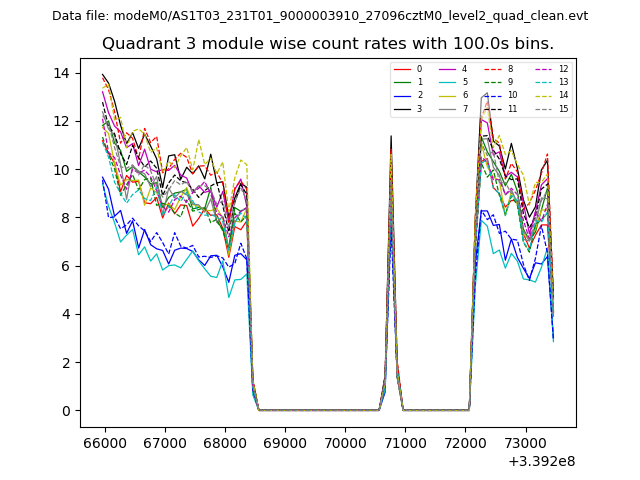
| Module-wise count rates for Quadrant A Data is divided into 100 sec bins |
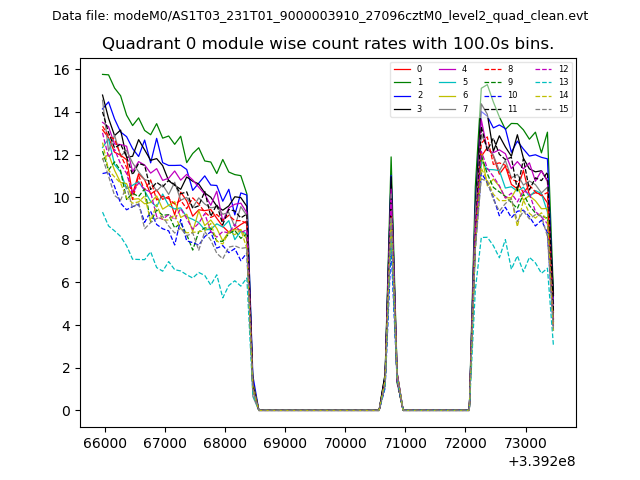 |
 |
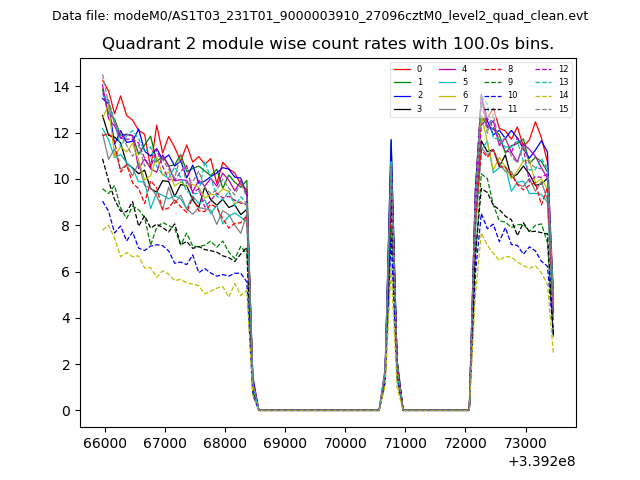
| Module-wise count rates for Quadrant B Data is divided into 100 sec bins |
 |
 |
| Module-wise count rates for Quadrant C Data is divided into 100 sec bins |
 |
 |
| Module-wise count rates for Quadrant D Data is divided into 100 sec bins |
 |
 |
| Parameter | Plot |
|---|---|
| CZT HV Monitor | 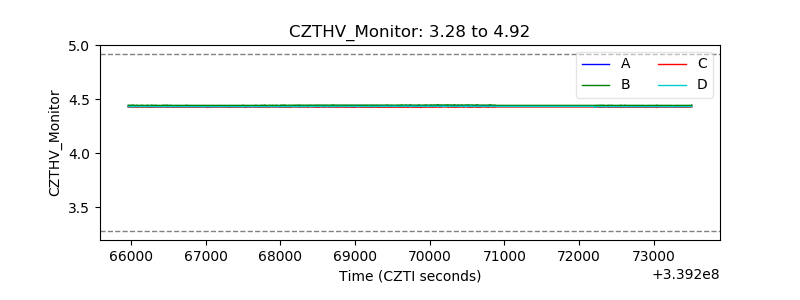 |
| D_VDD | 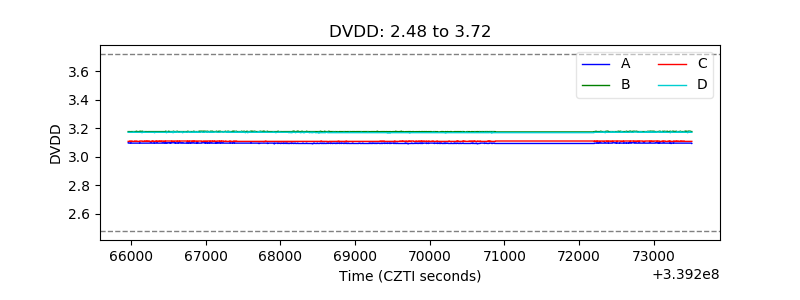 |
| Temperature 1 | 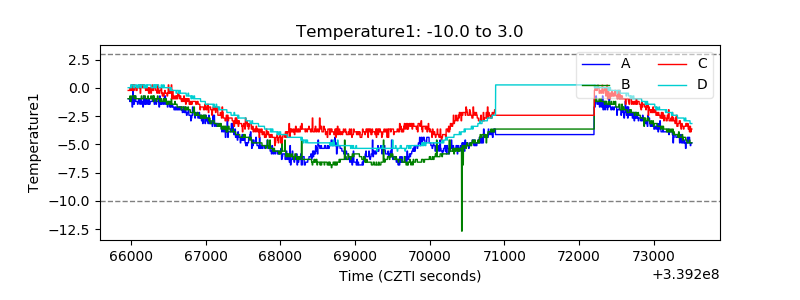 |
| Veto HV Monitor | 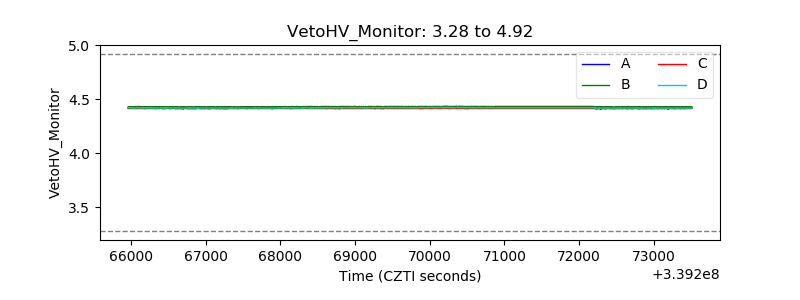 |
| Veto LLD | 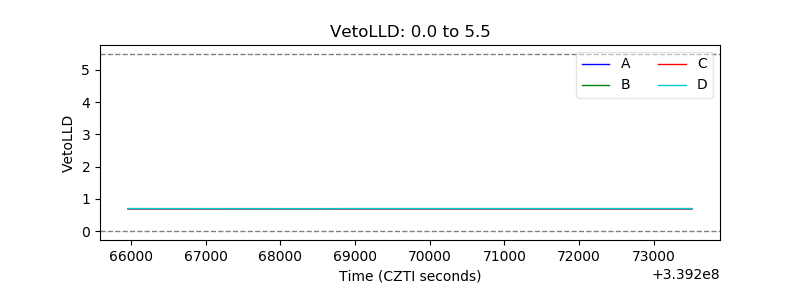 |
| Alpha Counter | 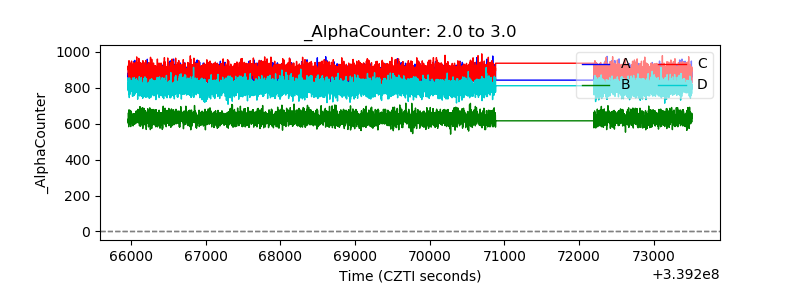 |
| _CPM_Rate | 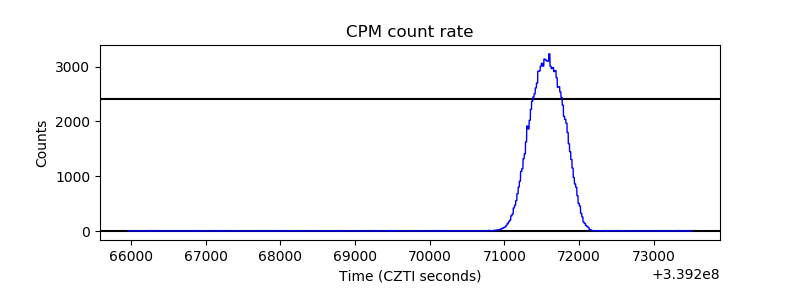 |
| CZT Counter | 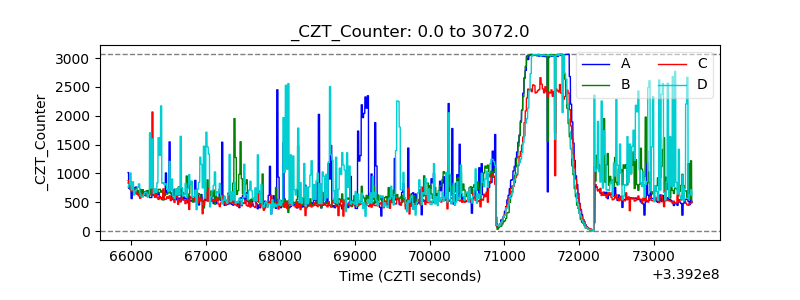 |
| +2.5 Volts monitor |  |
| +5 Volts monitor |  |
| _ROLL_ROT | 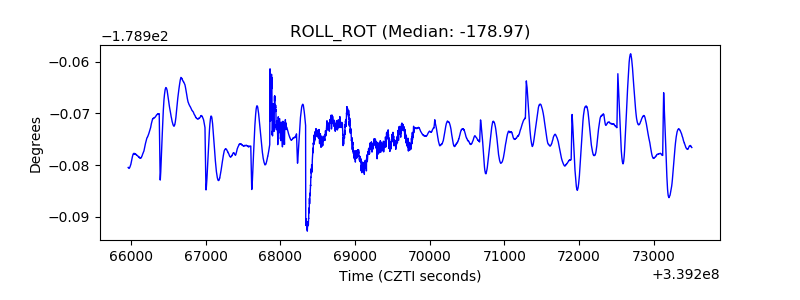 |
| _Roll_DEC | 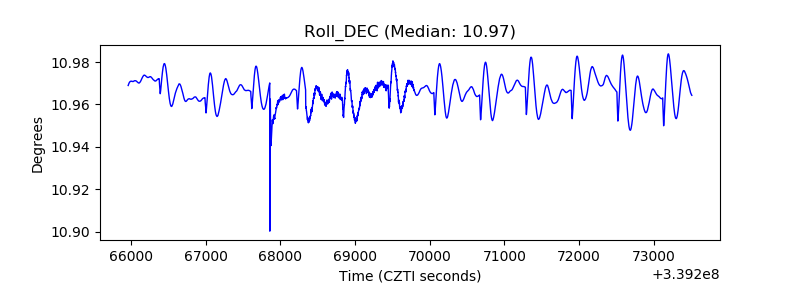 |
| _Roll_RA | 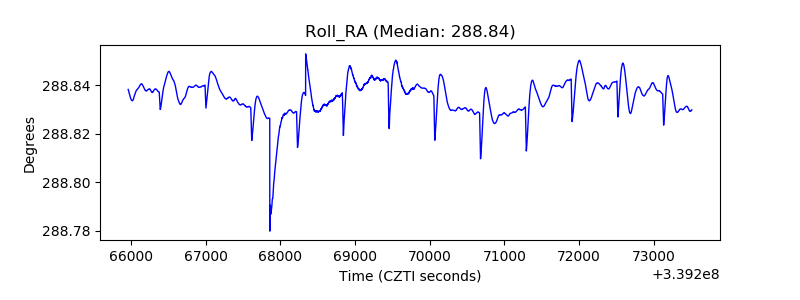 |
| Veto Counter | 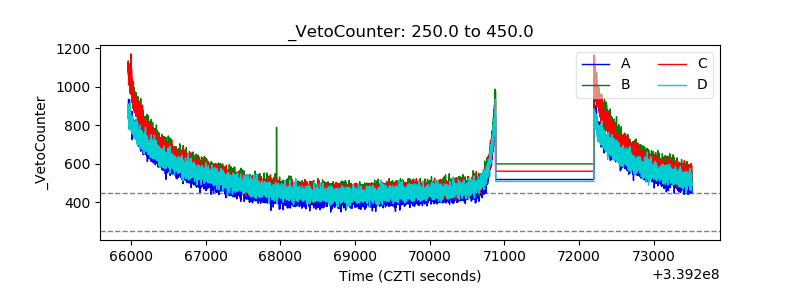 |