| Param | Original file | Final file |
|---|---|---|
| Filename | modeM0/AS1T03_231T01_9000003910_27097cztM0_level2.evt | modeM0/AS1T03_231T01_9000003910_27097cztM0_level2_quad_clean.evt |
| Size (bytes) | 606,551,040 | 91,537,920 |
| Size | 578.5 MB | 87.3 MB |
| Events in quadrant A | 3,408,014 | 621,148 |
| Events in quadrant B | 4,064,922 | 633,668 |
| Events in quadrant C | 3,247,435 | 591,856 |
| Events in quadrant D | 7,236,385 | 498,946 |
| Mode M0 | |||
|---|---|---|---|
| Quadrant | BADHDUFLAG | Total packets | Discarded packets |
| A | 0 | 13843 | 0 |
| B | 0 | 16132 | 0 |
| C | 0 | 13268 | 0 |
| D | 0 | 25728 | 0 |
| Mode M9 | |||
|---|---|---|---|
| Quadrant | BADHDUFLAG | Total packets | Discarded packets |
| A | 0 | 19 | 0 |
| B | 0 | 20 | 0 |
| C | 0 | 20 | 0 |
| D | 0 | 20 | 0 |
| Quadrant | Total seconds | Saturated seconds | Saturation percentage |
|---|---|---|---|
| A | 6102 | 68 | 1.114389% |
| B | 6102 | 98 | 1.606031% |
| C | 6102 | 79 | 1.294657% |
| D | 6102 | 1194 | 19.567355% |
Noise dominated data is calculated using 1-second bins in cleaned event files. If a bin has >2000 counts, and if more than 50% of those come from <1% of pixels, then it is considered to be noise-dominated and hence unusable.
| Quadrant | # 1 sec bins | Bins with >0 counts | Bins with >2000 counts | High rate bins dominated by noise | Noise dominated (total time) | Noise dominated (detector-on time) | Marked lightcurve |
|---|---|---|---|---|---|---|---|
| A | 7437 | 6103 | 13 | 13 | 0.17% | 0.21% | 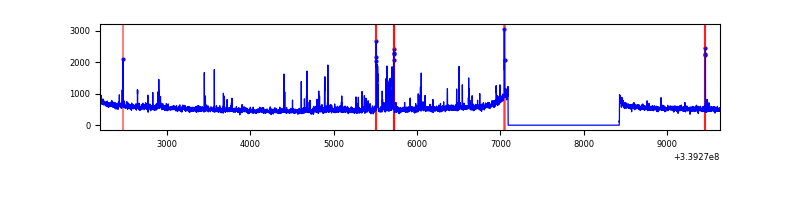 |
| B | 7437 | 6103 | 20 | 20 | 0.27% | 0.33% | 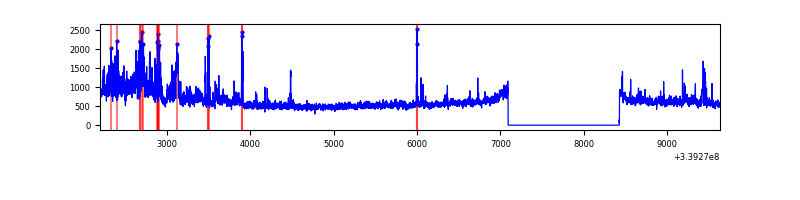 |
| C | 7437 | 6103 | 0 | 0 | 0.00% | 0.00% |  |
| D | 7437 | 6103 | 1134 | 1134 | 15.25% | 18.58% | 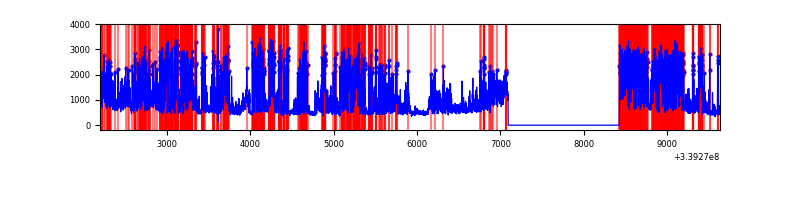 |
Top three noisy pixels from each quadrant. If the there are fewer than three noisy pixels in the level2.evt file, extra rows are filled as -1
| Pixel properties | Quadrant properties | ||||||
|---|---|---|---|---|---|---|---|
| Quadrant | DetID | PixID | Counts | Sigma | Mean | Median | Sigma |
| A | 14 | 235 | 134605 | 829.79 | 819 | 807 | 161.2 |
| A | 6 | 16 | 61545 | 376.69 | 819 | 807 | 161.2 |
| A | 12 | 189 | 27107 | 163.11 | 819 | 807 | 161.2 |
| B | 3 | 112 | 498169 | 3251.36 | 822 | 805 | 153.0 |
| B | 10 | 245 | 185047 | 1204.42 | 822 | 805 | 153.0 |
| B | 0 | 189 | 49768 | 320.08 | 822 | 805 | 153.0 |
| C | 14 | 238 | 127652 | 698.51 | 782 | 790 | 181.6 |
| C | 2 | 16 | 39578 | 213.57 | 782 | 790 | 181.6 |
| C | 3 | 233 | 22518 | 119.64 | 782 | 790 | 181.6 |
| D | 1 | 52 | 4059799 | 23210.66 | 727 | 710 | 174.9 |
| D | 2 | 250 | 133433 | 758.94 | 727 | 710 | 174.9 |
| D | 12 | 227 | 117958 | 670.45 | 727 | 710 | 174.9 |
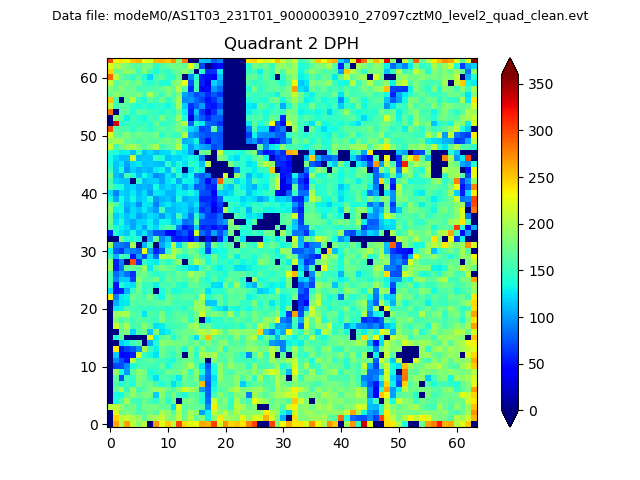
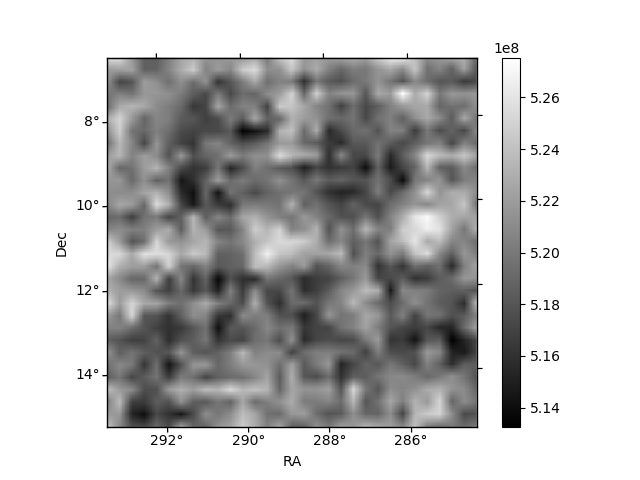
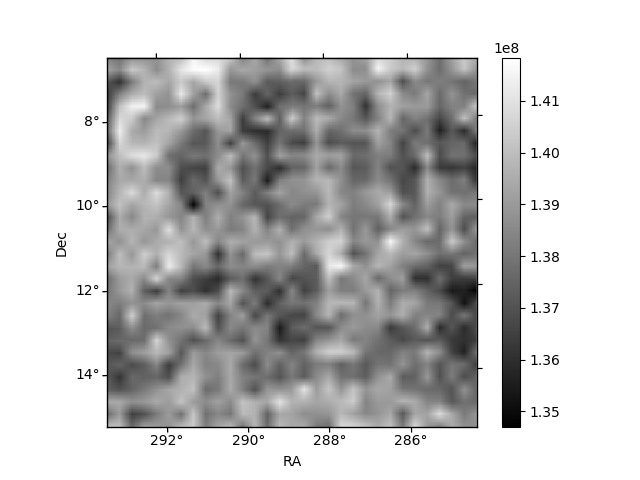
Histogram calculated using DETX and DETY for each event in the final _common_clean file
| Quadrant A |  |
 |
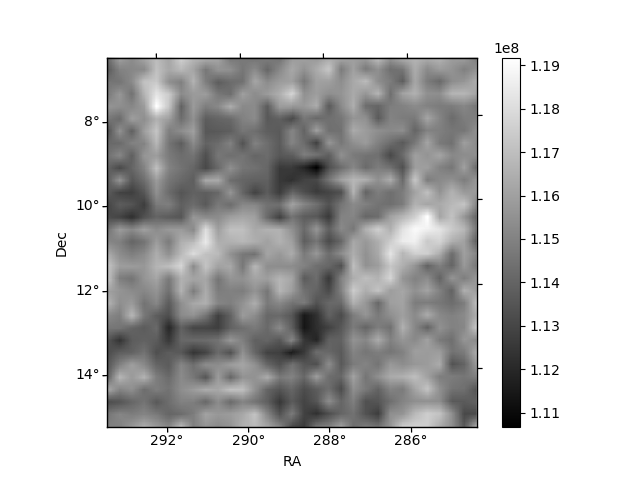
Quadrant B |
|---|---|---|---|
| Quadrant D |  |
 |
Quadrant C |
| Plot type | Count rate plots | Images |
|---|---|---|
| Comparison with Poisson distribution Blue bars denote a histogram of data divided into 1 sec bins. Red curve is a Poisson curve with rate = median count rate of data. |
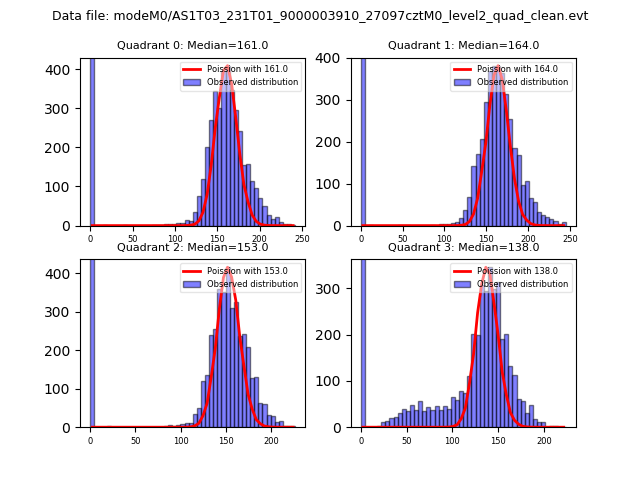 |
 |
| Quadrant-wise count rates Data is divided into 100 sec bins |
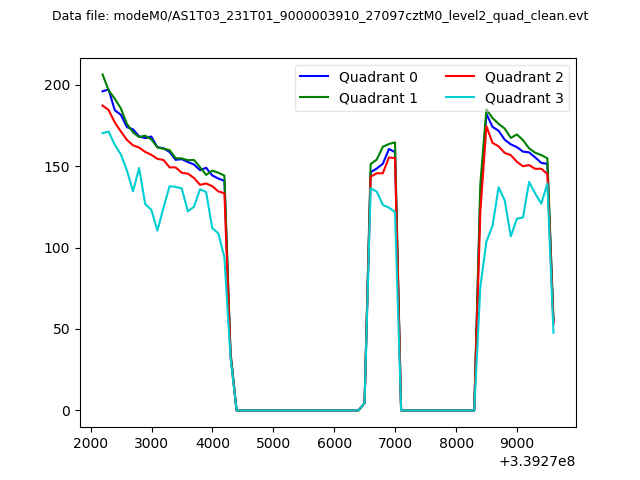 |
|
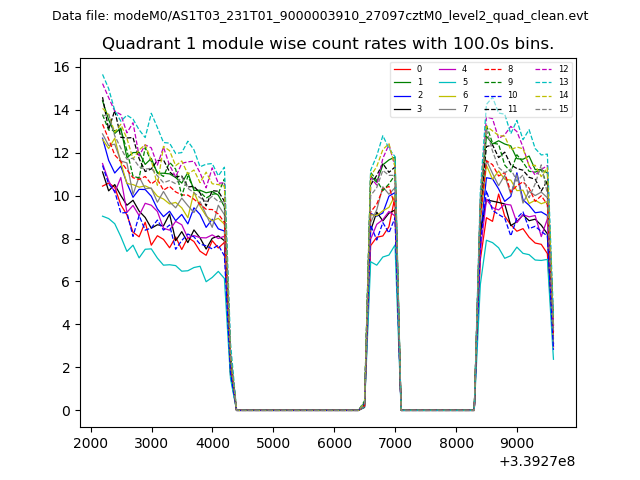
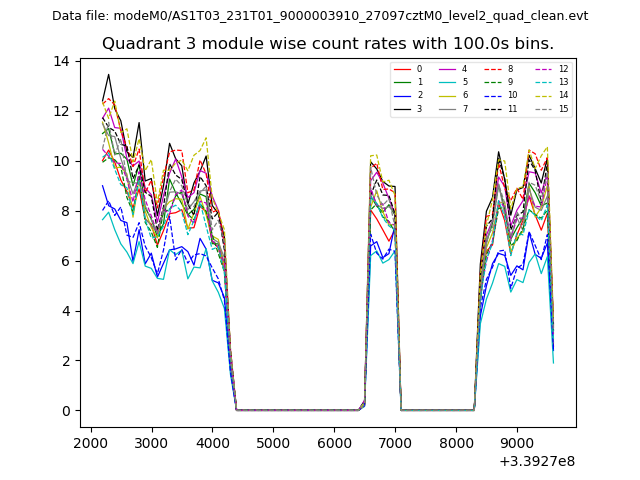
| Module-wise count rates for Quadrant A Data is divided into 100 sec bins |
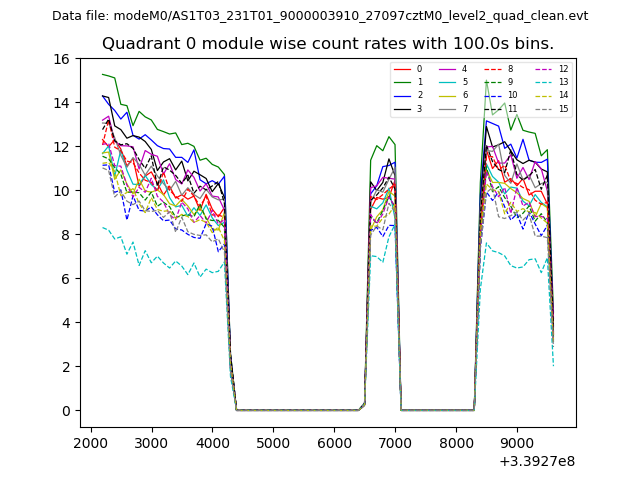 |
 |
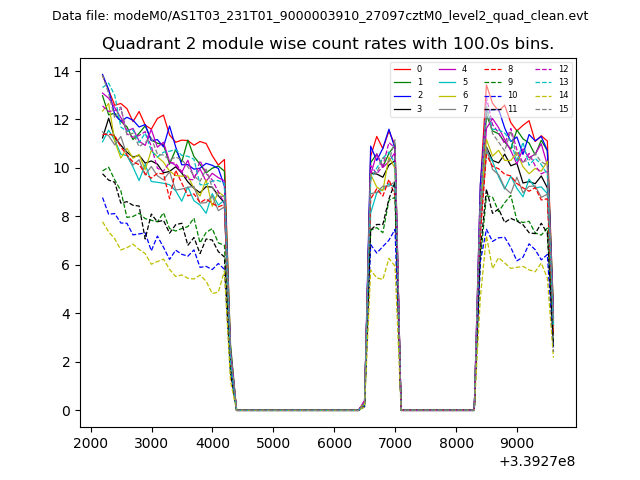
| Module-wise count rates for Quadrant B Data is divided into 100 sec bins |
 |
 |
| Module-wise count rates for Quadrant C Data is divided into 100 sec bins |
 |
 |
| Module-wise count rates for Quadrant D Data is divided into 100 sec bins |
 |
 |
| Parameter | Plot |
|---|---|
| CZT HV Monitor | 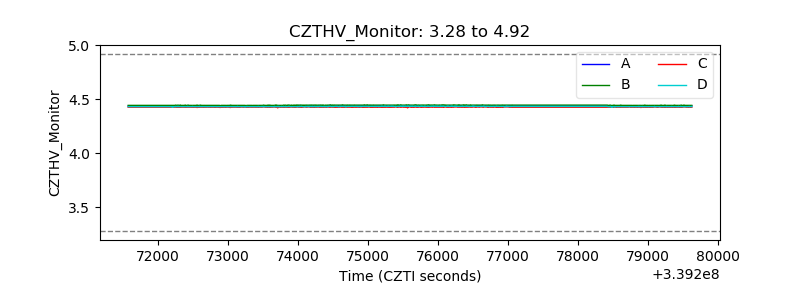 |
| D_VDD | 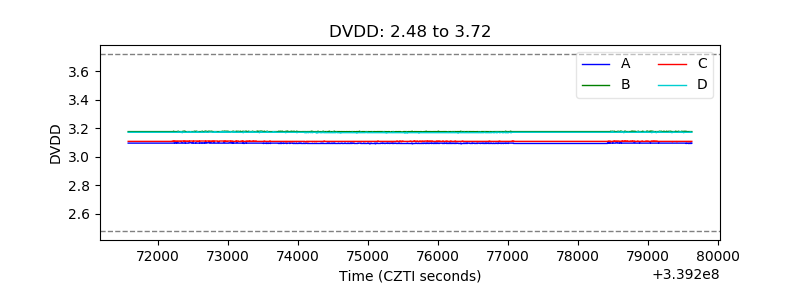 |
| Temperature 1 | 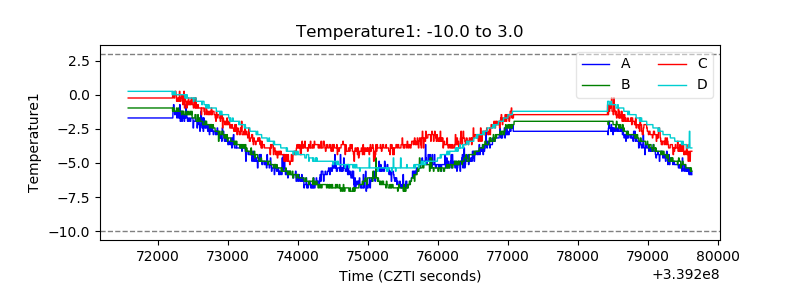 |
| Veto HV Monitor | 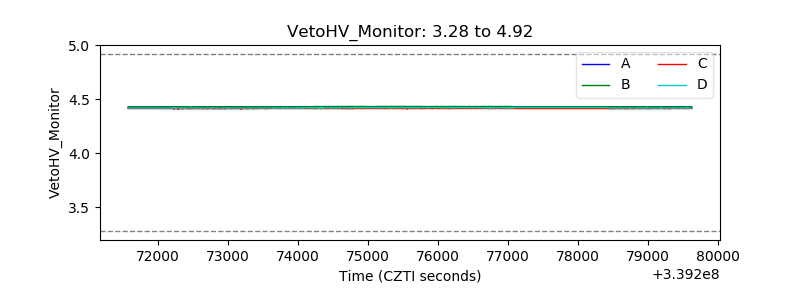 |
| Veto LLD | 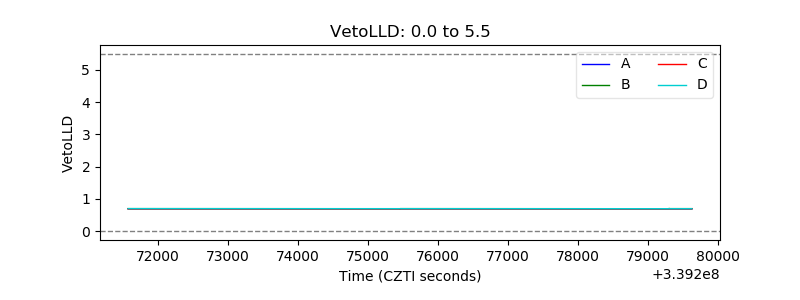 |
| Alpha Counter | 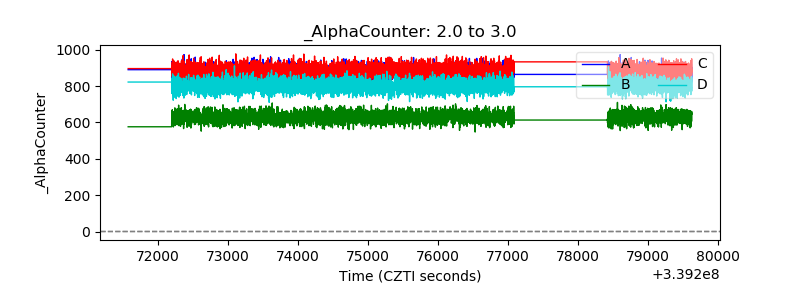 |
| _CPM_Rate | 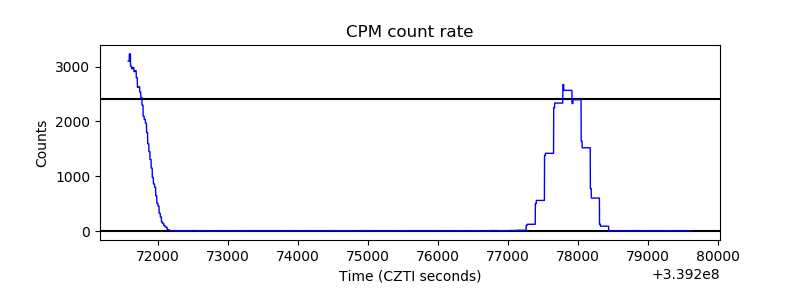 |
| CZT Counter | 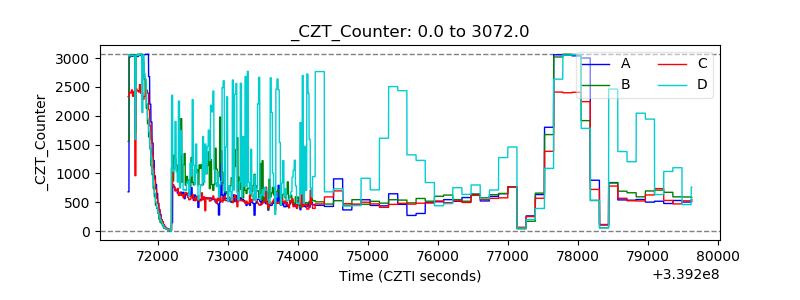 |
| +2.5 Volts monitor |  |
| +5 Volts monitor | 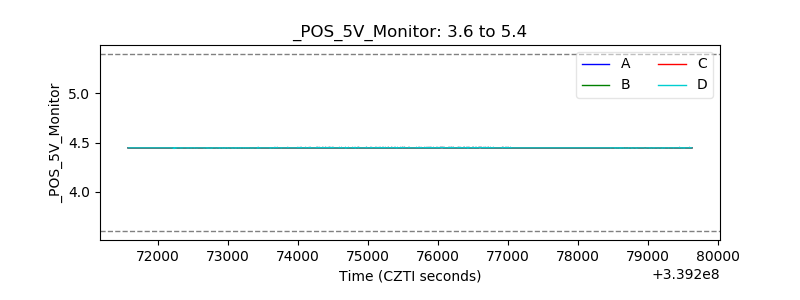 |
| _ROLL_ROT | 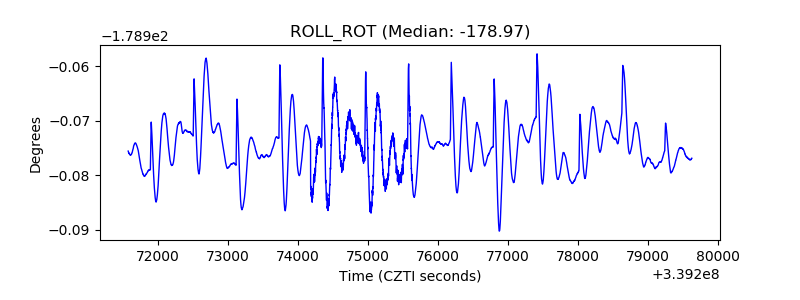 |
| _Roll_DEC | 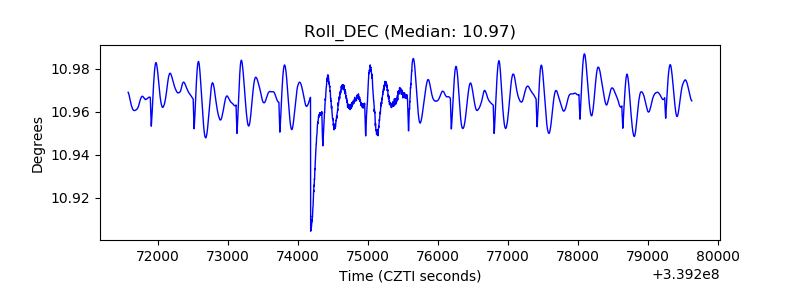 |
| _Roll_RA | 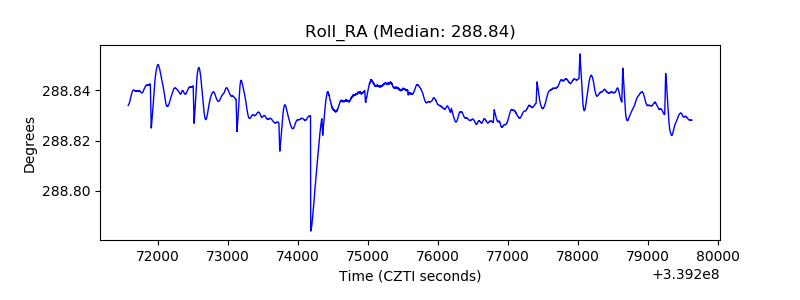 |
| Veto Counter | 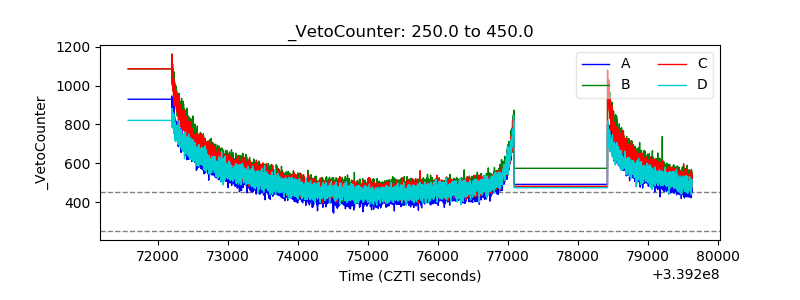 |