| Param | Original file | Final file |
|---|---|---|
| Filename | modeM0/AS1T03_231T01_9000003910_27098cztM0_level2.evt | modeM0/AS1T03_231T01_9000003910_27098cztM0_level2_quad_clean.evt |
| Size (bytes) | 561,412,800 | 90,789,120 |
| Size | 535.4 MB | 86.6 MB |
| Events in quadrant A | 3,480,499 | 602,173 |
| Events in quadrant B | 3,515,433 | 620,378 |
| Events in quadrant C | 3,228,902 | 577,897 |
| Events in quadrant D | 6,357,310 | 515,575 |
| Mode M0 | |||
|---|---|---|---|
| Quadrant | BADHDUFLAG | Total packets | Discarded packets |
| A | 0 | 14072 | 0 |
| B | 0 | 14325 | 0 |
| C | 0 | 13247 | 0 |
| D | 0 | 23070 | 0 |
| Mode M9 | |||
|---|---|---|---|
| Quadrant | BADHDUFLAG | Total packets | Discarded packets |
| A | 0 | 19 | 0 |
| B | 0 | 20 | 0 |
| C | 0 | 20 | 0 |
| D | 0 | 20 | 0 |
| Quadrant | Total seconds | Saturated seconds | Saturation percentage |
|---|---|---|---|
| A | 6199 | 106 | 1.709953% |
| B | 6199 | 57 | 0.919503% |
| C | 6199 | 76 | 1.226004% |
| D | 6198 | 824 | 13.294611% |
Noise dominated data is calculated using 1-second bins in cleaned event files. If a bin has >2000 counts, and if more than 50% of those come from <1% of pixels, then it is considered to be noise-dominated and hence unusable.
| Quadrant | # 1 sec bins | Bins with >0 counts | Bins with >2000 counts | High rate bins dominated by noise | Noise dominated (total time) | Noise dominated (detector-on time) | Marked lightcurve |
|---|---|---|---|---|---|---|---|
| A | 7464 | 6200 | 76 | 76 | 1.02% | 1.23% |  |
| B | 7464 | 6200 | 4 | 4 | 0.05% | 0.06% |  |
| C | 7464 | 6200 | 5 | 5 | 0.07% | 0.08% |  |
| D | 7463 | 6199 | 729 | 729 | 9.77% | 11.76% | 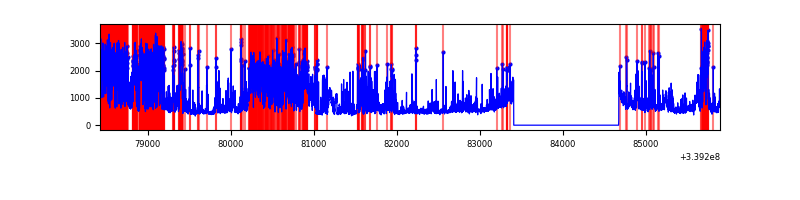 |
Top three noisy pixels from each quadrant. If the there are fewer than three noisy pixels in the level2.evt file, extra rows are filled as -1
| Pixel properties | Quadrant properties | ||||||
|---|---|---|---|---|---|---|---|
| Quadrant | DetID | PixID | Counts | Sigma | Mean | Median | Sigma |
| A | 14 | 235 | 337320 | 2093.81 | 806 | 793 | 160.7 |
| A | 12 | 189 | 20040 | 119.75 | 806 | 793 | 160.7 |
| A | 6 | 16 | 11203 | 64.77 | 806 | 793 | 160.7 |
| B | 10 | 245 | 153592 | 1008.26 | 816 | 800 | 151.5 |
| B | 3 | 112 | 92671 | 606.25 | 816 | 800 | 151.5 |
| B | 0 | 189 | 44325 | 287.22 | 816 | 800 | 151.5 |
| C | 14 | 238 | 124388 | 676.83 | 776 | 781 | 182.6 |
| C | 15 | 208 | 45267 | 243.59 | 776 | 781 | 182.6 |
| C | 3 | 233 | 26426 | 140.42 | 776 | 781 | 182.6 |
| D | 1 | 52 | 3062812 | 17234.26 | 737 | 719 | 177.7 |
| D | 2 | 250 | 189356 | 1061.7 | 737 | 719 | 177.7 |
| D | 12 | 227 | 130259 | 729.09 | 737 | 719 | 177.7 |
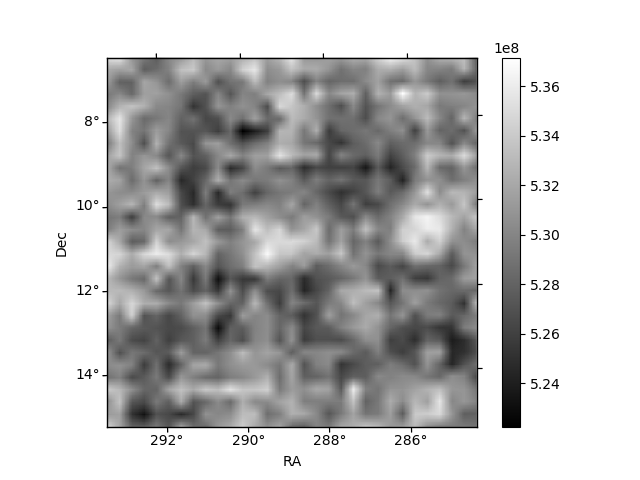
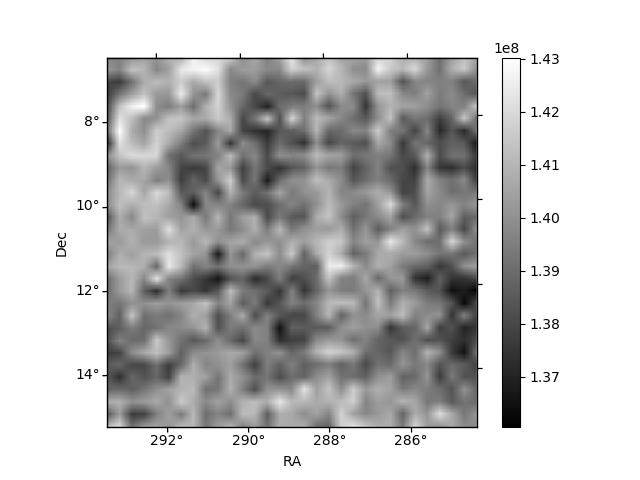
Histogram calculated using DETX and DETY for each event in the final _common_clean file
| Quadrant A | 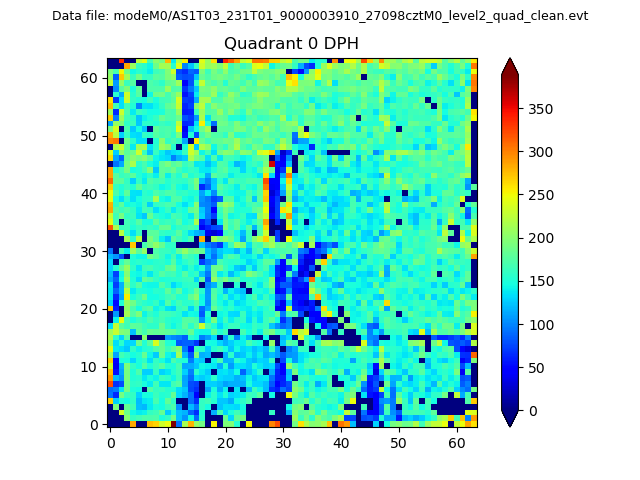 |
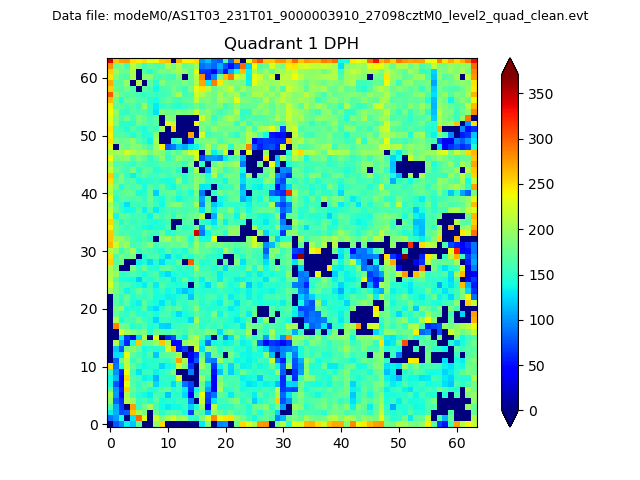 |
Quadrant B |
|---|---|---|---|
| Quadrant D | 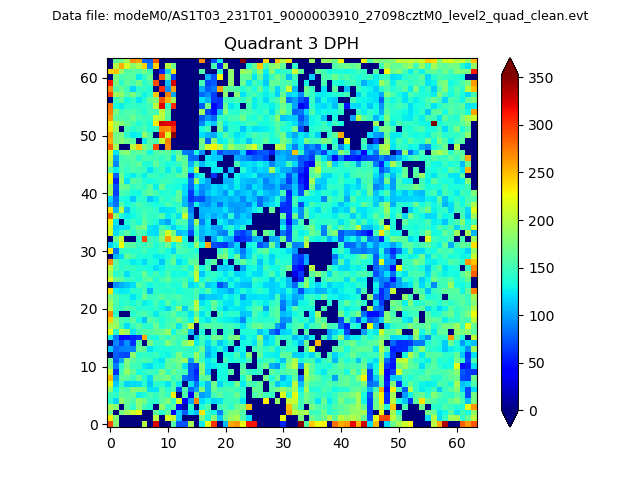 |
 |
Quadrant C |
| Plot type | Count rate plots | Images |
|---|---|---|
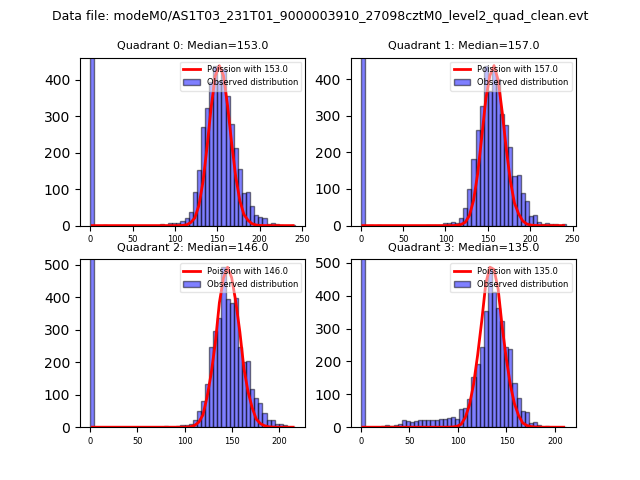
| Comparison with Poisson distribution Blue bars denote a histogram of data divided into 1 sec bins. Red curve is a Poisson curve with rate = median count rate of data. |
 |
 |
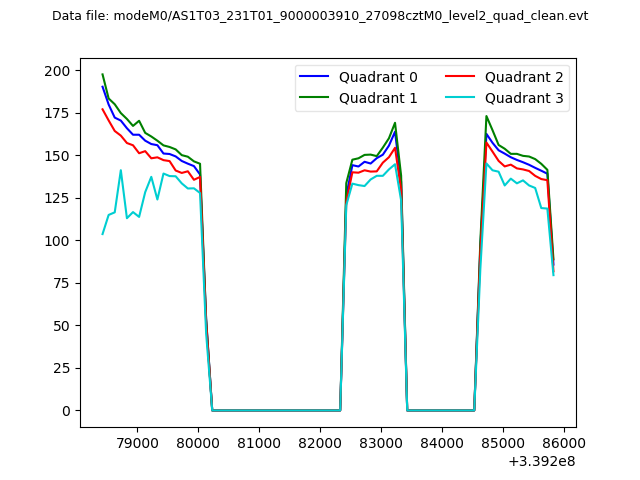
| Quadrant-wise count rates Data is divided into 100 sec bins |
 |
|
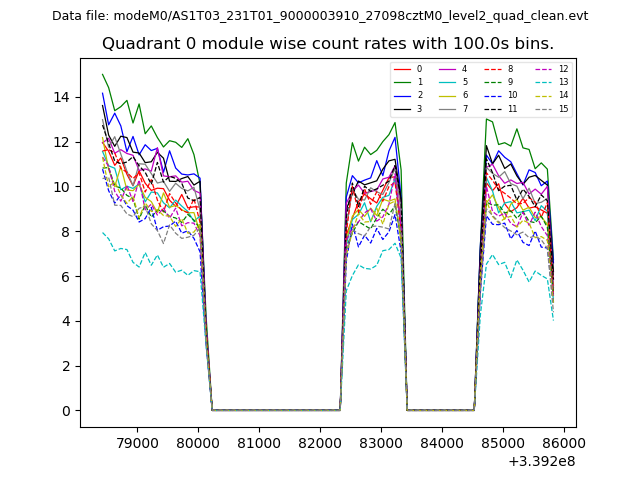
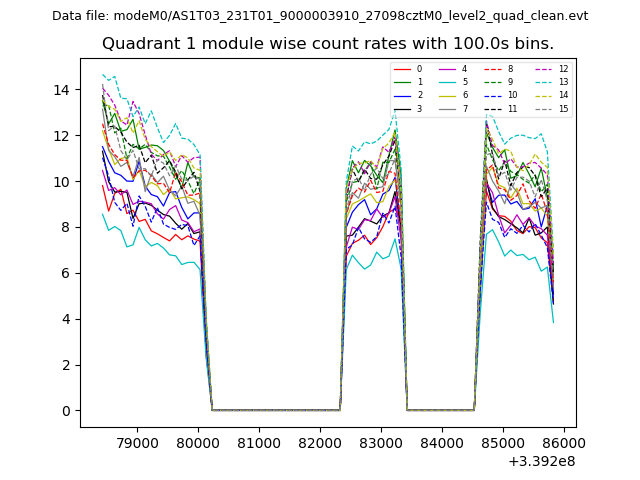
| Module-wise count rates for Quadrant A Data is divided into 100 sec bins |
 |
 |
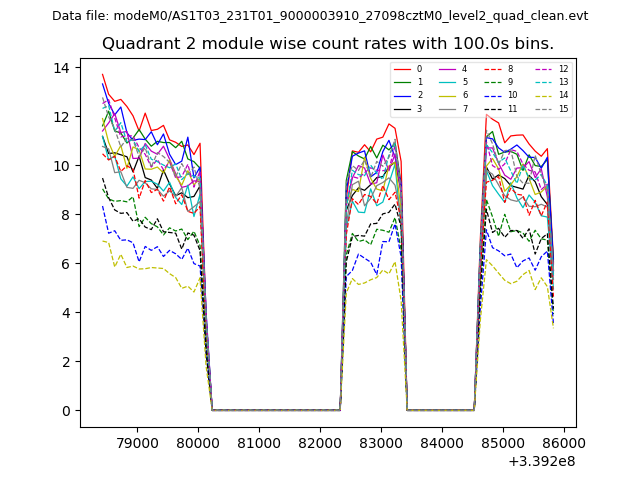
| Module-wise count rates for Quadrant B Data is divided into 100 sec bins |
 |
 |
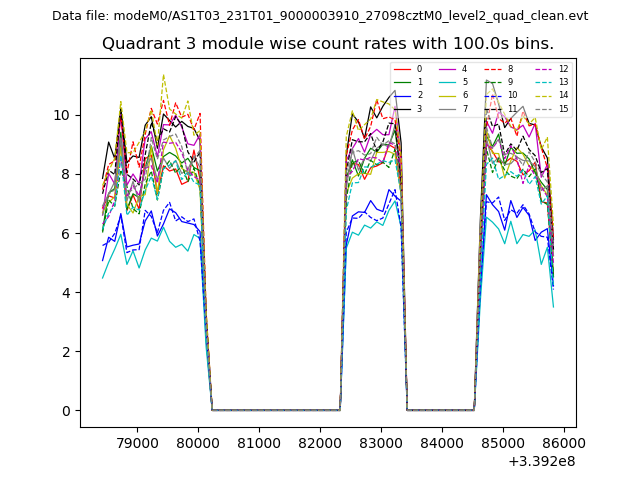
| Module-wise count rates for Quadrant C Data is divided into 100 sec bins |
 |
 |
| Module-wise count rates for Quadrant D Data is divided into 100 sec bins |
 |
 |
| Parameter | Plot |
|---|---|
| CZT HV Monitor | 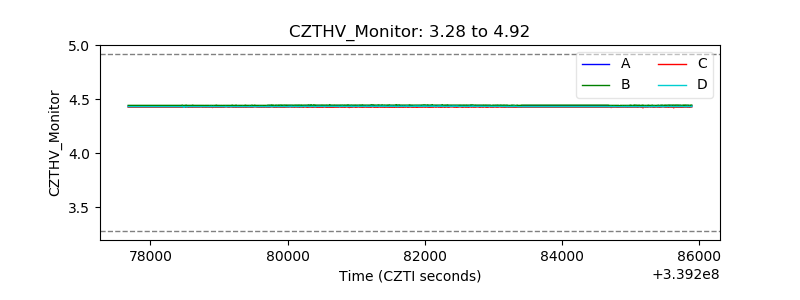 |
| D_VDD | 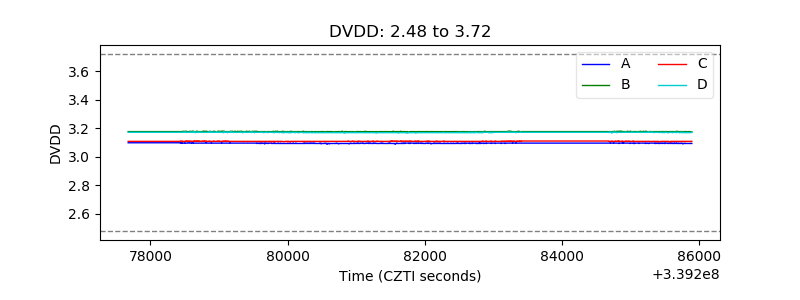 |
| Temperature 1 | 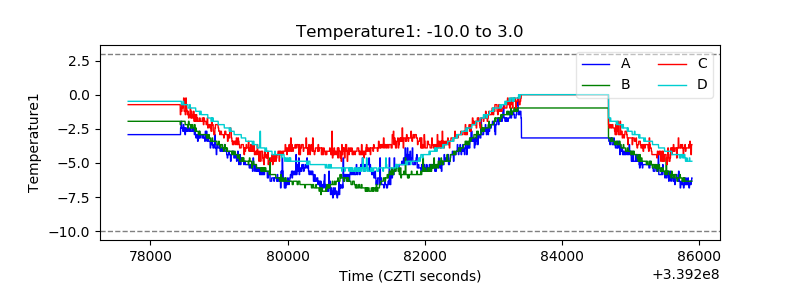 |
| Veto HV Monitor | 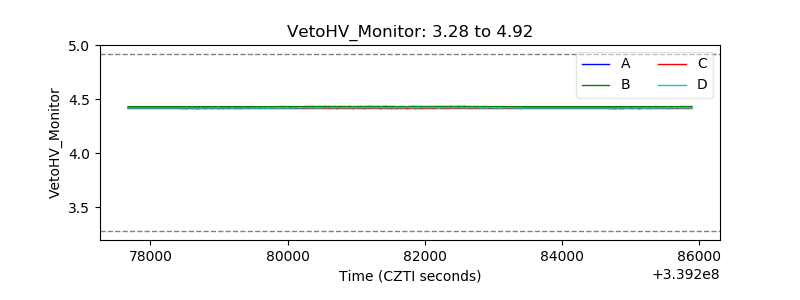 |
| Veto LLD | 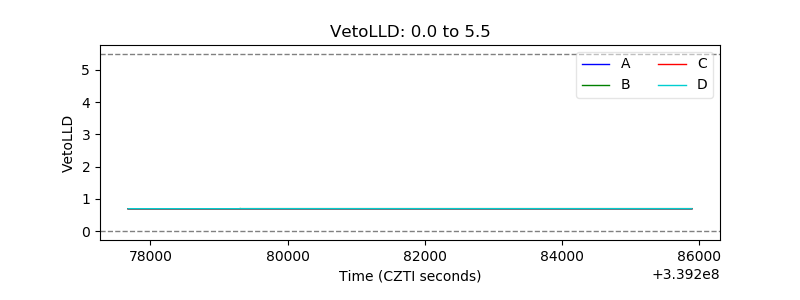 |
| Alpha Counter | 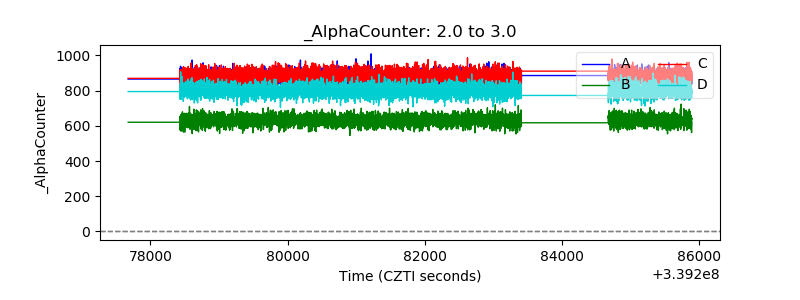 |
| _CPM_Rate | 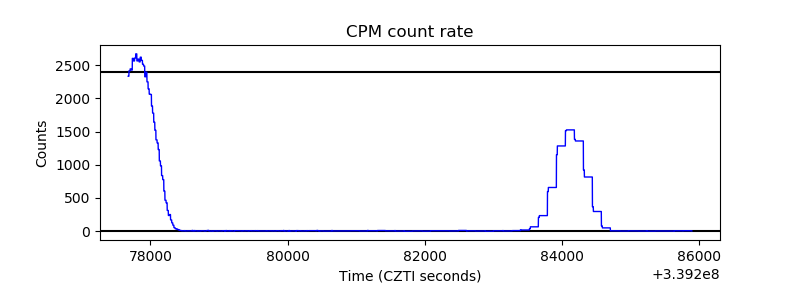 |
| CZT Counter | 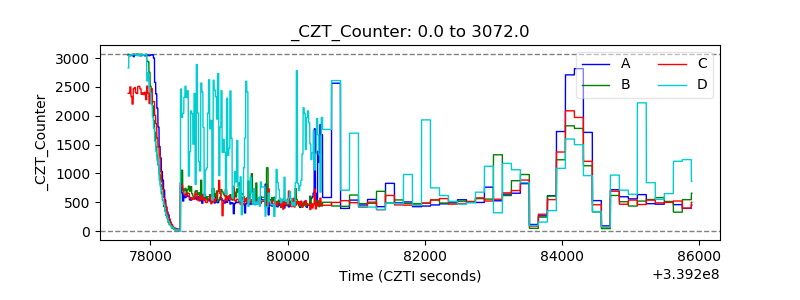 |
| +2.5 Volts monitor |  |
| +5 Volts monitor |  |
| _ROLL_ROT | 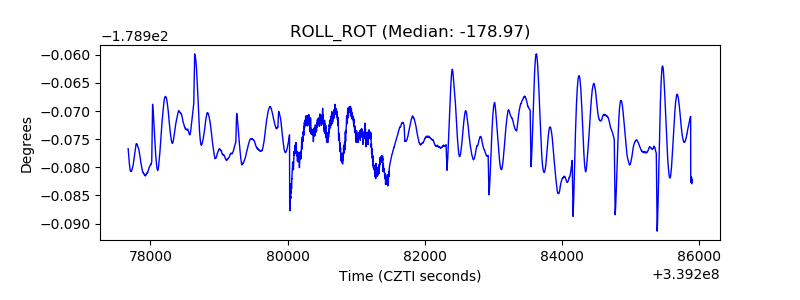 |
| _Roll_DEC | 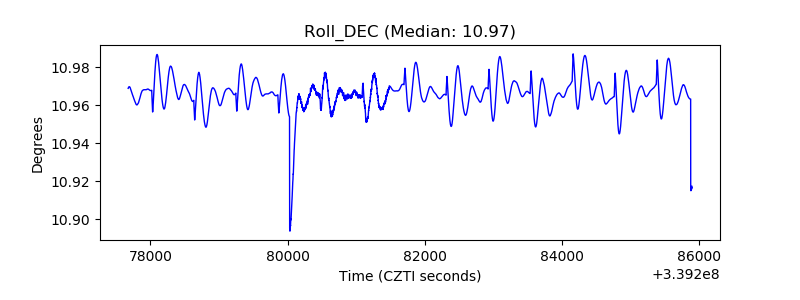 |
| _Roll_RA | 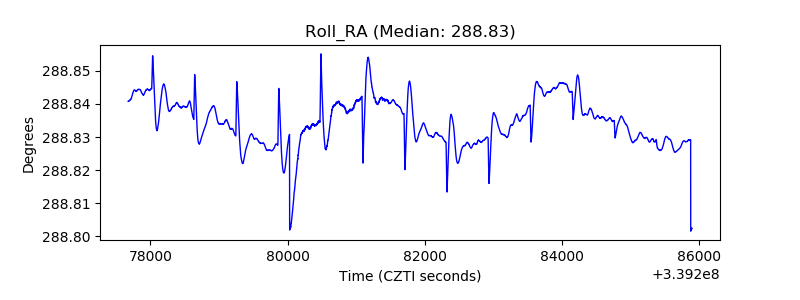 |
| Veto Counter | 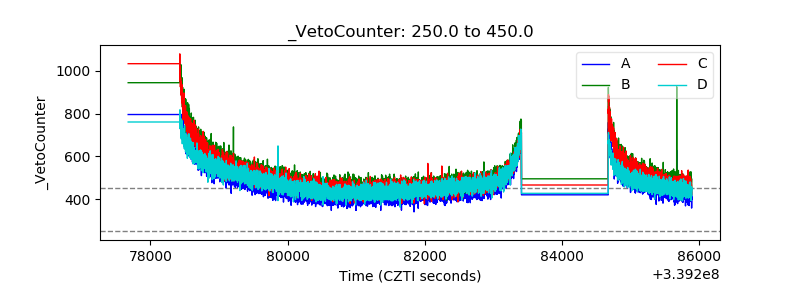 |