| Param | Original file | Final file |
|---|---|---|
| Filename | modeM0/AS1T03_231T01_9000003910_27099cztM0_level2.evt | modeM0/AS1T03_231T01_9000003910_27099cztM0_level2_quad_clean.evt |
| Size (bytes) | 521,648,640 | 86,688,000 |
| Size | 497.5 MB | 82.7 MB |
| Events in quadrant A | 3,236,285 | 560,054 |
| Events in quadrant B | 3,863,161 | 569,411 |
| Events in quadrant C | 3,286,788 | 540,691 |
| Events in quadrant D | 4,968,942 | 499,347 |
| Mode M0 | |||
|---|---|---|---|
| Quadrant | BADHDUFLAG | Total packets | Discarded packets |
| A | 0 | 13653 | 0 |
| B | 0 | 15544 | 0 |
| C | 0 | 13663 | 0 |
| D | 0 | 19234 | 0 |
| Mode M9 | |||
|---|---|---|---|
| Quadrant | BADHDUFLAG | Total packets | Discarded packets |
| A | 0 | 19 | 0 |
| B | 0 | 20 | 0 |
| C | 0 | 20 | 0 |
| D | 0 | 20 | 0 |
| Quadrant | Total seconds | Saturated seconds | Saturation percentage |
|---|---|---|---|
| A | 6525 | 35 | 0.536398% |
| B | 6525 | 146 | 2.237548% |
| C | 6525 | 53 | 0.812261% |
| D | 6525 | 339 | 5.195402% |
Noise dominated data is calculated using 1-second bins in cleaned event files. If a bin has >2000 counts, and if more than 50% of those come from <1% of pixels, then it is considered to be noise-dominated and hence unusable.
| Quadrant | # 1 sec bins | Bins with >0 counts | Bins with >2000 counts | High rate bins dominated by noise | Noise dominated (total time) | Noise dominated (detector-on time) | Marked lightcurve |
|---|---|---|---|---|---|---|---|
| A | 7540 | 6526 | 1 | 1 | 0.01% | 0.02% | 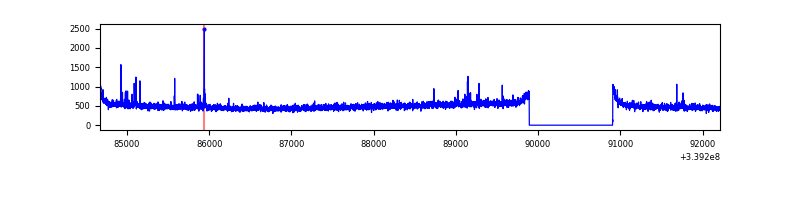 |
| B | 7540 | 6526 | 56 | 56 | 0.74% | 0.86% | 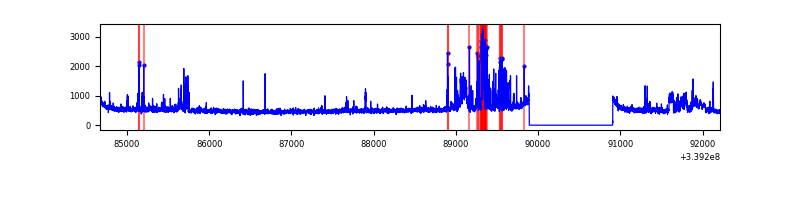 |
| C | 7540 | 6526 | 5 | 5 | 0.07% | 0.08% | 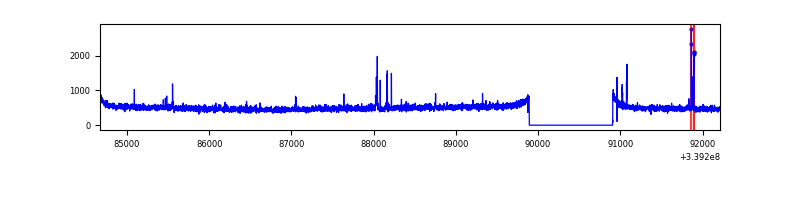 |
| D | 7540 | 6526 | 268 | 268 | 3.55% | 4.11% | 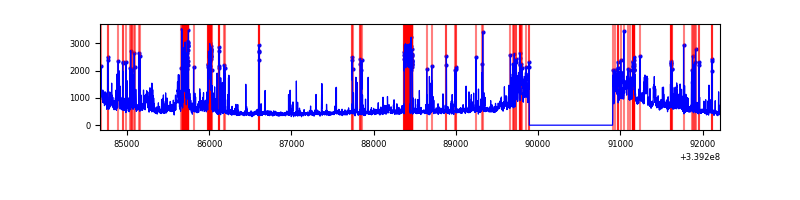 |
Top three noisy pixels from each quadrant. If the there are fewer than three noisy pixels in the level2.evt file, extra rows are filled as -1
| Pixel properties | Quadrant properties | ||||||
|---|---|---|---|---|---|---|---|
| Quadrant | DetID | PixID | Counts | Sigma | Mean | Median | Sigma |
| A | 14 | 235 | 49252 | 292.82 | 822 | 806 | 165.4 |
| A | 13 | 254 | 10849 | 60.7 | 822 | 806 | 165.4 |
| A | 12 | 189 | 9680 | 53.63 | 822 | 806 | 165.4 |
| B | 10 | 245 | 470245 | 3014.46 | 823 | 805 | 155.7 |
| B | 3 | 112 | 75847 | 481.87 | 823 | 805 | 155.7 |
| B | 7 | 205 | 36958 | 232.15 | 823 | 805 | 155.7 |
| C | 14 | 238 | 126600 | 675.68 | 792 | 799 | 186.2 |
| C | 15 | 208 | 60210 | 319.1 | 792 | 799 | 186.2 |
| C | 3 | 233 | 9163 | 44.92 | 792 | 799 | 186.2 |
| D | 1 | 52 | 707422 | 3707.68 | 774 | 755 | 190.6 |
| D | 7 | 38 | 427406 | 2238.51 | 774 | 755 | 190.6 |
| D | 13 | 172 | 258555 | 1352.6 | 774 | 755 | 190.6 |
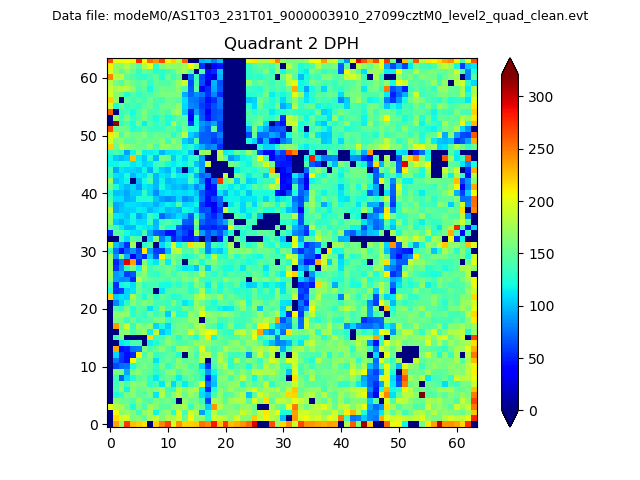
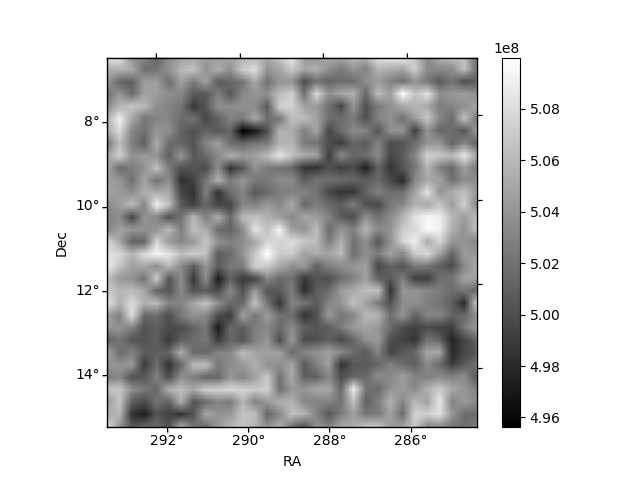
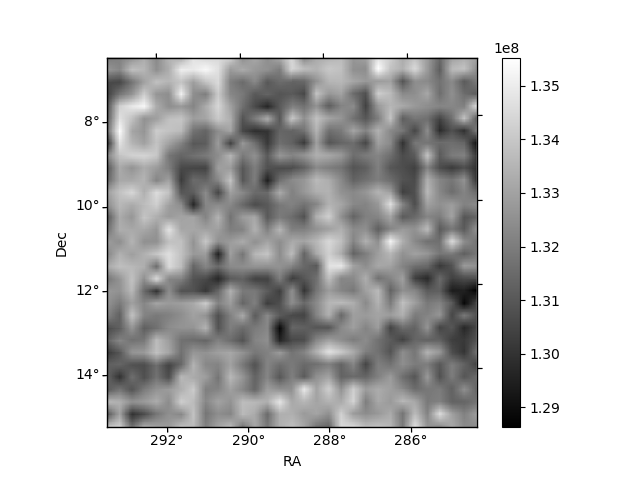
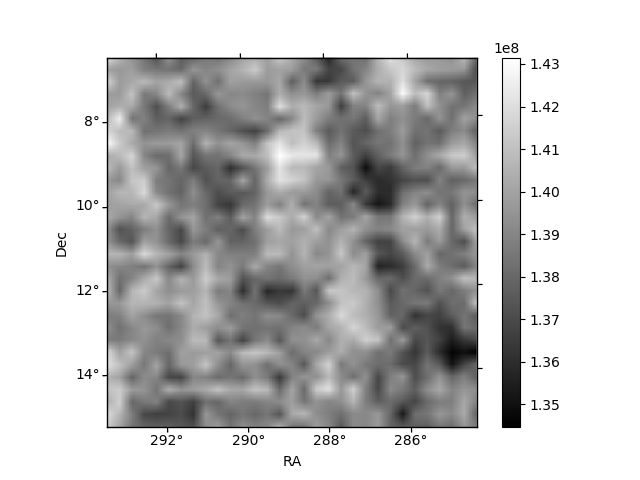
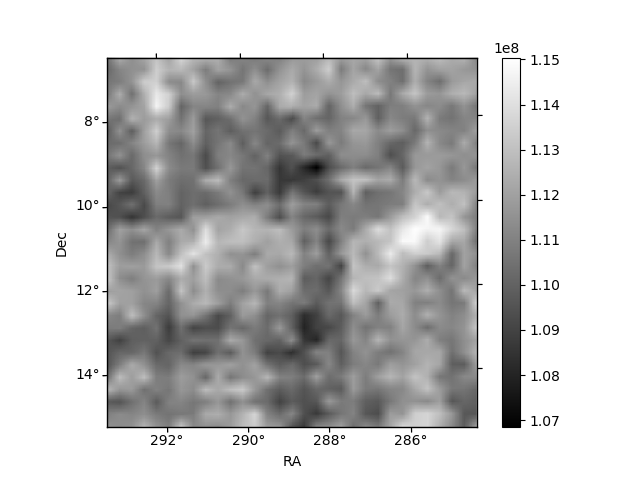
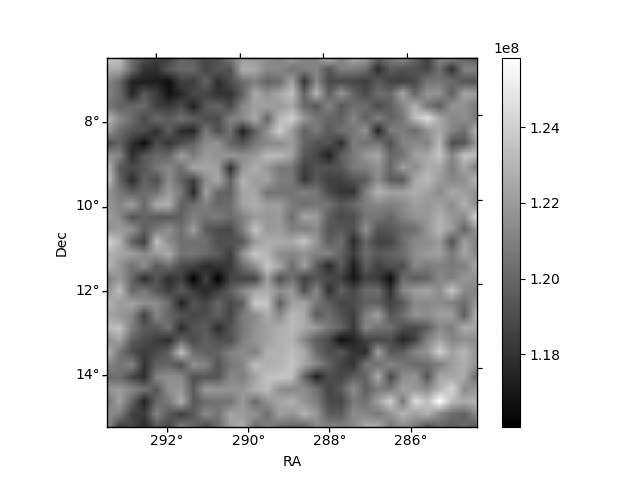
Histogram calculated using DETX and DETY for each event in the final _common_clean file
| Quadrant A | 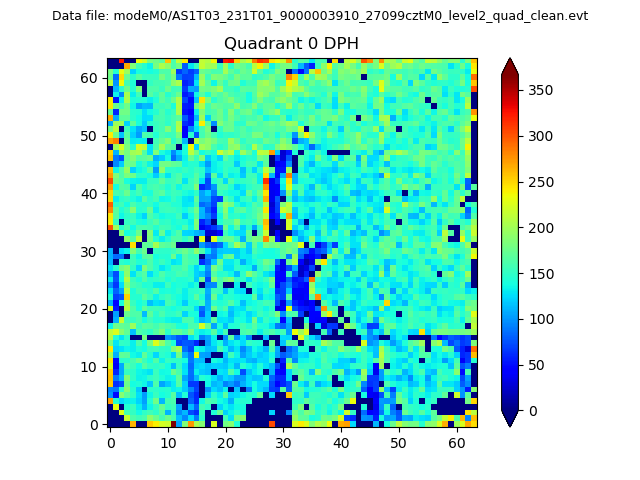 |
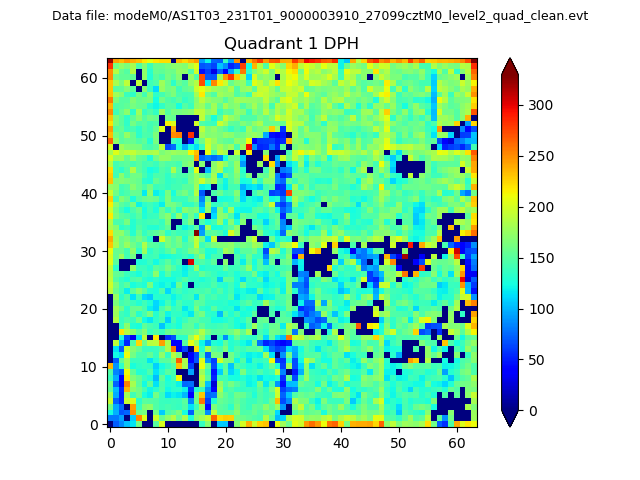 |
Quadrant B |
|---|---|---|---|
| Quadrant D | 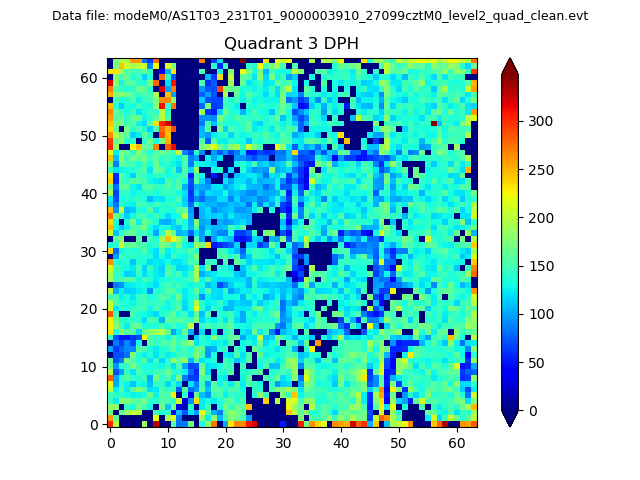 |
 |
Quadrant C |
| Plot type | Count rate plots | Images |
|---|---|---|
| Comparison with Poisson distribution Blue bars denote a histogram of data divided into 1 sec bins. Red curve is a Poisson curve with rate = median count rate of data. |
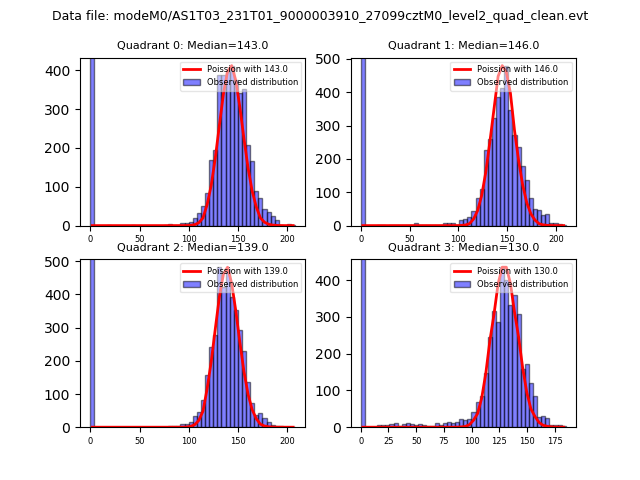 |
 |
| Quadrant-wise count rates Data is divided into 100 sec bins |
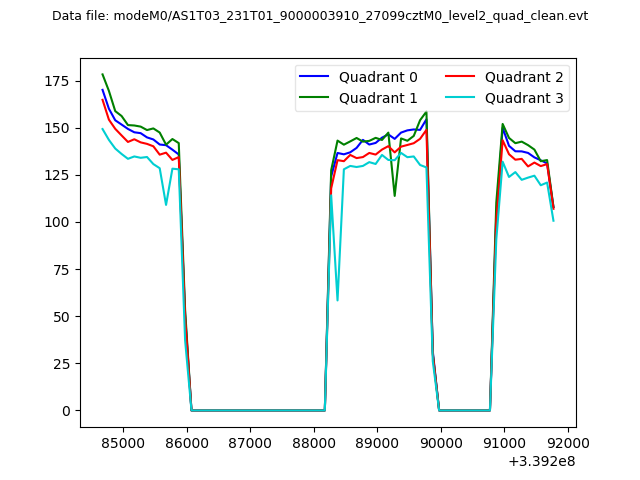 |
|
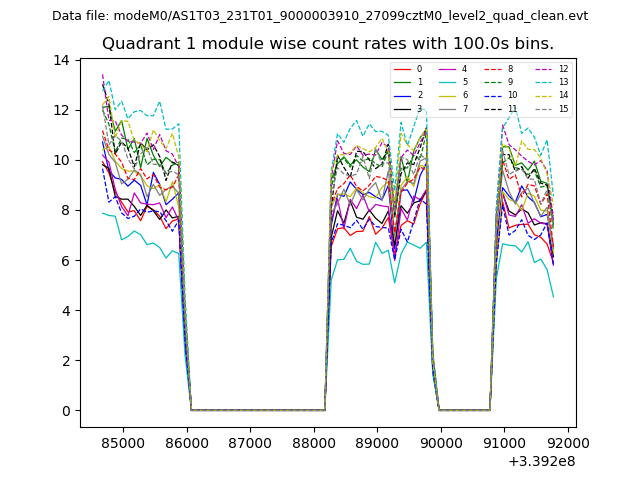
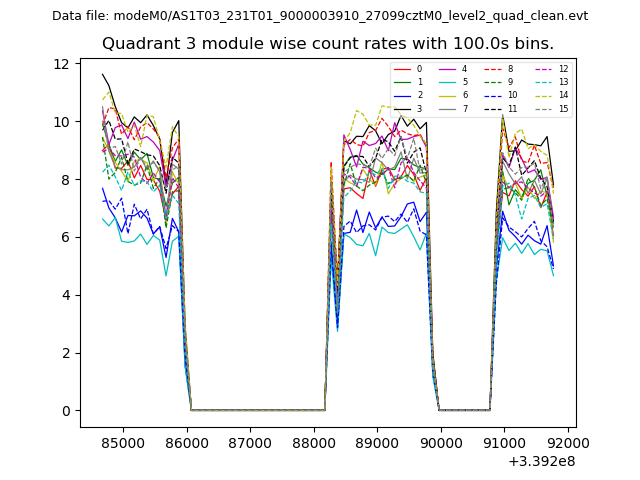
| Module-wise count rates for Quadrant A Data is divided into 100 sec bins |
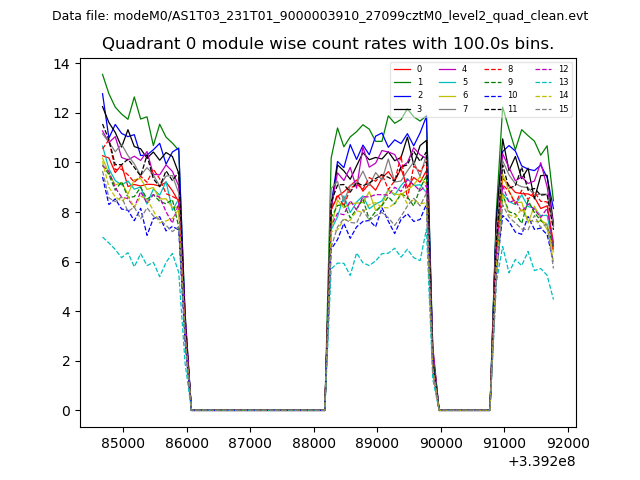 |
 |
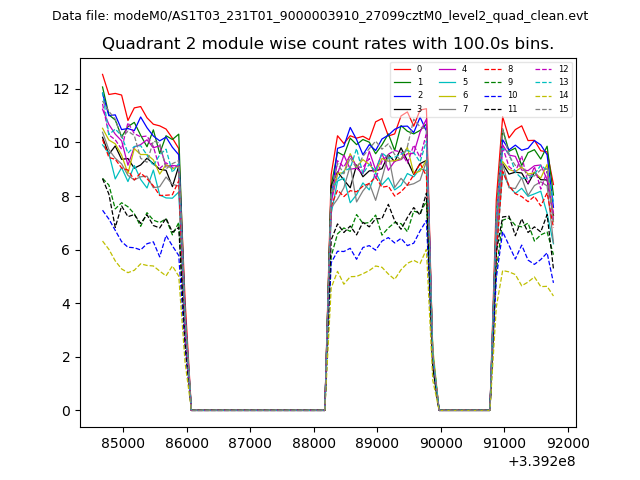
| Module-wise count rates for Quadrant B Data is divided into 100 sec bins |
 |
 |
| Module-wise count rates for Quadrant C Data is divided into 100 sec bins |
 |
 |
| Module-wise count rates for Quadrant D Data is divided into 100 sec bins |
 |
 |
| Parameter | Plot |
|---|---|
| CZT HV Monitor | 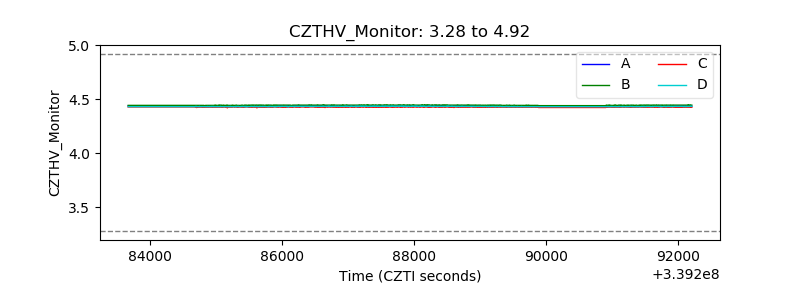 |
| D_VDD | 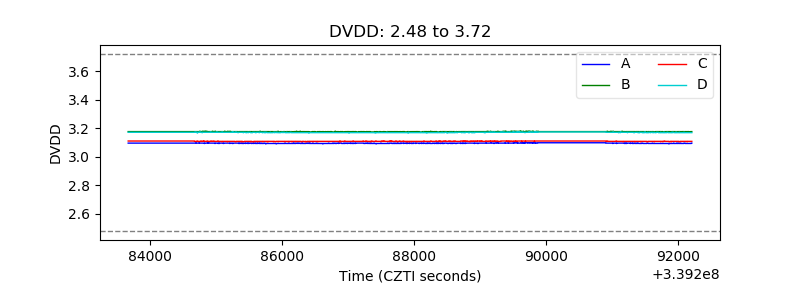 |
| Temperature 1 | 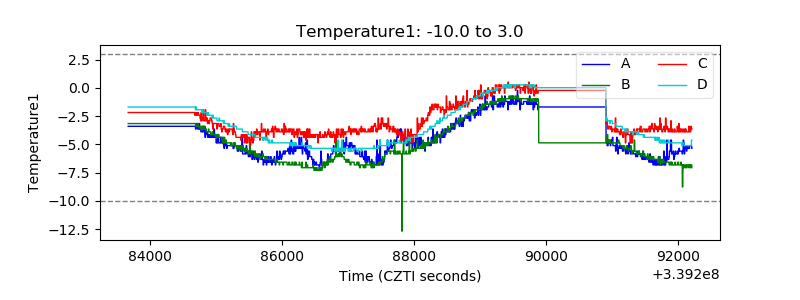 |
| Veto HV Monitor | 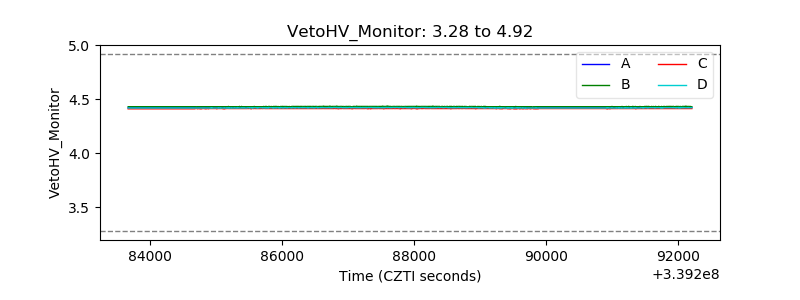 |
| Veto LLD | 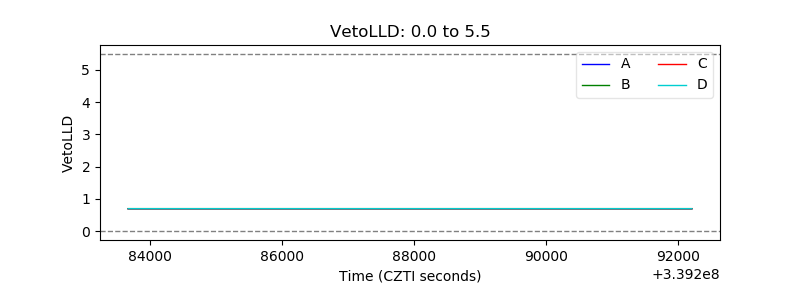 |
| Alpha Counter | 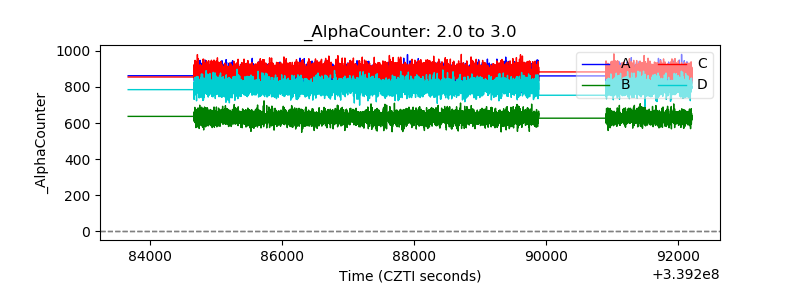 |
| _CPM_Rate | 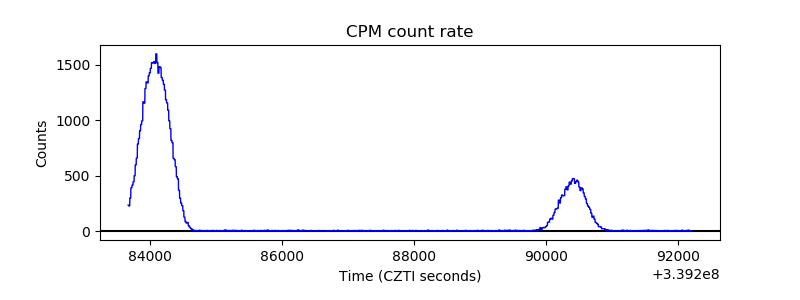 |
| CZT Counter | 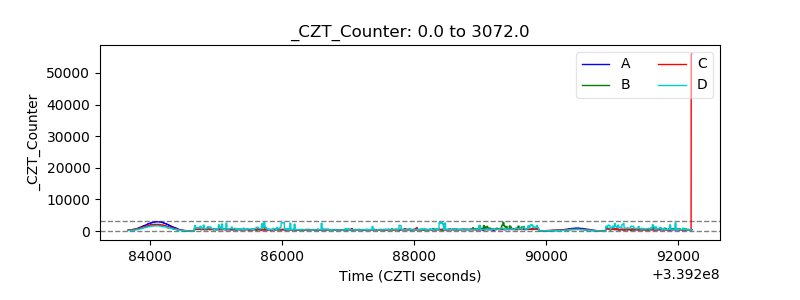 |
| +2.5 Volts monitor |  |
| +5 Volts monitor | 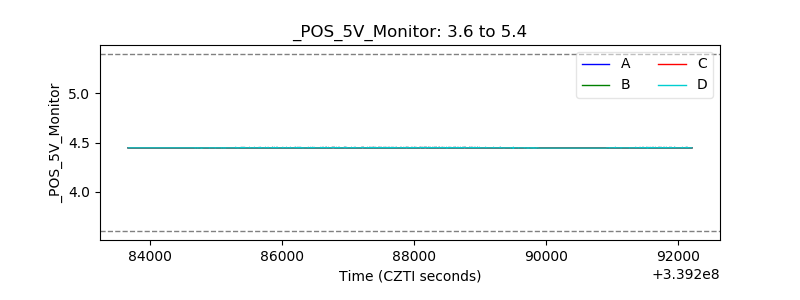 |
| _ROLL_ROT | 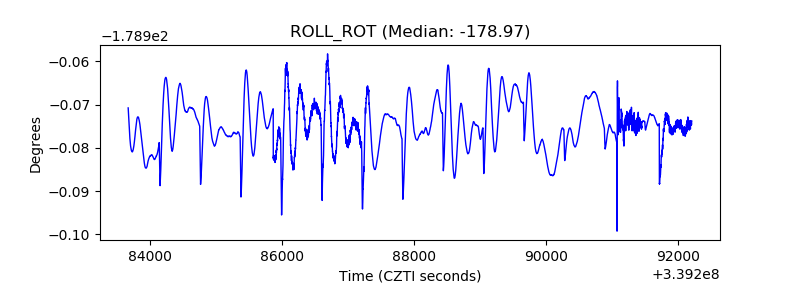 |
| _Roll_DEC | 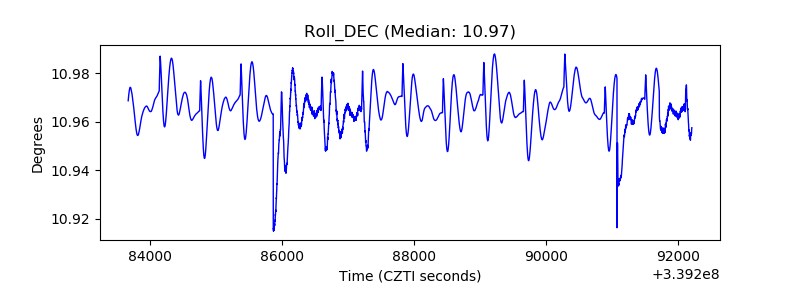 |
| _Roll_RA | 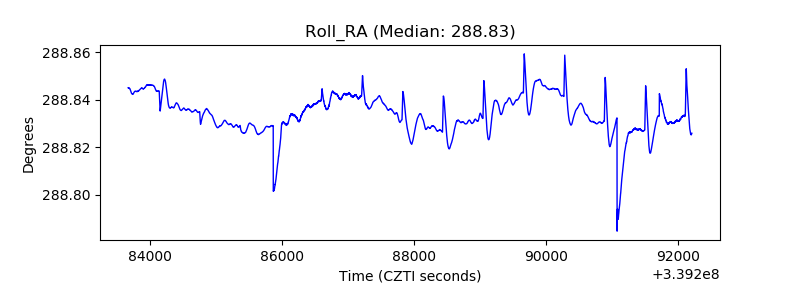 |
| Veto Counter |  |