| Param | Original file | Final file |
|---|---|---|
| Filename | modeM0/AS1T03_231T01_9000003910_27101cztM0_level2.evt | modeM0/AS1T03_231T01_9000003910_27101cztM0_level2_quad_clean.evt |
| Size (bytes) | 622,431,360 | 85,080,960 |
| Size | 593.6 MB | 81.1 MB |
| Events in quadrant A | 4,785,622 | 511,423 |
| Events in quadrant B | 4,118,838 | 531,917 |
| Events in quadrant C | 3,776,060 | 514,500 |
| Events in quadrant D | 5,650,142 | 484,610 |
| Mode M0 | |||
|---|---|---|---|
| Quadrant | BADHDUFLAG | Total packets | Discarded packets |
| A | 0 | 19077 | 0 |
| B | 0 | 16969 | 0 |
| C | 0 | 16014 | 0 |
| D | 0 | 22134 | 0 |
| Mode M9 | |||
|---|---|---|---|
| Quadrant | BADHDUFLAG | Total packets | Discarded packets |
| A | 0 | 6 | 0 |
| B | 0 | 7 | 0 |
| C | 0 | 7 | 0 |
| D | 0 | 7 | 0 |
| Quadrant | Total seconds | Saturated seconds | Saturation percentage |
|---|---|---|---|
| A | 7675 | 464 | 6.045603% |
| B | 7674 | 262 | 3.414126% |
| C | 7674 | 178 | 2.319520% |
| D | 7674 | 321 | 4.182955% |
Noise dominated data is calculated using 1-second bins in cleaned event files. If a bin has >2000 counts, and if more than 50% of those come from <1% of pixels, then it is considered to be noise-dominated and hence unusable.
| Quadrant | # 1 sec bins | Bins with >0 counts | Bins with >2000 counts | High rate bins dominated by noise | Noise dominated (total time) | Noise dominated (detector-on time) | Marked lightcurve |
|---|---|---|---|---|---|---|---|
| A | 7905 | 7676 | 178 | 178 | 2.25% | 2.32% | 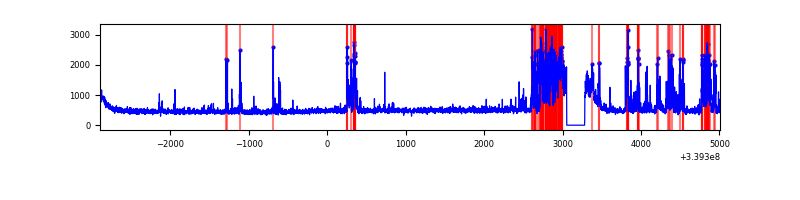 |
| B | 7904 | 7675 | 55 | 55 | 0.70% | 0.72% | 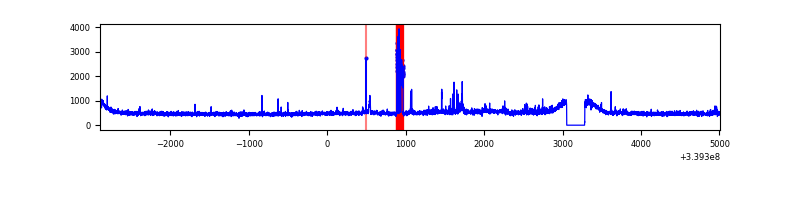 |
| C | 7904 | 7675 | 0 | 0 | 0.00% | 0.00% | 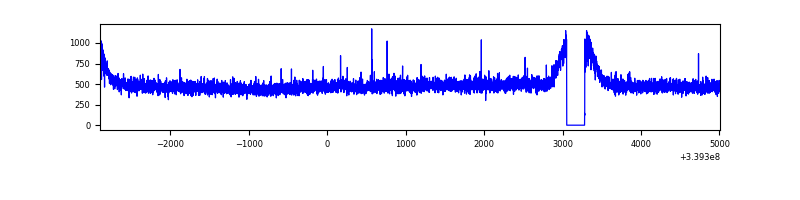 |
| D | 7904 | 7675 | 112 | 112 | 1.42% | 1.46% | 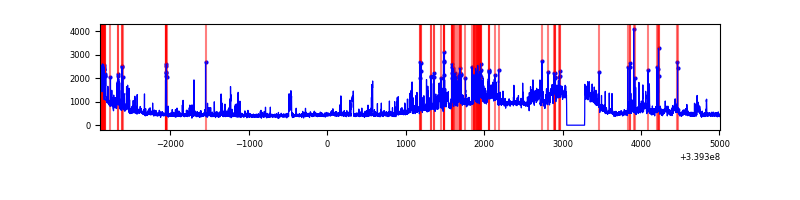 |
Top three noisy pixels from each quadrant. If the there are fewer than three noisy pixels in the level2.evt file, extra rows are filled as -1
| Pixel properties | Quadrant properties | ||||||
|---|---|---|---|---|---|---|---|
| Quadrant | DetID | PixID | Counts | Sigma | Mean | Median | Sigma |
| A | 14 | 235 | 1114359 | 5835.28 | 941 | 919 | 190.8 |
| A | 12 | 189 | 28595 | 145.04 | 941 | 919 | 190.8 |
| A | 6 | 16 | 11737 | 56.69 | 941 | 919 | 190.8 |
| B | 10 | 245 | 255265 | 1354.55 | 956 | 931 | 187.8 |
| B | 3 | 112 | 50654 | 264.82 | 956 | 931 | 187.8 |
| B | 10 | 246 | 28797 | 148.41 | 956 | 931 | 187.8 |
| C | 14 | 238 | 146248 | 656.8 | 928 | 934 | 221.2 |
| C | 15 | 208 | 10322 | 42.43 | 928 | 934 | 221.2 |
| C | 13 | 61 | 6311 | 24.3 | 928 | 934 | 221.2 |
| D | 13 | 172 | 866663 | 3672.92 | 914 | 895 | 235.7 |
| D | 1 | 52 | 743111 | 3148.76 | 914 | 895 | 235.7 |
| D | 7 | 38 | 259537 | 1097.26 | 914 | 895 | 235.7 |
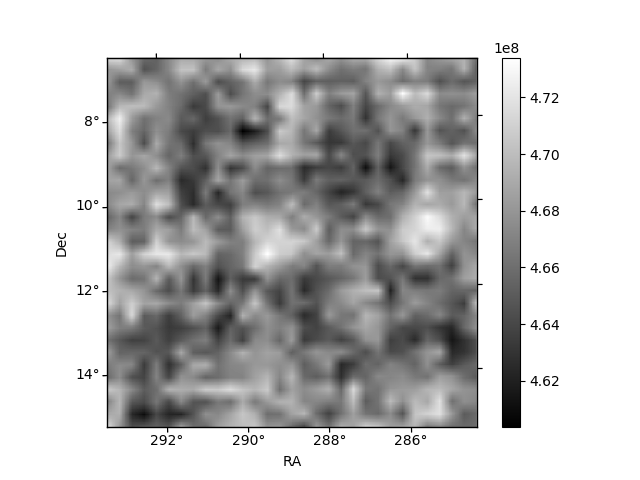
Histogram calculated using DETX and DETY for each event in the final _common_clean file
| Quadrant A | 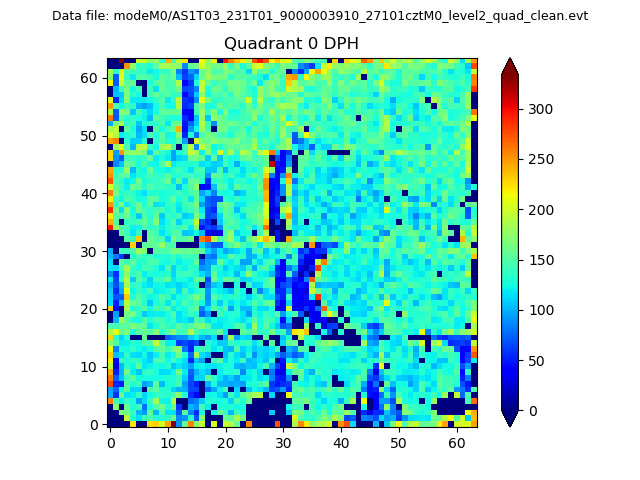 |
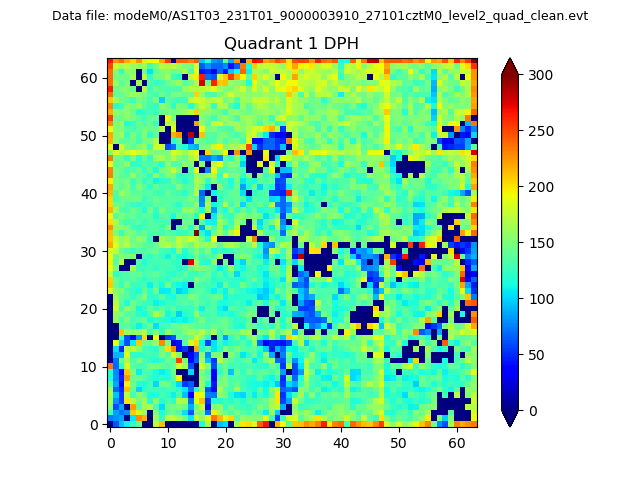 |
Quadrant B |
|---|---|---|---|
| Quadrant D |  |
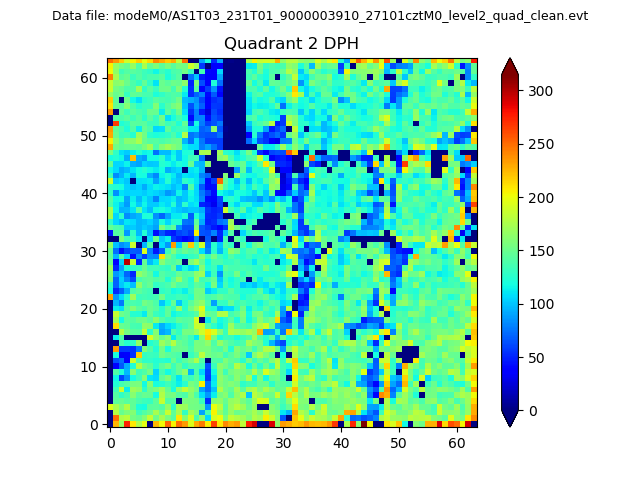 |
Quadrant C |
| Plot type | Count rate plots | Images |
|---|---|---|
| Comparison with Poisson distribution Blue bars denote a histogram of data divided into 1 sec bins. Red curve is a Poisson curve with rate = median count rate of data. |
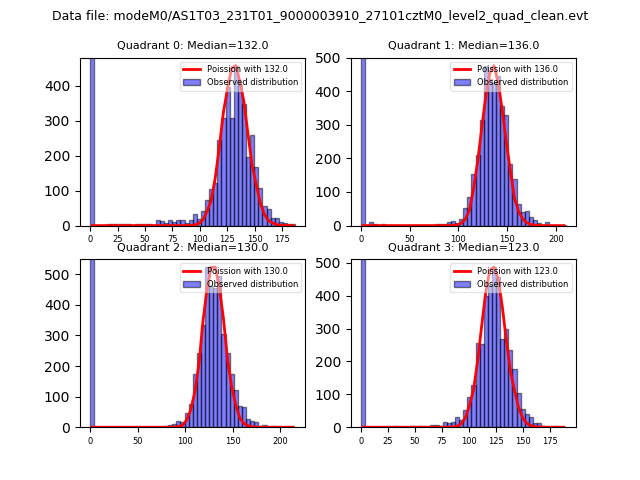 |
 |
| Quadrant-wise count rates Data is divided into 100 sec bins |
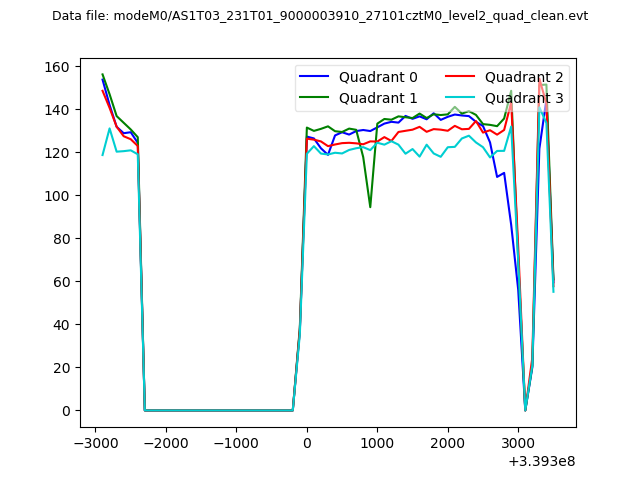 |
|
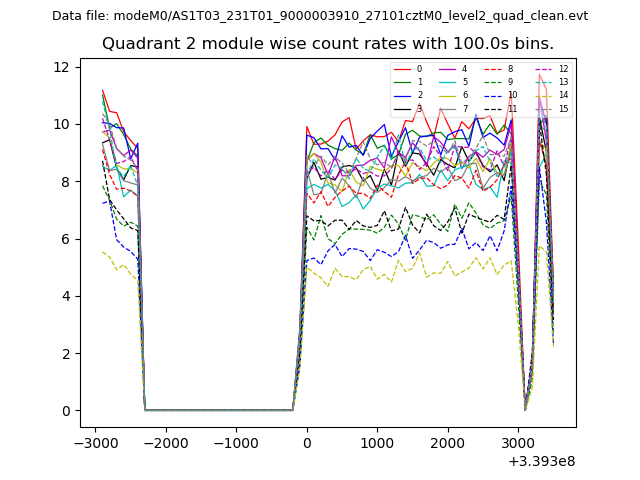
| Module-wise count rates for Quadrant A Data is divided into 100 sec bins |
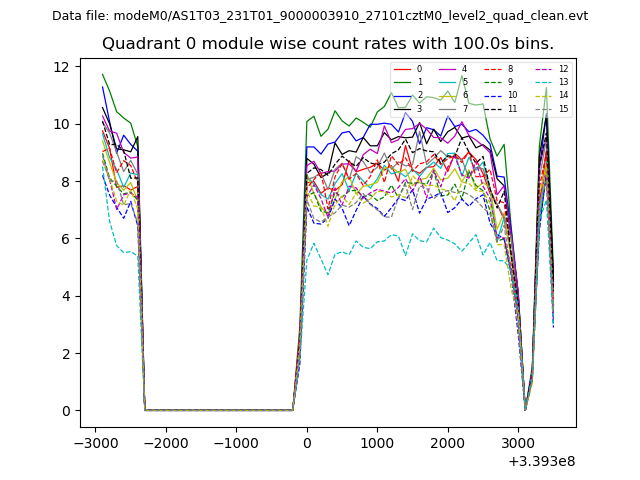 |
 |
| Module-wise count rates for Quadrant B Data is divided into 100 sec bins |
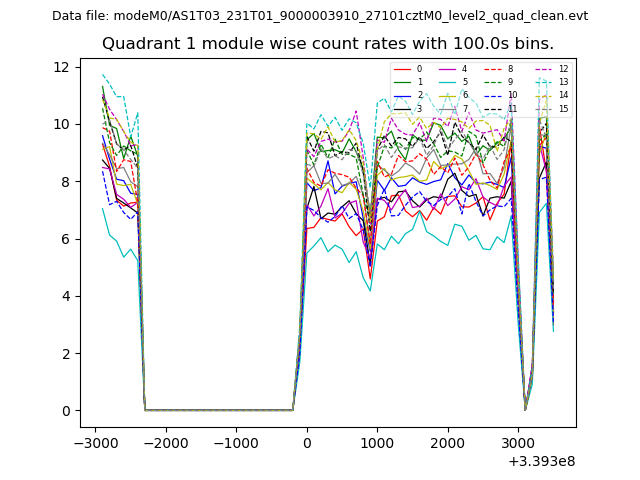 |
 |
| Module-wise count rates for Quadrant C Data is divided into 100 sec bins |
 |
 |
| Module-wise count rates for Quadrant D Data is divided into 100 sec bins |
 |
 |
| Parameter | Plot |
|---|---|
| CZT HV Monitor | 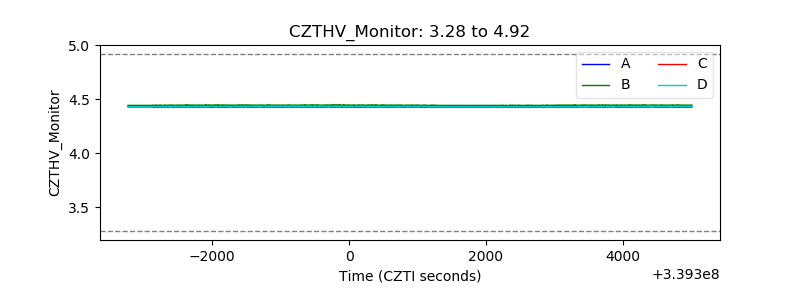 |
| D_VDD | 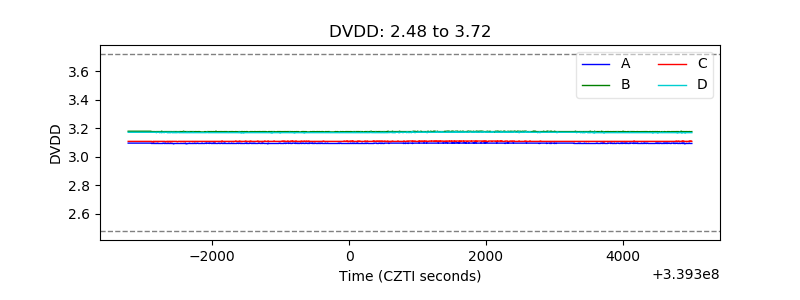 |
| Temperature 1 | 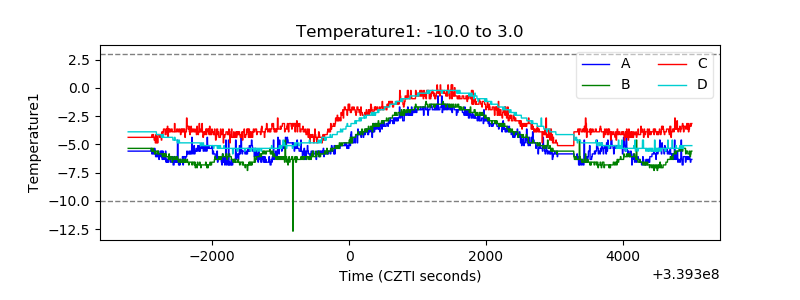 |
| Veto HV Monitor | 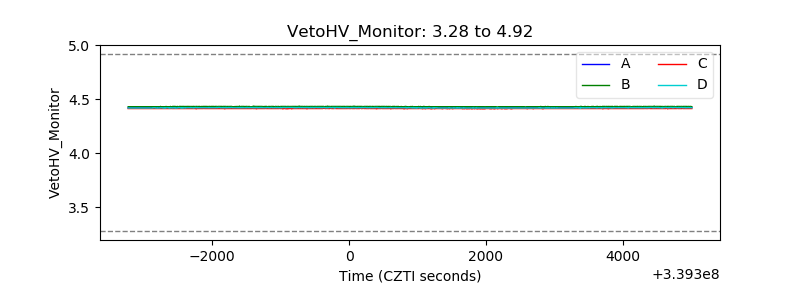 |
| Veto LLD | 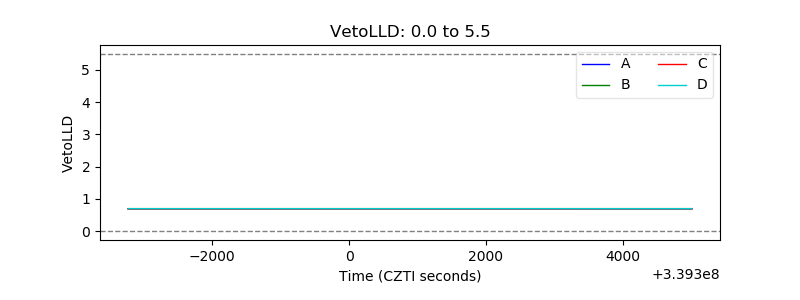 |
| Alpha Counter | 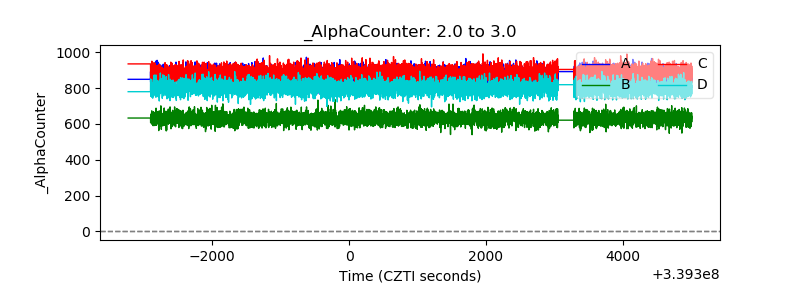 |
| _CPM_Rate | 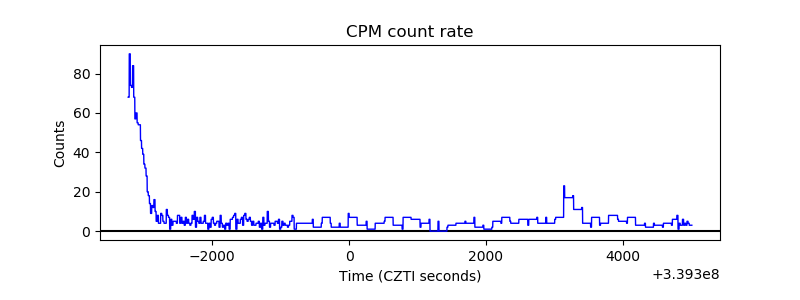 |
| CZT Counter | 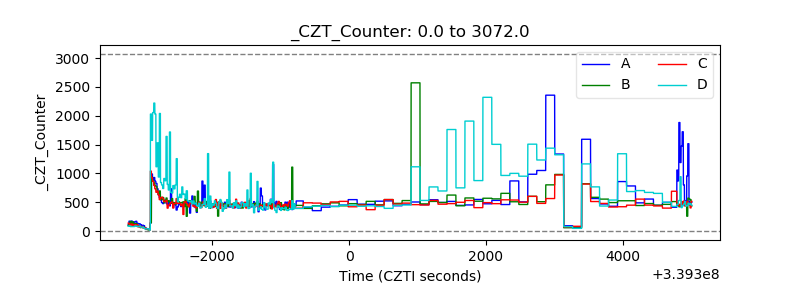 |
| +2.5 Volts monitor | 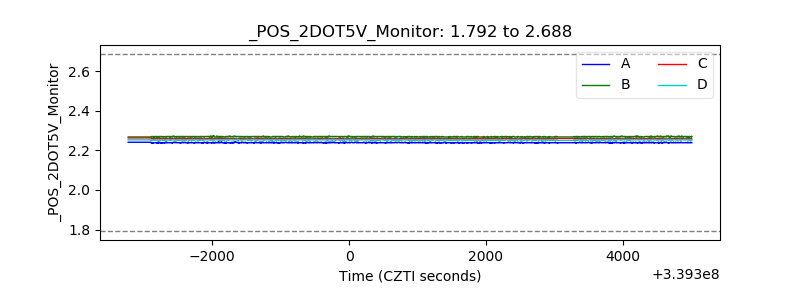 |
| +5 Volts monitor | 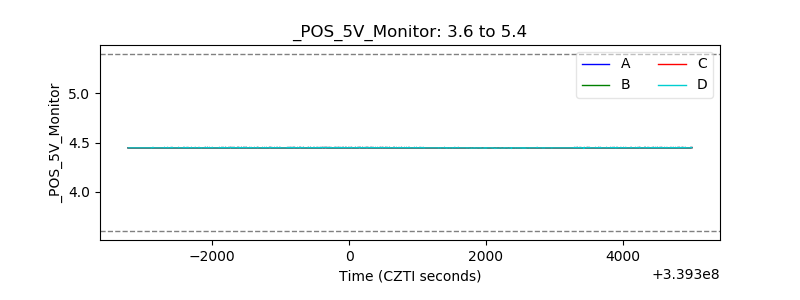 |
| _ROLL_ROT | 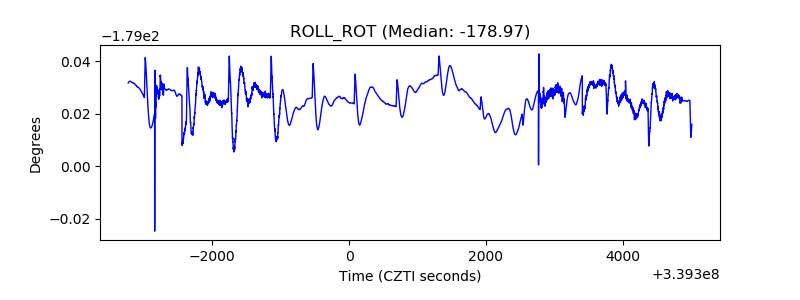 |
| _Roll_DEC | 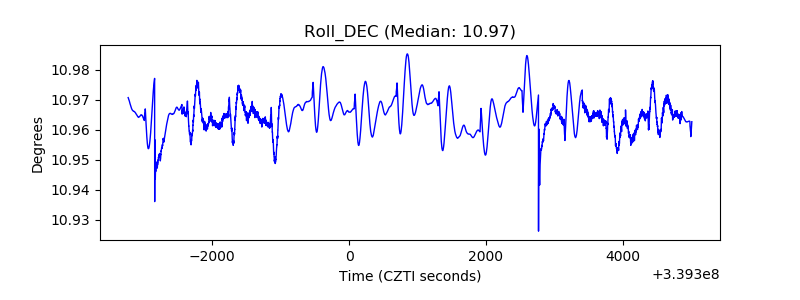 |
| _Roll_RA | 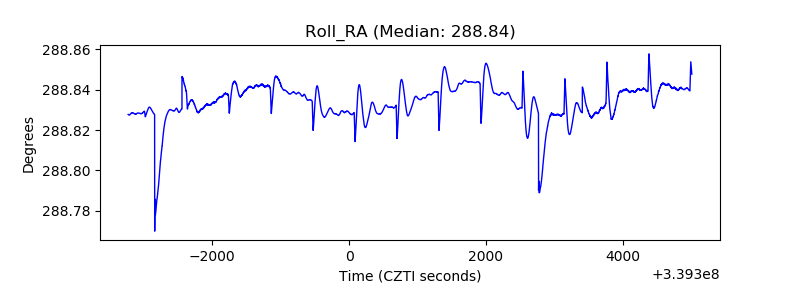 |
| Veto Counter | 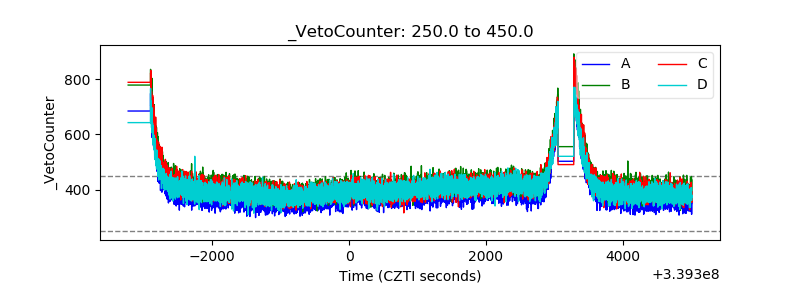 |