| Param | Original file | Final file |
|---|---|---|
| Filename | modeM0/AS1T03_231T01_9000003910_27102cztM0_level2.evt | modeM0/AS1T03_231T01_9000003910_27102cztM0_level2_quad_clean.evt |
| Size (bytes) | 655,355,520 | 80,303,040 |
| Size | 625.0 MB | 76.6 MB |
| Events in quadrant A | 5,986,586 | 468,353 |
| Events in quadrant B | 3,894,754 | 502,607 |
| Events in quadrant C | 3,732,310 | 482,720 |
| Events in quadrant D | 5,721,861 | 451,436 |
| Mode M0 | |||
|---|---|---|---|
| Quadrant | BADHDUFLAG | Total packets | Discarded packets |
| A | 0 | 22688 | 0 |
| B | 0 | 16168 | 0 |
| C | 0 | 15845 | 0 |
| D | 0 | 22166 | 0 |
| Mode M9 | |||
|---|---|---|---|
| Quadrant | BADHDUFLAG | Total packets | Discarded packets |
| A | 0 | 3 | 0 |
| B | 0 | 3 | 0 |
| C | 0 | 3 | 0 |
| D | 0 | 3 | 0 |
| Quadrant | Total seconds | Saturated seconds | Saturation percentage |
|---|---|---|---|
| A | 7565 | 765 | 10.112360% |
| B | 7565 | 190 | 2.511566% |
| C | 7565 | 163 | 2.154660% |
| D | 7565 | 314 | 4.150694% |
Noise dominated data is calculated using 1-second bins in cleaned event files. If a bin has >2000 counts, and if more than 50% of those come from <1% of pixels, then it is considered to be noise-dominated and hence unusable.
| Quadrant | # 1 sec bins | Bins with >0 counts | Bins with >2000 counts | High rate bins dominated by noise | Noise dominated (total time) | Noise dominated (detector-on time) | Marked lightcurve |
|---|---|---|---|---|---|---|---|
| A | 7855 | 7566 | 415 | 415 | 5.28% | 5.49% | 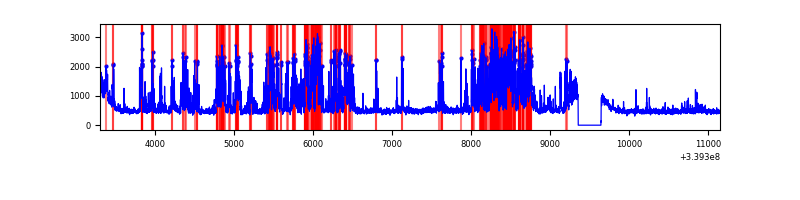 |
| B | 7855 | 7566 | 3 | 3 | 0.04% | 0.04% | 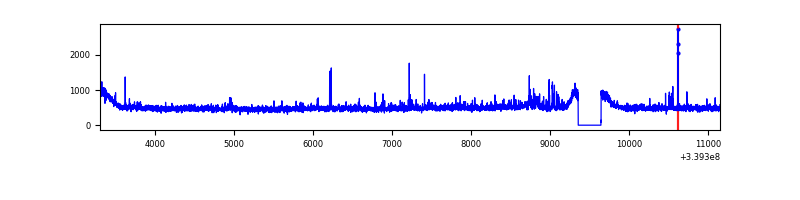 |
| C | 7855 | 7566 | 2 | 2 | 0.03% | 0.03% | 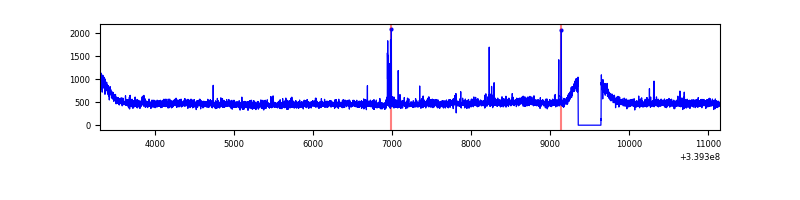 |
| D | 7855 | 7566 | 219 | 219 | 2.79% | 2.89% | 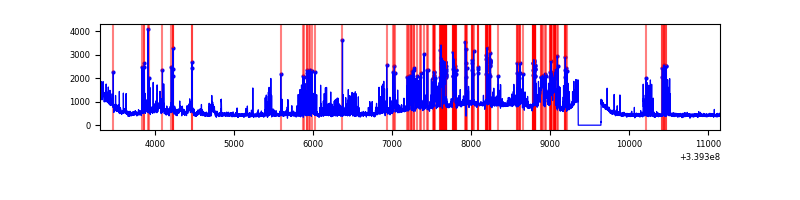 |
Top three noisy pixels from each quadrant. If the there are fewer than three noisy pixels in the level2.evt file, extra rows are filled as -1
| Pixel properties | Quadrant properties | ||||||
|---|---|---|---|---|---|---|---|
| Quadrant | DetID | PixID | Counts | Sigma | Mean | Median | Sigma |
| A | 14 | 235 | 2416335 | 13016.42 | 916 | 896 | 185.6 |
| A | 12 | 189 | 37410 | 196.77 | 916 | 896 | 185.6 |
| A | 13 | 254 | 11089 | 54.93 | 916 | 896 | 185.6 |
| B | 10 | 245 | 91509 | 488.11 | 942 | 915 | 185.6 |
| B | 3 | 112 | 44129 | 232.83 | 942 | 915 | 185.6 |
| B | 10 | 246 | 25410 | 131.98 | 942 | 915 | 185.6 |
| C | 14 | 238 | 142611 | 655.51 | 908 | 913 | 216.2 |
| C | 15 | 208 | 42326 | 191.58 | 908 | 913 | 216.2 |
| C | 2 | 16 | 13669 | 59.01 | 908 | 913 | 216.2 |
| D | 1 | 52 | 1036743 | 4396.51 | 893 | 873 | 235.6 |
| D | 13 | 172 | 734430 | 3113.41 | 893 | 873 | 235.6 |
| D | 7 | 38 | 293472 | 1241.87 | 893 | 873 | 235.6 |
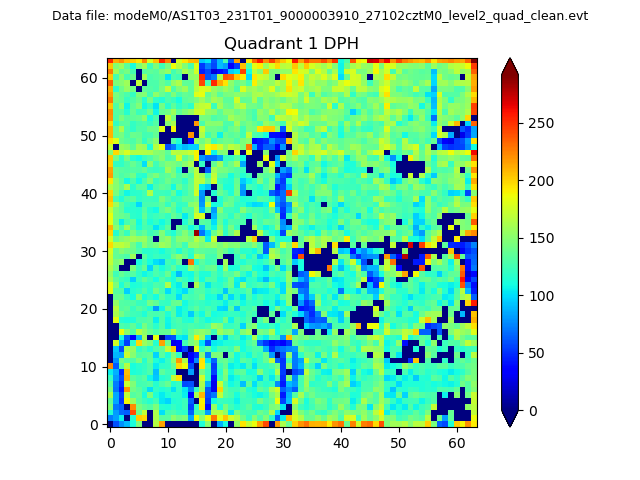
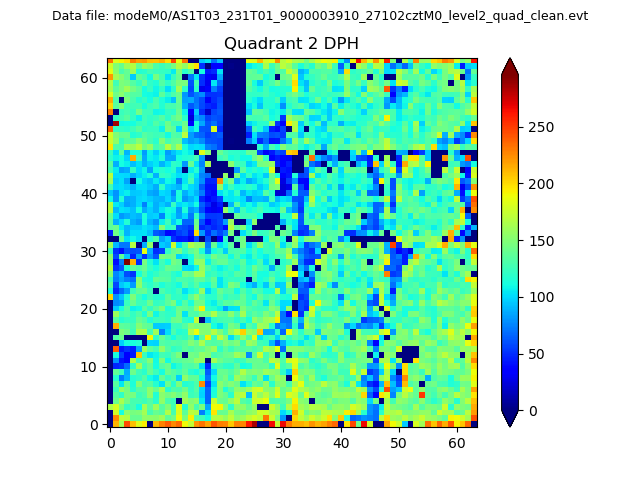
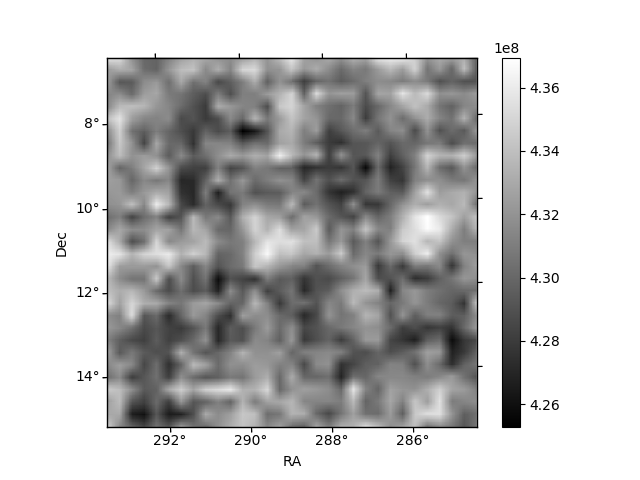
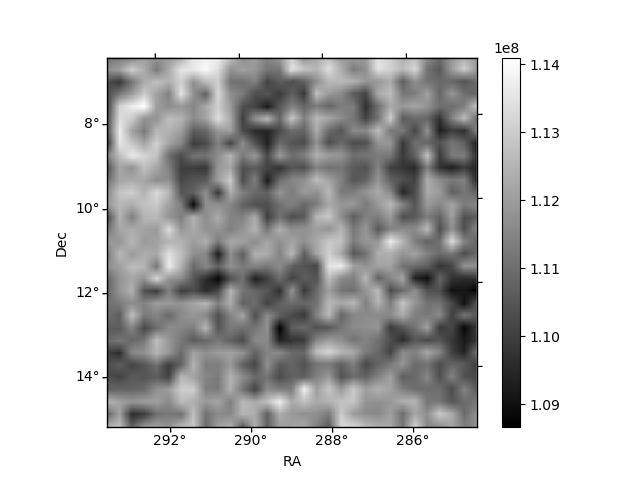
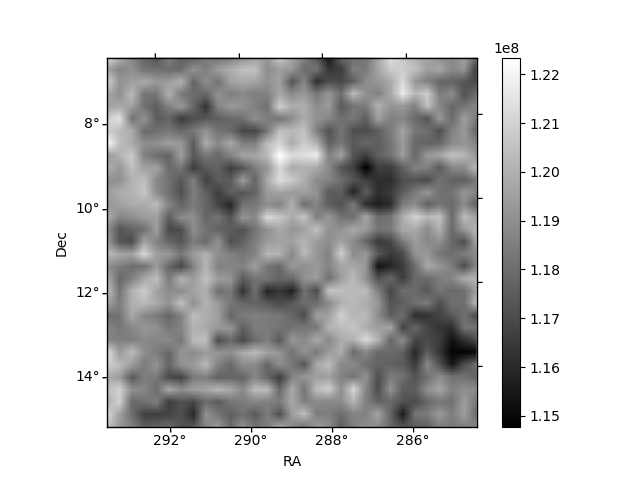
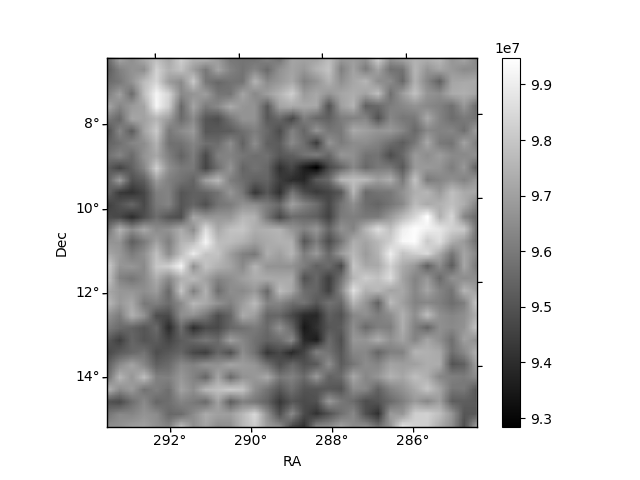
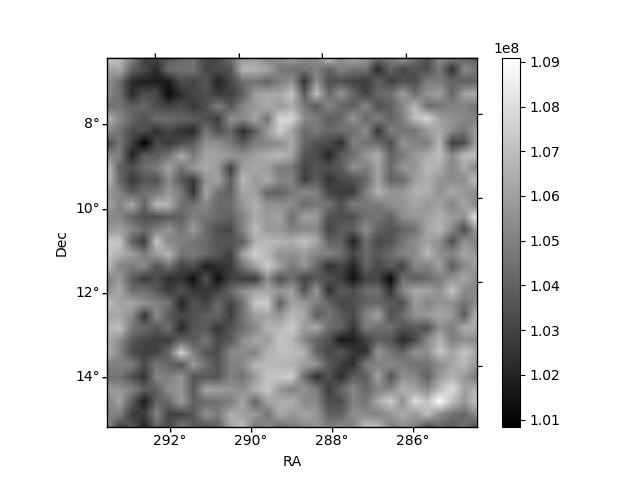
Histogram calculated using DETX and DETY for each event in the final _common_clean file
| Quadrant A |  |
 |
Quadrant B |
|---|---|---|---|
| Quadrant D | 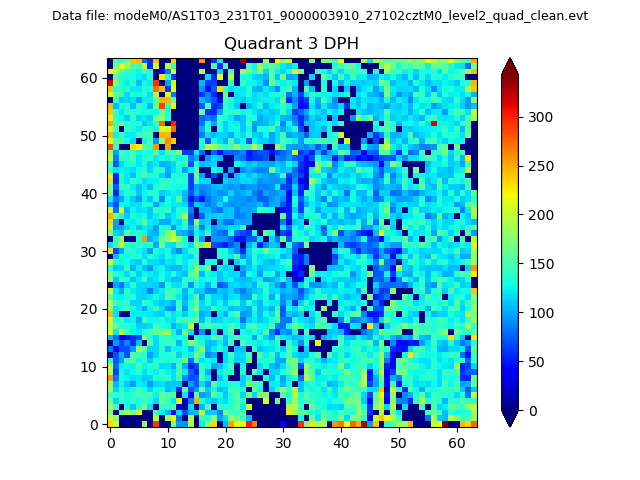 |
 |
Quadrant C |
| Plot type | Count rate plots | Images |
|---|---|---|
| Comparison with Poisson distribution Blue bars denote a histogram of data divided into 1 sec bins. Red curve is a Poisson curve with rate = median count rate of data. |
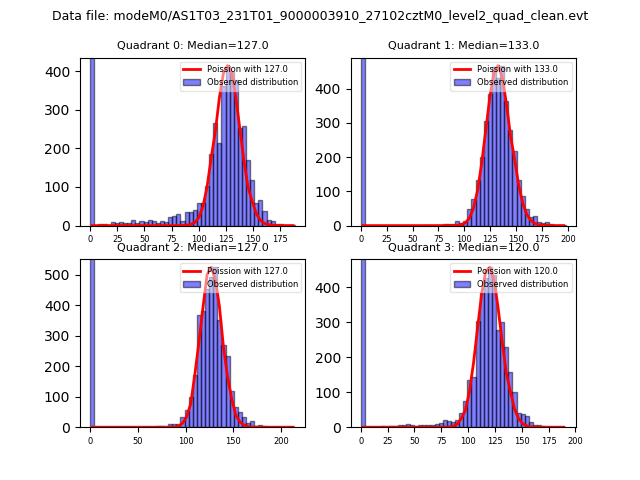 |
 |
| Quadrant-wise count rates Data is divided into 100 sec bins |
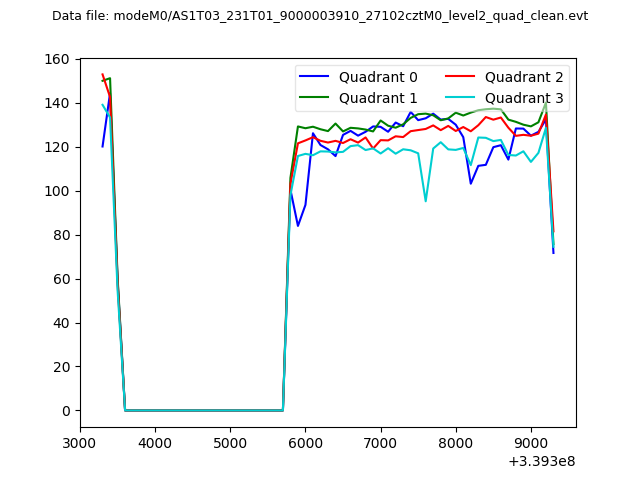 |
|
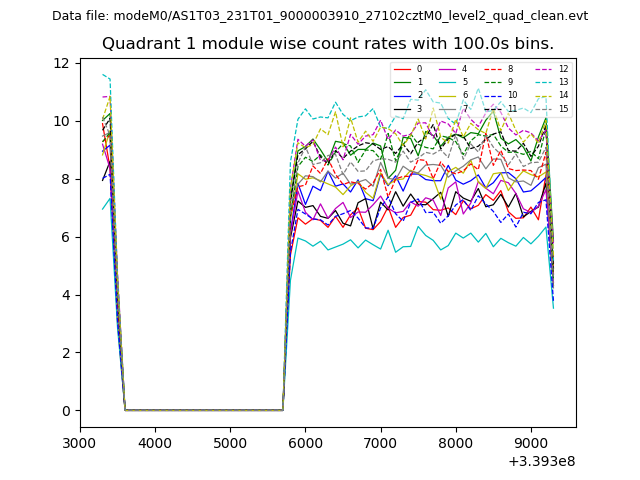
| Module-wise count rates for Quadrant A Data is divided into 100 sec bins |
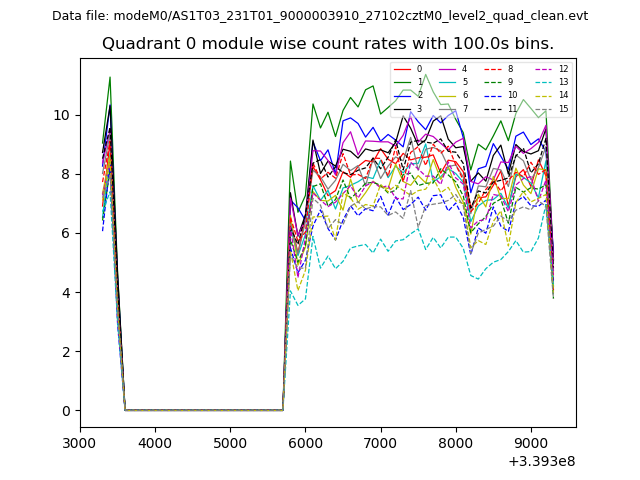 |
 |
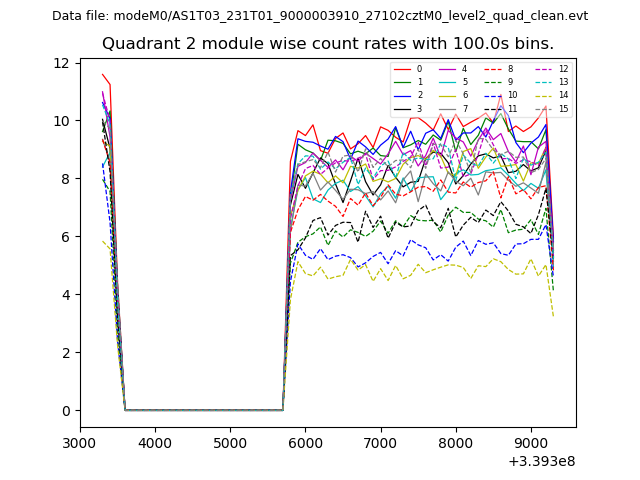
| Module-wise count rates for Quadrant B Data is divided into 100 sec bins |
 |
 |
| Module-wise count rates for Quadrant C Data is divided into 100 sec bins |
 |
 |
| Module-wise count rates for Quadrant D Data is divided into 100 sec bins |
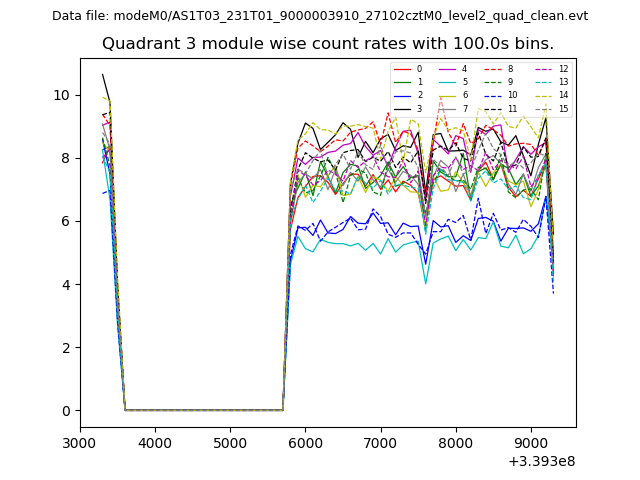 |
 |
| Parameter | Plot |
|---|---|
| CZT HV Monitor | 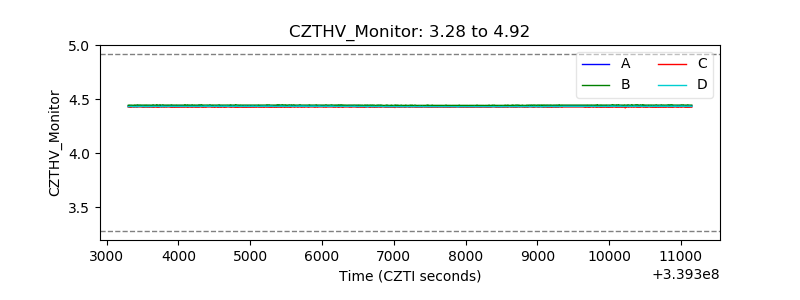 |
| D_VDD | 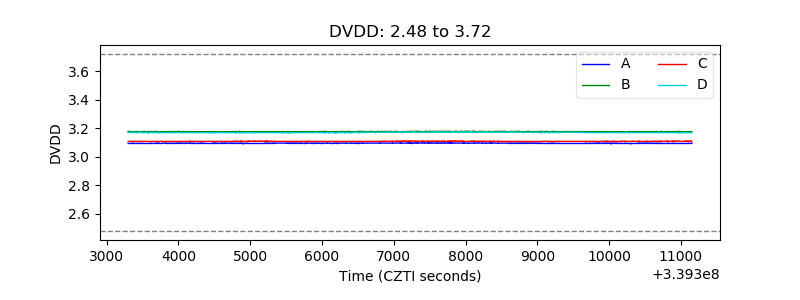 |
| Temperature 1 |  |
| Veto HV Monitor | 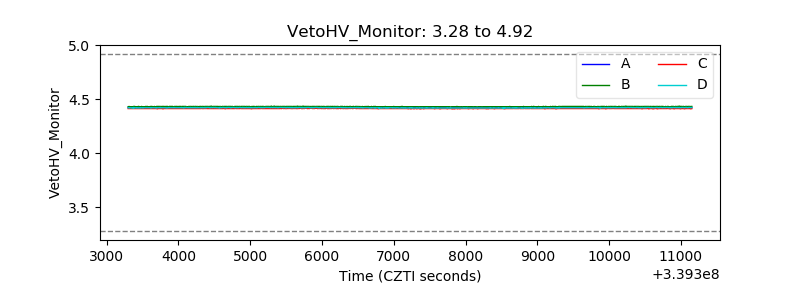 |
| Veto LLD | 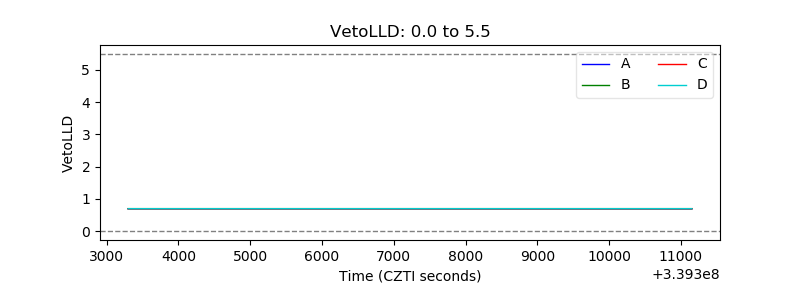 |
| Alpha Counter | 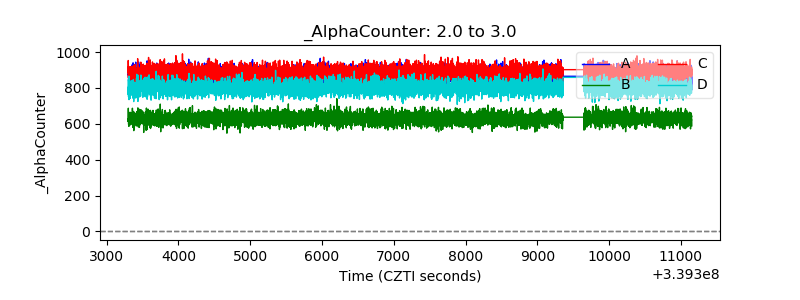 |
| _CPM_Rate | 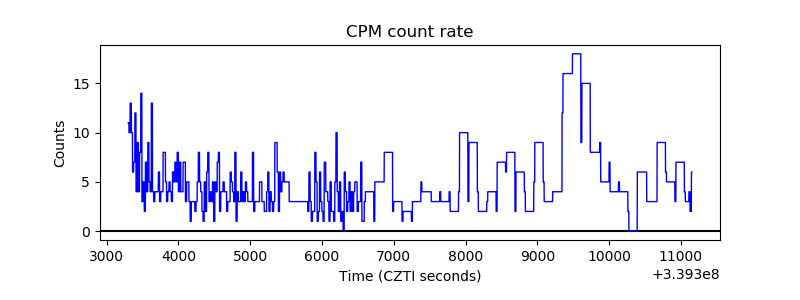 |
| CZT Counter | 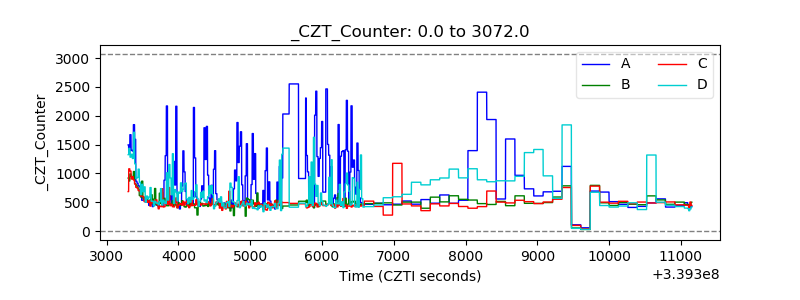 |
| +2.5 Volts monitor |  |
| +5 Volts monitor |  |
| _ROLL_ROT | 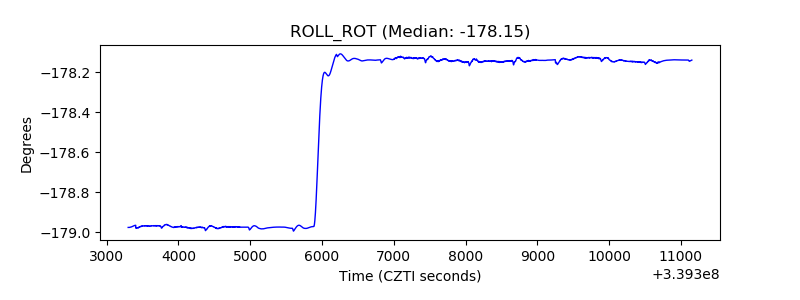 |
| _Roll_DEC | 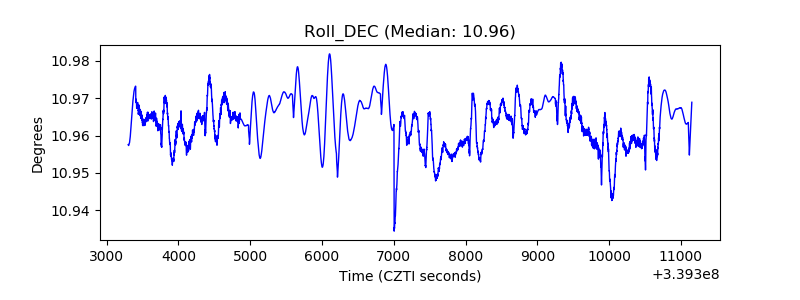 |
| _Roll_RA | 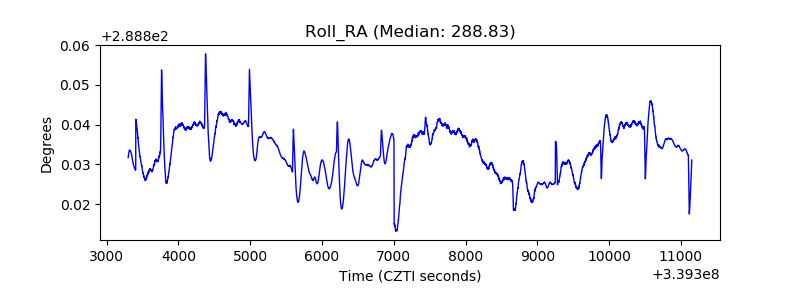 |
| Veto Counter | 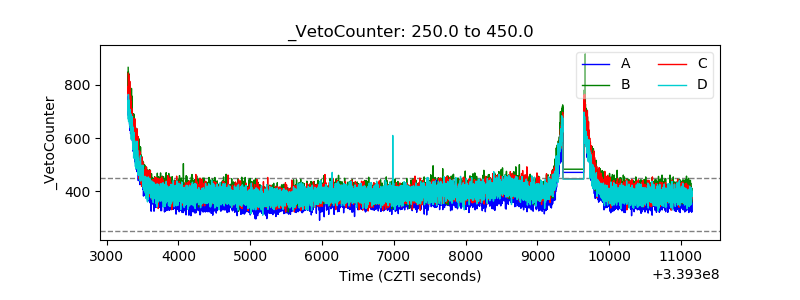 |