| Param | Original file | Final file |
|---|---|---|
| Filename | modeM0/AS1T03_231T01_9000003910_27105cztM0_level2.evt | modeM0/AS1T03_231T01_9000003910_27105cztM0_level2_quad_clean.evt |
| Size (bytes) | 1,569,576,960 | 234,662,400 |
| Size | 1.5 GB | 223.8 MB |
| Events in quadrant A | 10,651,965 | 1,499,051 |
| Events in quadrant B | 11,334,114 | 1,491,553 |
| Events in quadrant C | 9,111,426 | 1,465,807 |
| Events in quadrant D | 15,167,246 | 1,352,729 |
| Mode M0 | |||
|---|---|---|---|
| Quadrant | BADHDUFLAG | Total packets | Discarded packets |
| A | 0 | 43384 | 0 |
| B | 0 | 45229 | 0 |
| C | 0 | 38816 | 0 |
| D | 0 | 57594 | 0 |
| Mode M9 | |||
|---|---|---|---|
| Quadrant | BADHDUFLAG | Total packets | Discarded packets |
| A | 0 | 22 | 0 |
| B | 0 | 22 | 0 |
| C | 0 | 22 | 0 |
| D | 0 | 22 | 0 |
| Quadrant | Total seconds | Saturated seconds | Saturation percentage |
|---|---|---|---|
| A | 18839 | 546 | 2.898243% |
| B | 18840 | 751 | 3.986200% |
| C | 18840 | 355 | 1.884289% |
| D | 18840 | 1386 | 7.356688% |
Noise dominated data is calculated using 1-second bins in cleaned event files. If a bin has >2000 counts, and if more than 50% of those come from <1% of pixels, then it is considered to be noise-dominated and hence unusable.
| Quadrant | # 1 sec bins | Bins with >0 counts | Bins with >2000 counts | High rate bins dominated by noise | Noise dominated (total time) | Noise dominated (detector-on time) | Marked lightcurve |
|---|---|---|---|---|---|---|---|
| A | 20984 | 18843 | 189 | 189 | 0.90% | 1.00% | 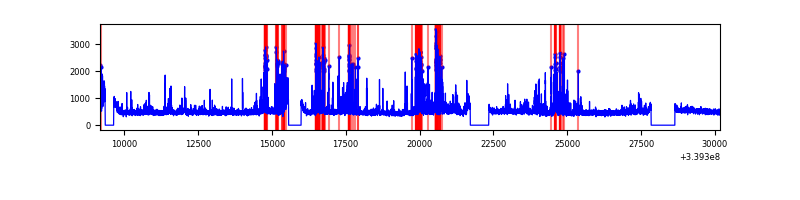 |
| B | 20985 | 18844 | 365 | 365 | 1.74% | 1.94% | 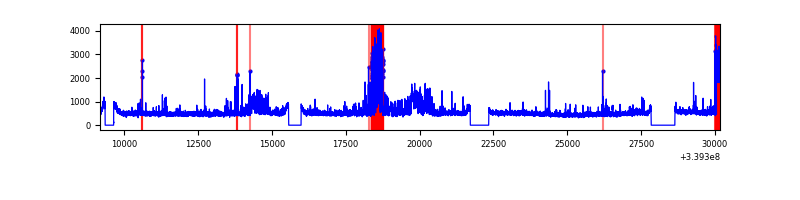 |
| C | 20985 | 18844 | 1 | 1 | 0.00% | 0.01% | 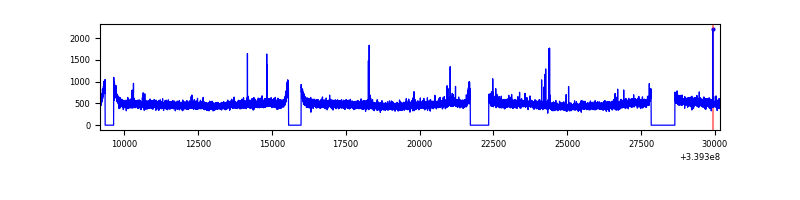 |
| D | 20985 | 18844 | 1244 | 1244 | 5.93% | 6.60% | 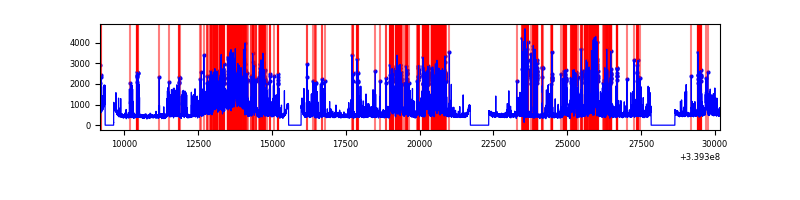 |
Top three noisy pixels from each quadrant. If the there are fewer than three noisy pixels in the level2.evt file, extra rows are filled as -1
| Pixel properties | Quadrant properties | ||||||
|---|---|---|---|---|---|---|---|
| Quadrant | DetID | PixID | Counts | Sigma | Mean | Median | Sigma |
| A | 14 | 235 | 1647113 | 3532.85 | 2316 | 2264 | 465.6 |
| A | 12 | 189 | 55448 | 114.23 | 2316 | 2264 | 465.6 |
| A | 13 | 254 | 28926 | 57.27 | 2316 | 2264 | 465.6 |
| B | 0 | 189 | 1908368 | 4296.8 | 2285 | 2225 | 443.6 |
| B | 3 | 112 | 287626 | 643.35 | 2285 | 2225 | 443.6 |
| B | 10 | 245 | 87274 | 191.72 | 2285 | 2225 | 443.6 |
| C | 14 | 238 | 351159 | 663.63 | 2230 | 2244 | 525.8 |
| C | 15 | 208 | 51804 | 94.26 | 2230 | 2244 | 525.8 |
| C | 2 | 16 | 24651 | 42.62 | 2230 | 2244 | 525.8 |
| D | 1 | 52 | 4162833 | 7183.03 | 2183 | 2136 | 579.2 |
| D | 7 | 38 | 1687929 | 2910.35 | 2183 | 2136 | 579.2 |
| D | 2 | 250 | 452014 | 776.67 | 2183 | 2136 | 579.2 |
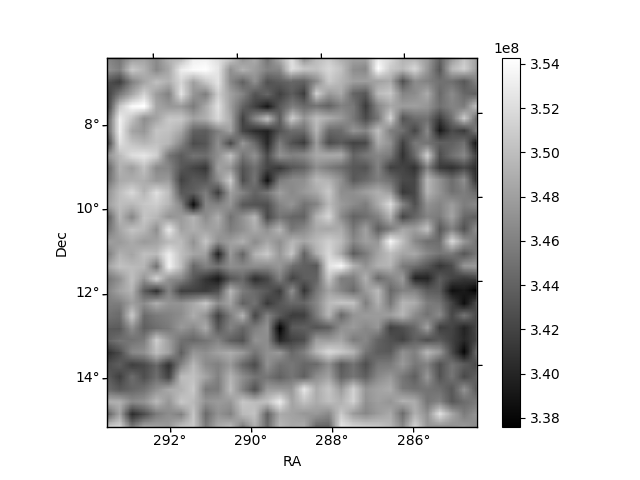
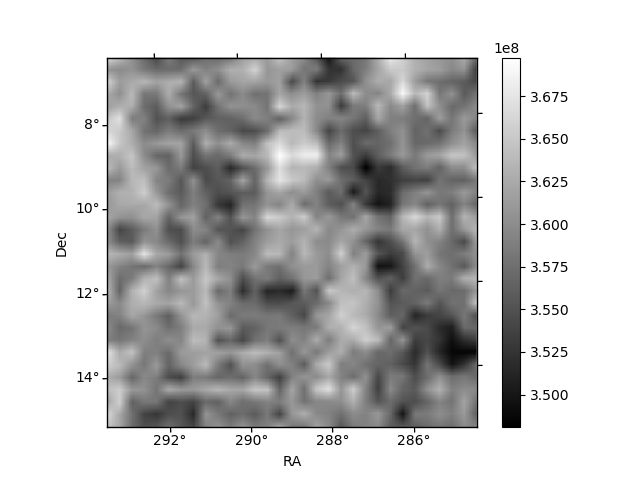
Histogram calculated using DETX and DETY for each event in the final _common_clean file
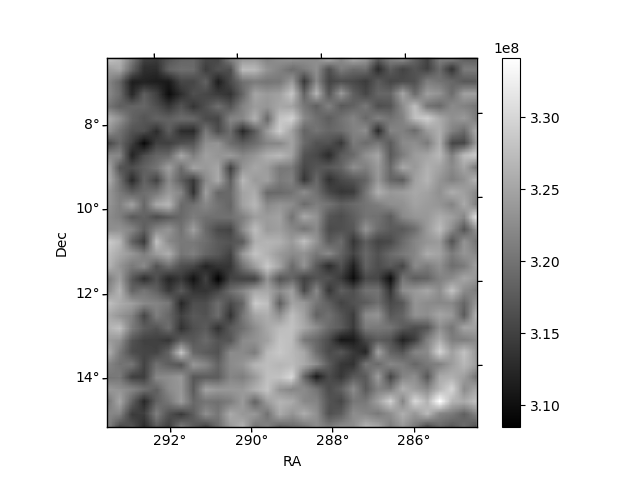
| Quadrant A |  |
 |
Quadrant B |
|---|---|---|---|
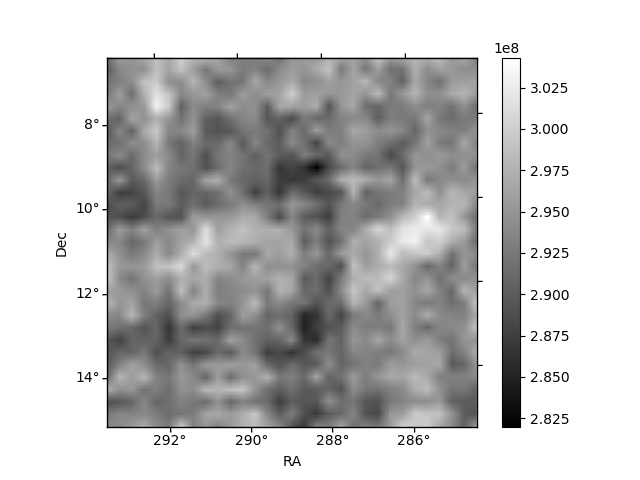
| Quadrant D |  |
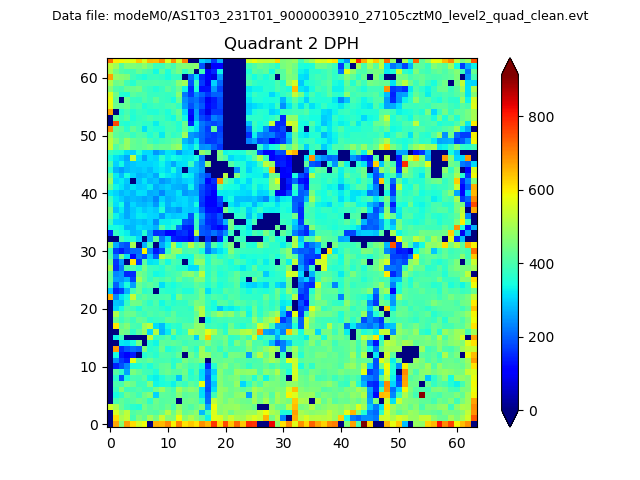 |
Quadrant C |
| Plot type | Count rate plots | Images |
|---|---|---|
| Comparison with Poisson distribution Blue bars denote a histogram of data divided into 1 sec bins. Red curve is a Poisson curve with rate = median count rate of data. |
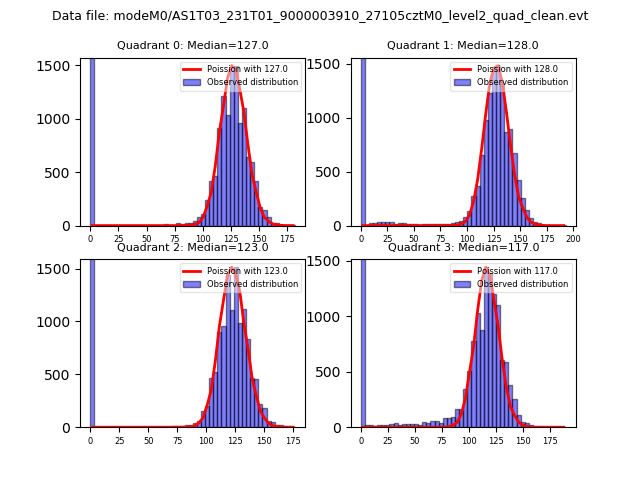 |
 |
| Quadrant-wise count rates Data is divided into 100 sec bins |
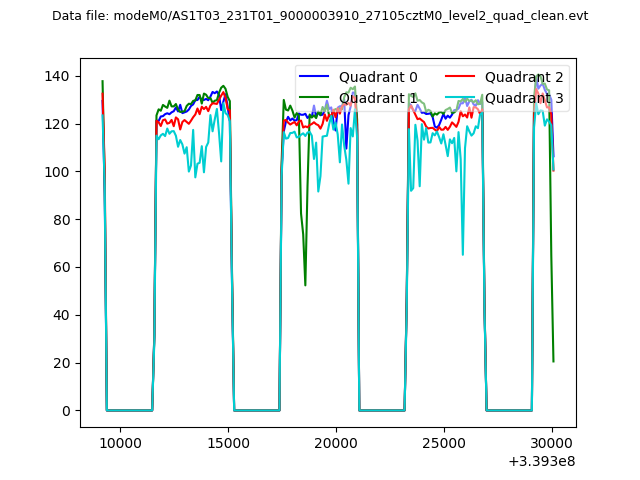 |
|
| Module-wise count rates for Quadrant A Data is divided into 100 sec bins |
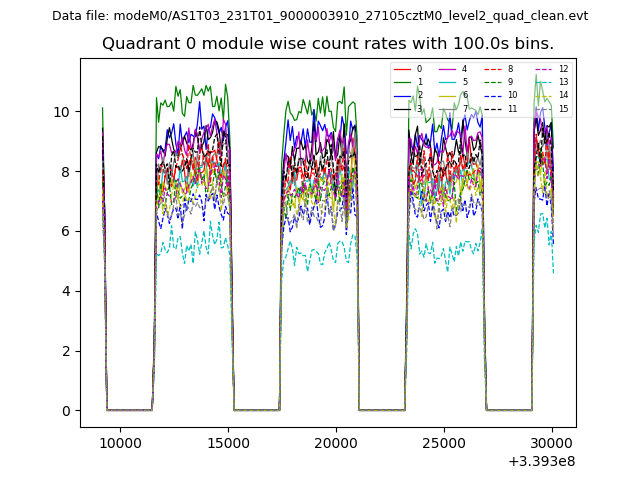 |
 |
| Module-wise count rates for Quadrant B Data is divided into 100 sec bins |
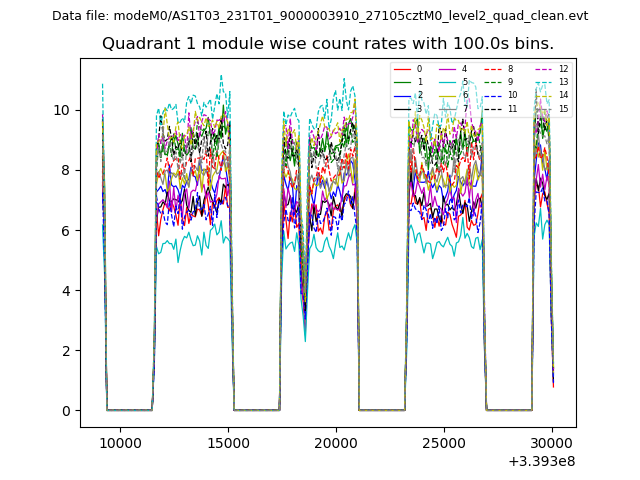 |
 |
| Module-wise count rates for Quadrant C Data is divided into 100 sec bins |
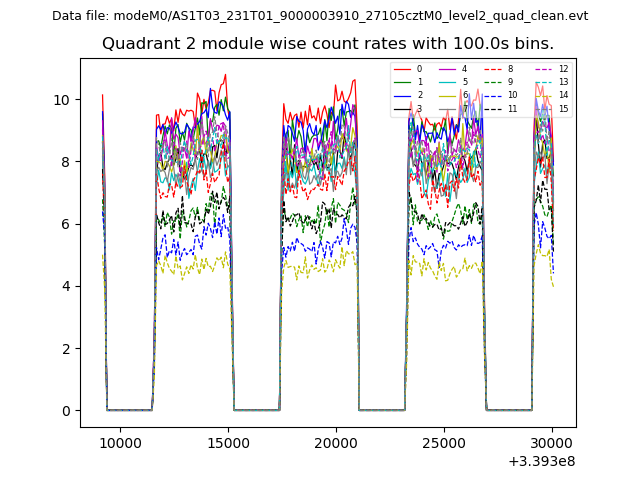 |
 |
| Module-wise count rates for Quadrant D Data is divided into 100 sec bins |
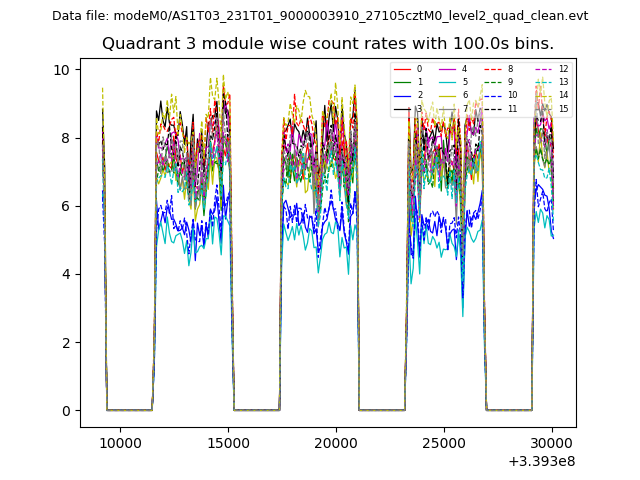 |
 |
| Parameter | Plot |
|---|---|
| CZT HV Monitor | 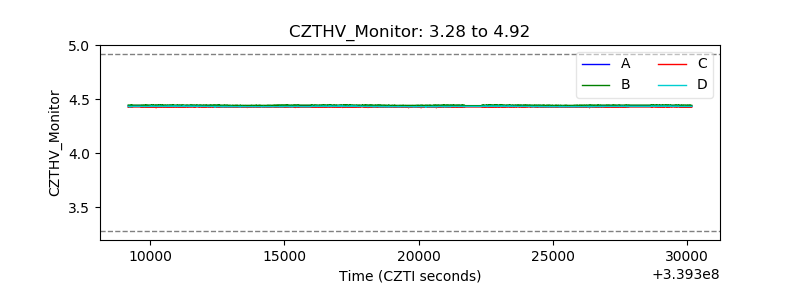 |
| D_VDD | 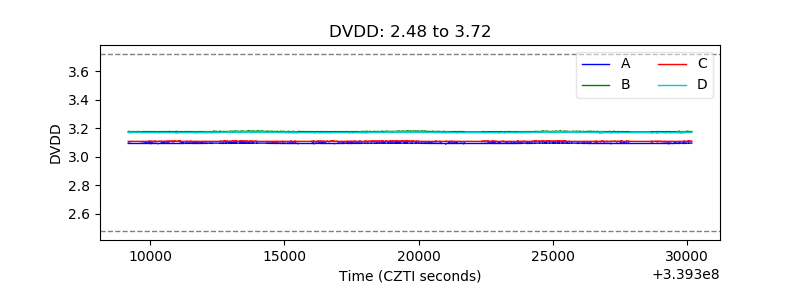 |
| Temperature 1 | 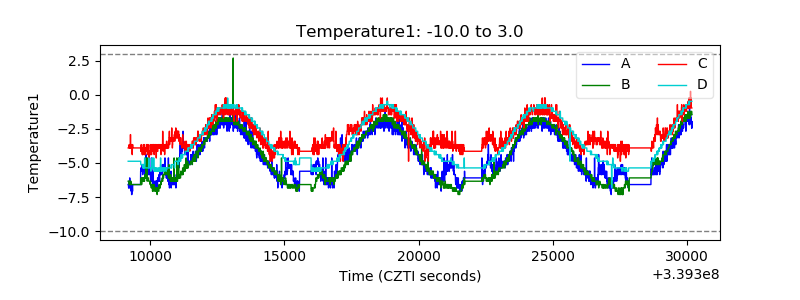 |
| Veto HV Monitor | 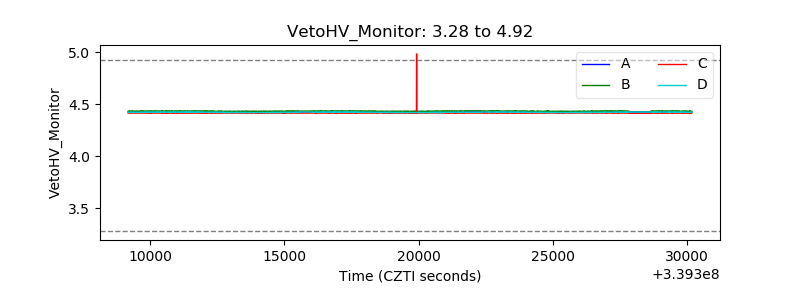 |
| Veto LLD | 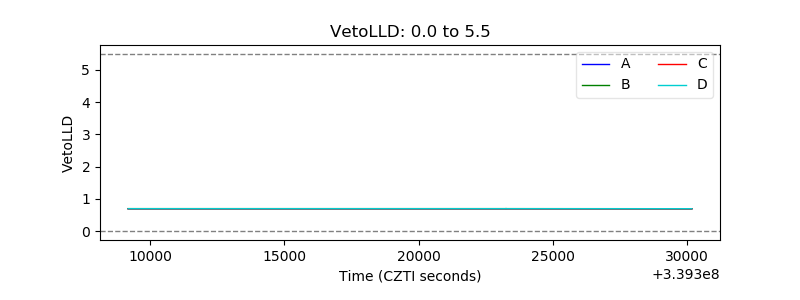 |
| Alpha Counter | 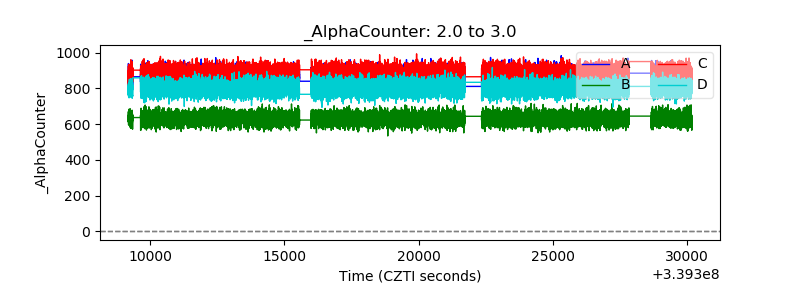 |
| _CPM_Rate | 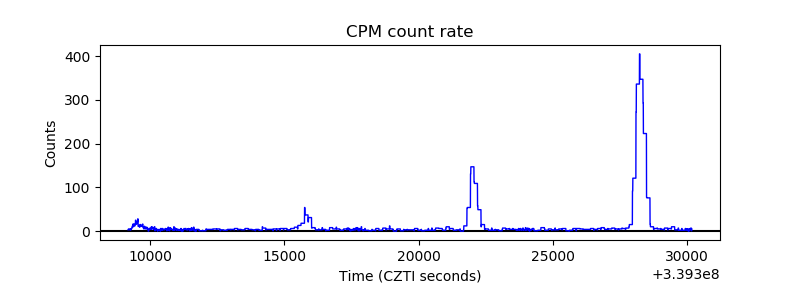 |
| CZT Counter | 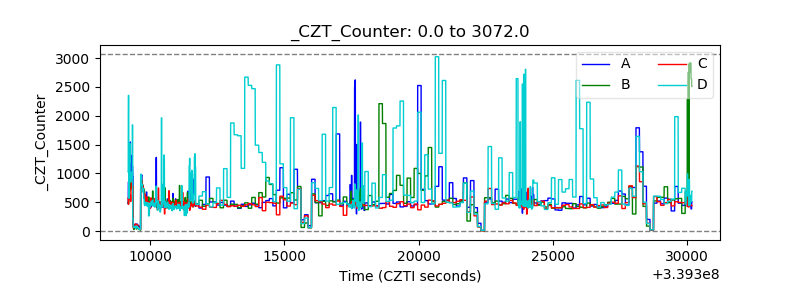 |
| +2.5 Volts monitor |  |
| +5 Volts monitor | 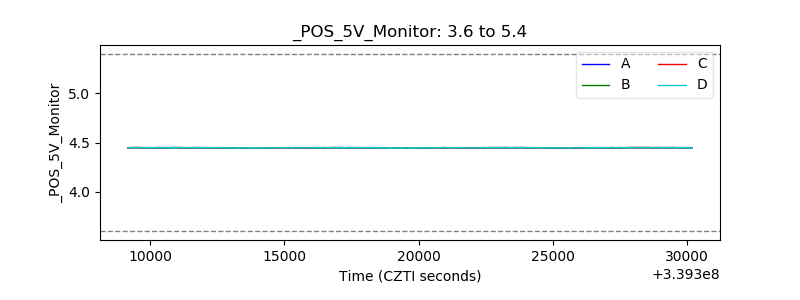 |
| _ROLL_ROT | 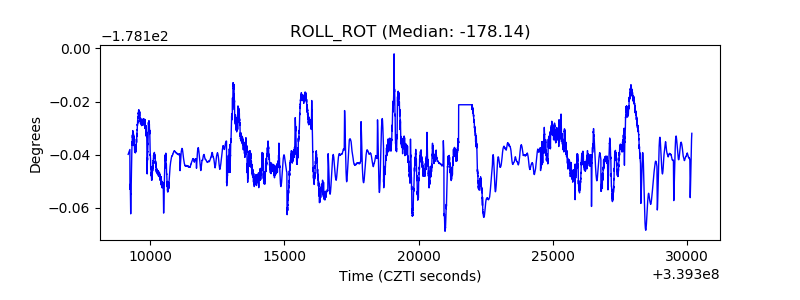 |
| _Roll_DEC | 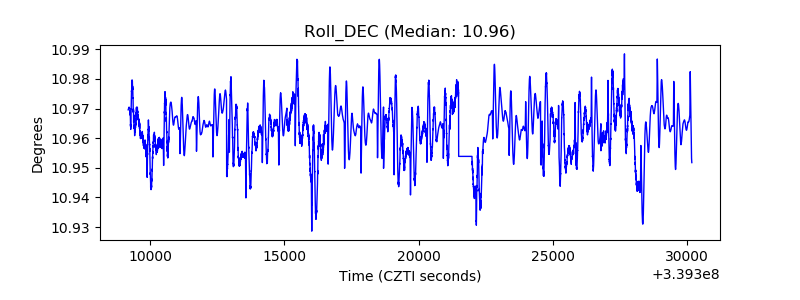 |
| _Roll_RA | 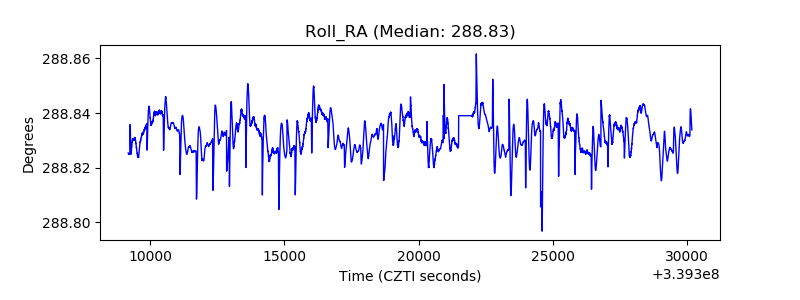 |
| Veto Counter | 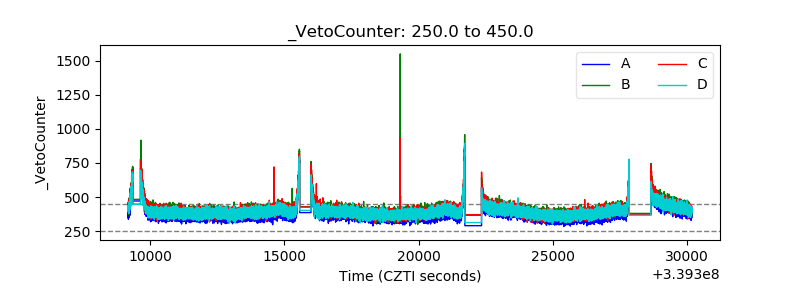 |