| Param | Original file | Final file |
|---|---|---|
| Filename | modeM0/AS1T03_231T01_9000003910_27106cztM0_level2.evt | modeM0/AS1T03_231T01_9000003910_27106cztM0_level2_quad_clean.evt |
| Size (bytes) | 548,588,160 | 94,973,760 |
| Size | 523.2 MB | 90.6 MB |
| Events in quadrant A | 3,251,459 | 643,557 |
| Events in quadrant B | 3,879,437 | 619,060 |
| Events in quadrant C | 3,044,426 | 615,928 |
| Events in quadrant D | 6,015,960 | 561,933 |
| Mode M0 | |||
|---|---|---|---|
| Quadrant | BADHDUFLAG | Total packets | Discarded packets |
| A | 0 | 13621 | 0 |
| B | 0 | 15437 | 0 |
| C | 0 | 12965 | 0 |
| D | 0 | 22071 | 0 |
| Mode M9 | |||
|---|---|---|---|
| Quadrant | BADHDUFLAG | Total packets | Discarded packets |
| A | 0 | 10 | 0 |
| B | 0 | 10 | 0 |
| C | 0 | 10 | 0 |
| D | 0 | 10 | 0 |
| Quadrant | Total seconds | Saturated seconds | Saturation percentage |
|---|---|---|---|
| A | 6238 | 70 | 1.122155% |
| B | 6239 | 371 | 5.946466% |
| C | 6239 | 69 | 1.105946% |
| D | 6239 | 793 | 12.710370% |
Noise dominated data is calculated using 1-second bins in cleaned event files. If a bin has >2000 counts, and if more than 50% of those come from <1% of pixels, then it is considered to be noise-dominated and hence unusable.
| Quadrant | # 1 sec bins | Bins with >0 counts | Bins with >2000 counts | High rate bins dominated by noise | Noise dominated (total time) | Noise dominated (detector-on time) | Marked lightcurve |
|---|---|---|---|---|---|---|---|
| A | 7173 | 6239 | 6 | 6 | 0.08% | 0.10% | 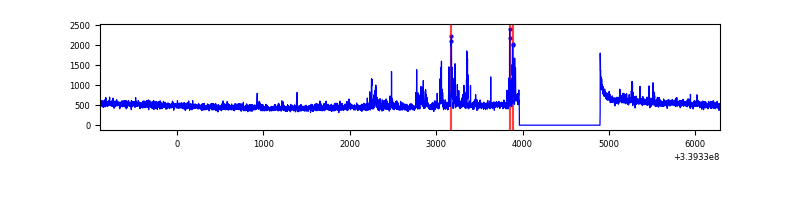 |
| B | 7174 | 6240 | 304 | 304 | 4.24% | 4.87% | 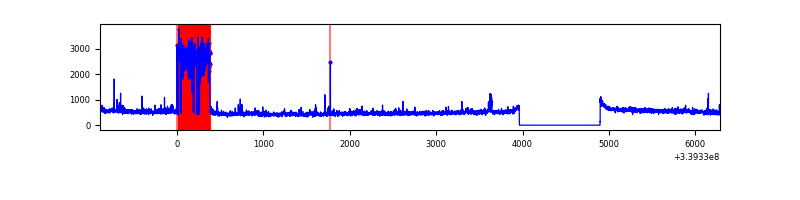 |
| C | 7174 | 6240 | 1 | 1 | 0.01% | 0.02% | 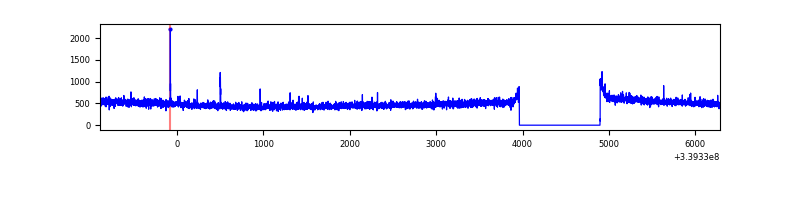 |
| D | 7174 | 6240 | 793 | 793 | 11.05% | 12.71% | 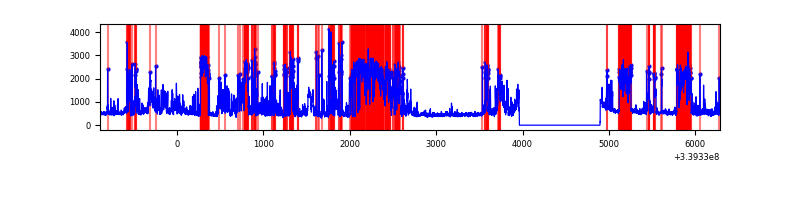 |
Top three noisy pixels from each quadrant. If the there are fewer than three noisy pixels in the level2.evt file, extra rows are filled as -1
| Pixel properties | Quadrant properties | ||||||
|---|---|---|---|---|---|---|---|
| Quadrant | DetID | PixID | Counts | Sigma | Mean | Median | Sigma |
| A | 14 | 235 | 190630 | 1191.55 | 786 | 770 | 159.3 |
| A | 12 | 189 | 22630 | 137.19 | 786 | 770 | 159.3 |
| A | 13 | 254 | 9265 | 53.31 | 786 | 770 | 159.3 |
| B | 0 | 189 | 811004 | 5596.54 | 751 | 732 | 144.8 |
| B | 3 | 112 | 78843 | 539.51 | 751 | 732 | 144.8 |
| B | 12 | 111 | 17524 | 115.98 | 751 | 732 | 144.8 |
| C | 14 | 238 | 118554 | 666.71 | 747 | 751 | 176.7 |
| C | 15 | 208 | 14807 | 79.55 | 747 | 751 | 176.7 |
| C | 13 | 61 | 5011 | 24.11 | 747 | 751 | 176.7 |
| D | 1 | 52 | 2838561 | 16109.43 | 730 | 712 | 176.2 |
| D | 7 | 38 | 248977 | 1409.31 | 730 | 712 | 176.2 |
| D | 2 | 250 | 150313 | 849.23 | 730 | 712 | 176.2 |
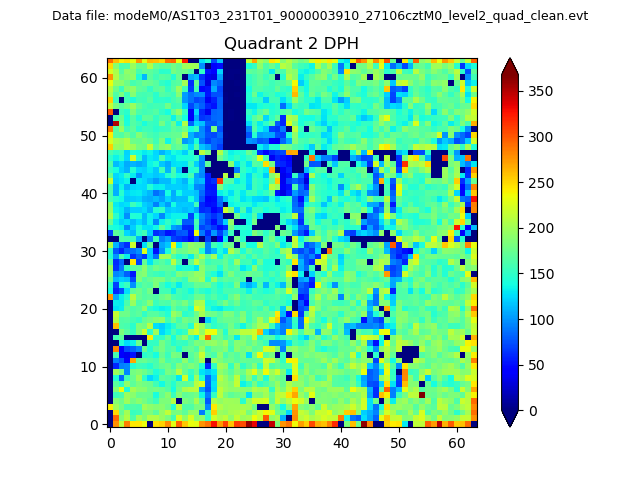
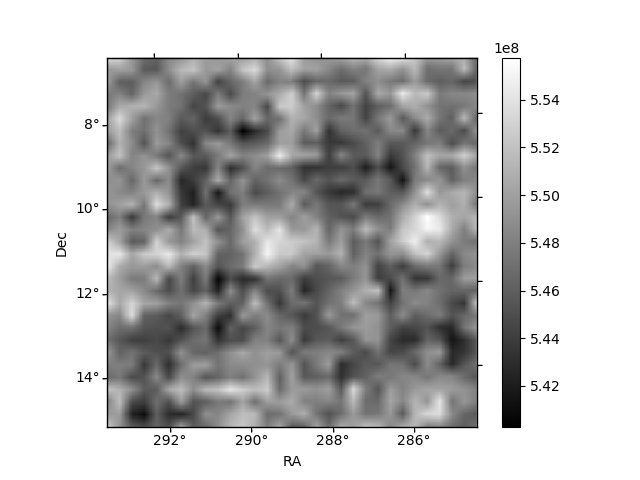
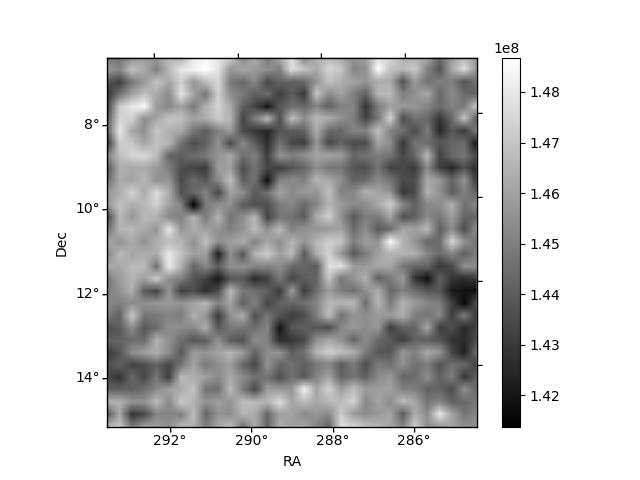
Histogram calculated using DETX and DETY for each event in the final _common_clean file
| Quadrant A | 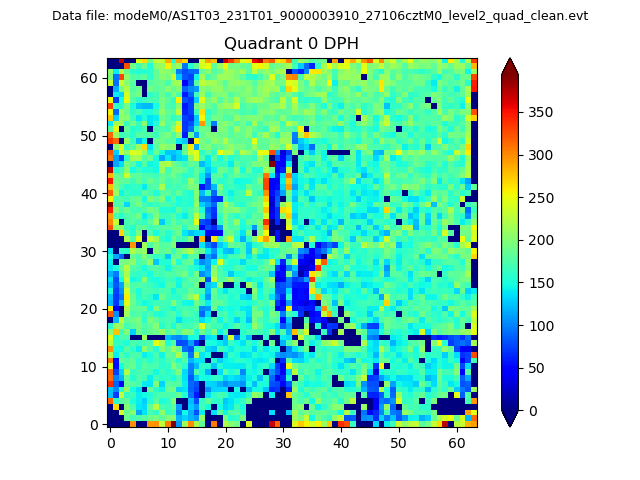 |
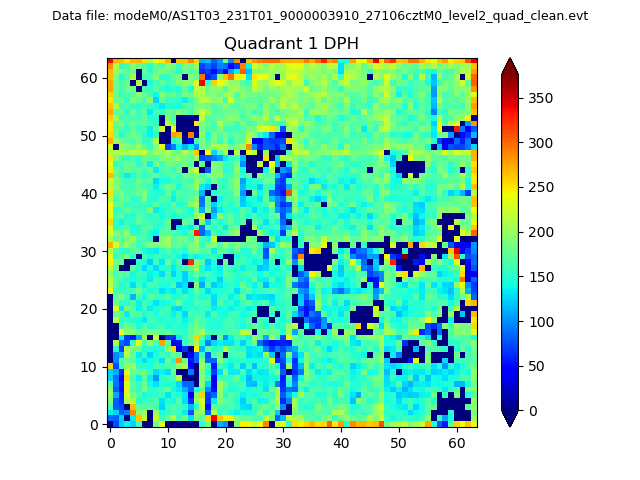 |
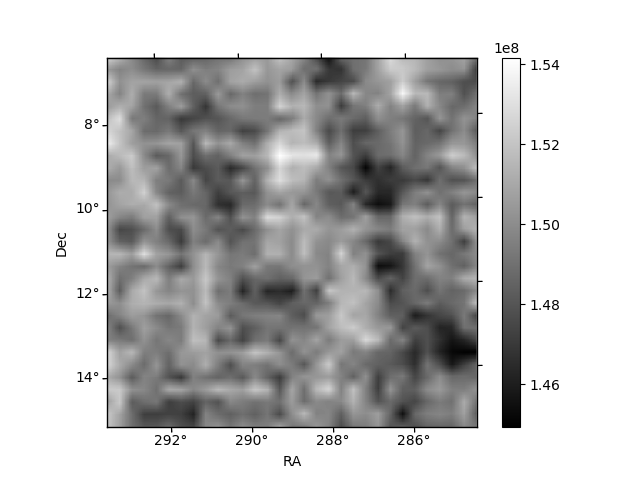
Quadrant B |
|---|---|---|---|
| Quadrant D | 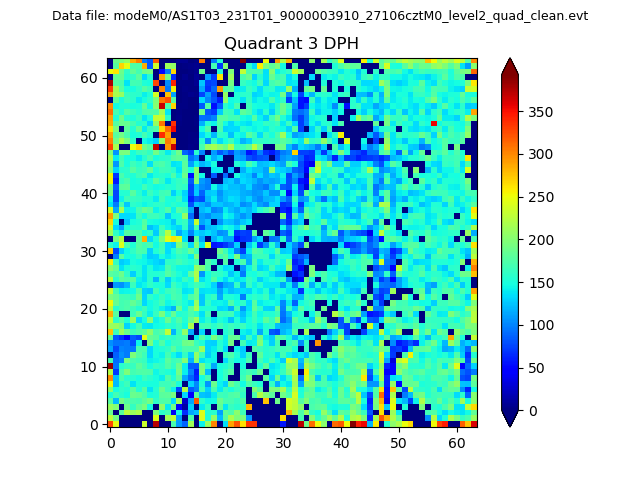 |
 |
Quadrant C |
| Plot type | Count rate plots | Images |
|---|---|---|
| Comparison with Poisson distribution Blue bars denote a histogram of data divided into 1 sec bins. Red curve is a Poisson curve with rate = median count rate of data. |
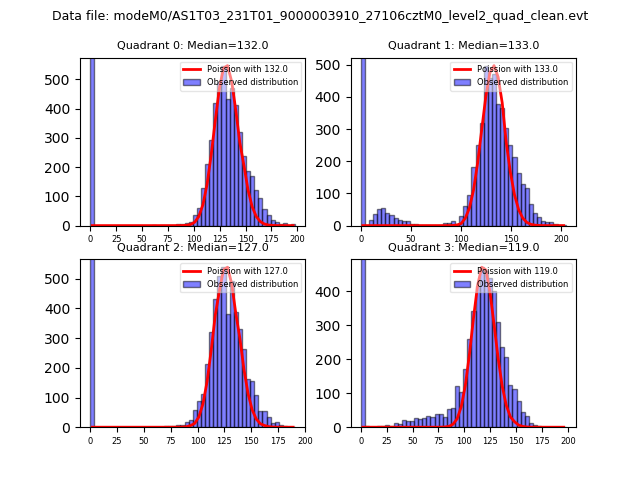 |
 |
| Quadrant-wise count rates Data is divided into 100 sec bins |
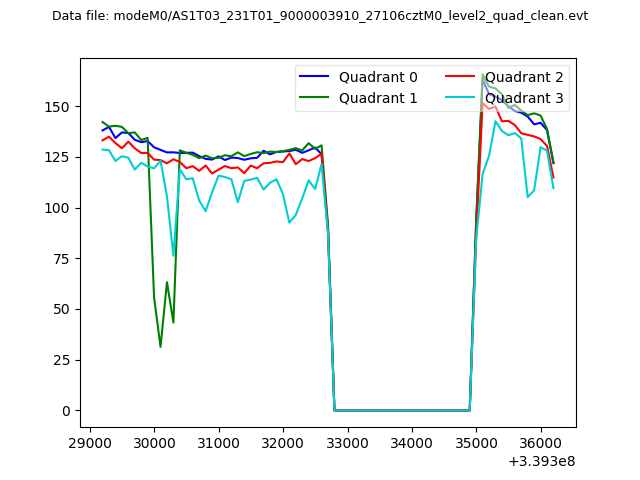 |
|
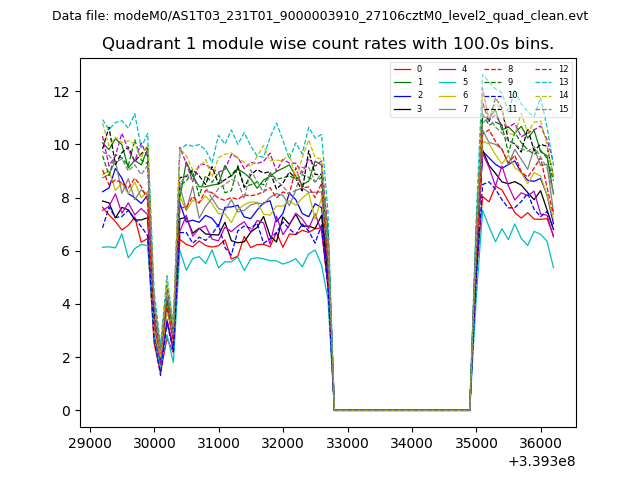
| Module-wise count rates for Quadrant A Data is divided into 100 sec bins |
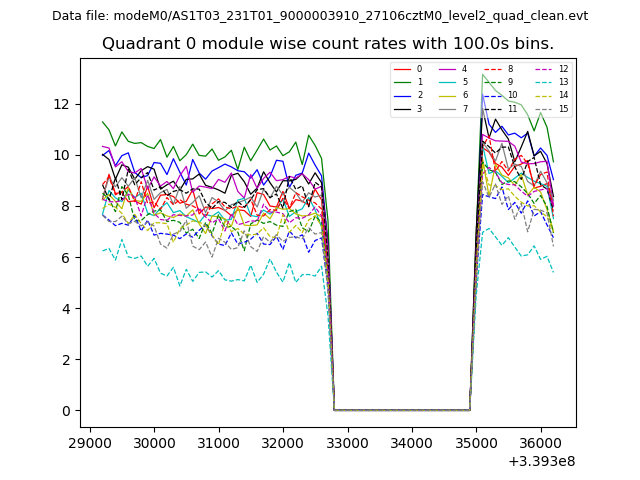 |
 |
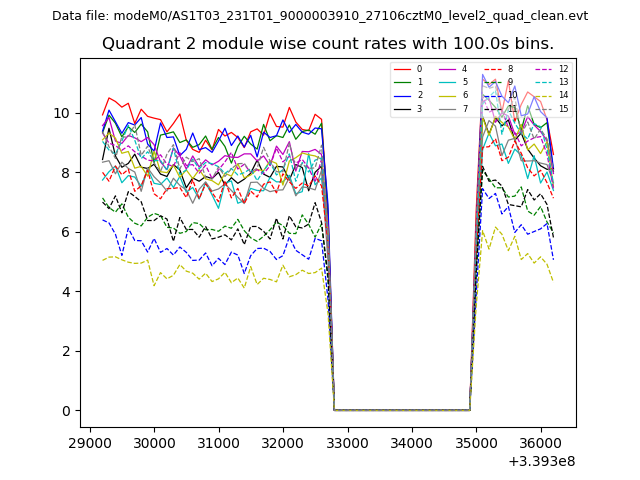
| Module-wise count rates for Quadrant B Data is divided into 100 sec bins |
 |
 |
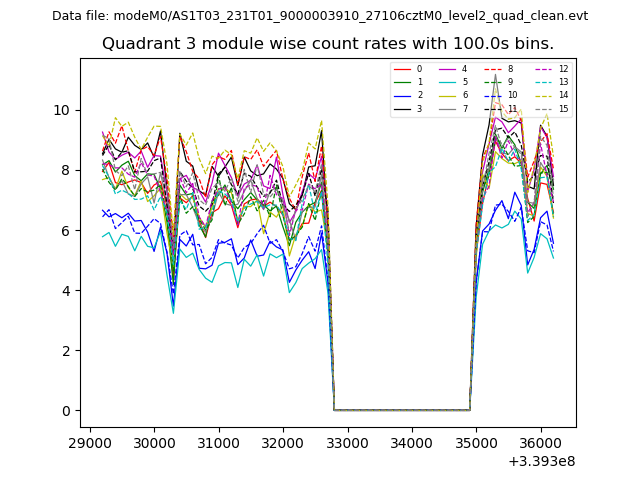
| Module-wise count rates for Quadrant C Data is divided into 100 sec bins |
 |
 |
| Module-wise count rates for Quadrant D Data is divided into 100 sec bins |
 |
 |
| Parameter | Plot |
|---|---|
| CZT HV Monitor | 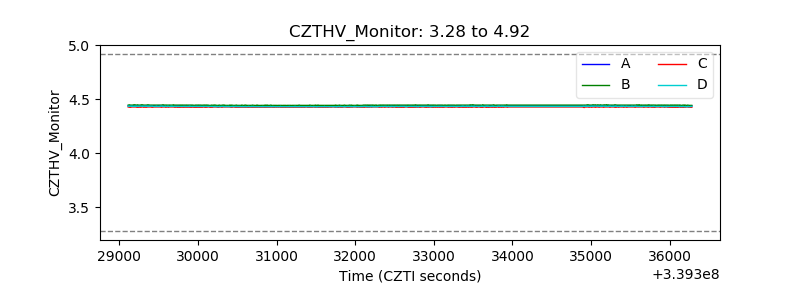 |
| D_VDD | 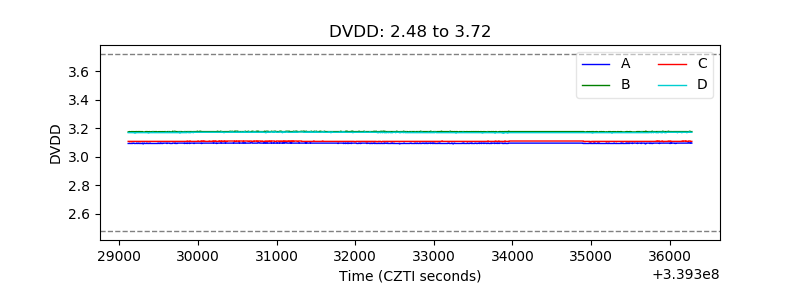 |
| Temperature 1 | 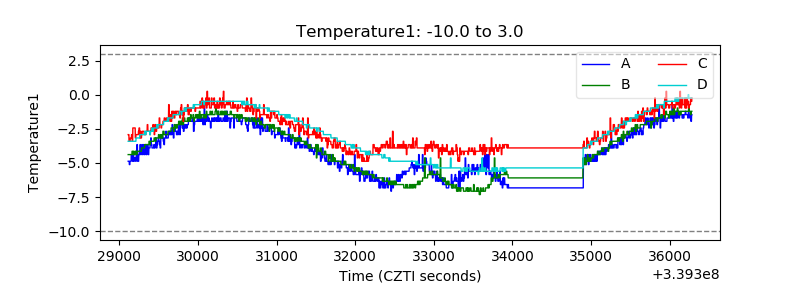 |
| Veto HV Monitor | 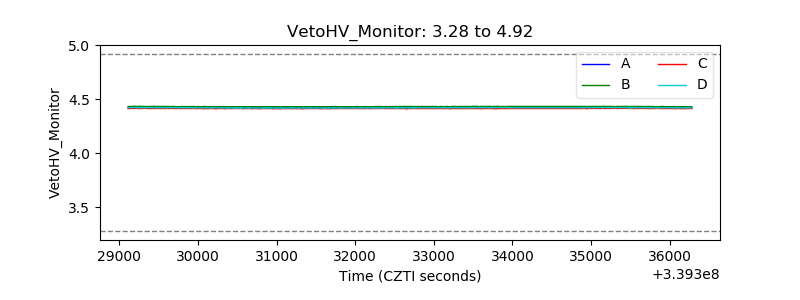 |
| Veto LLD | 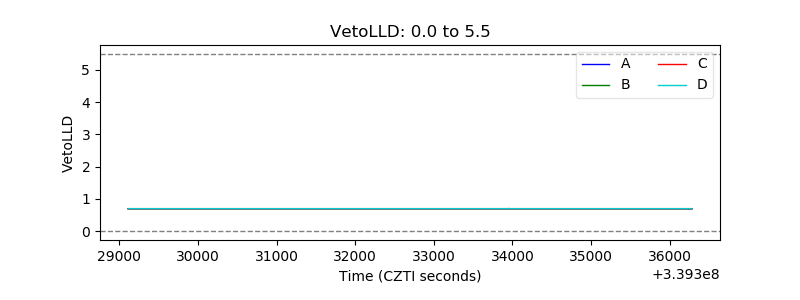 |
| Alpha Counter | 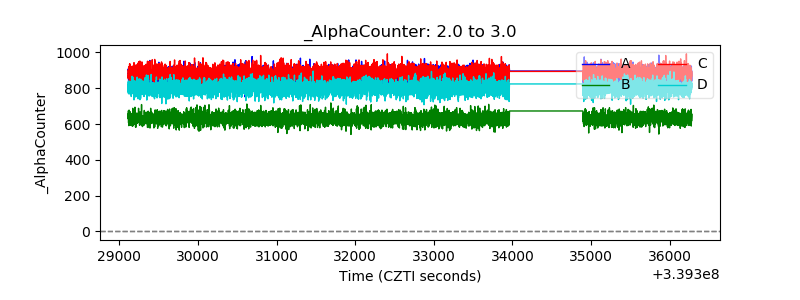 |
| _CPM_Rate | 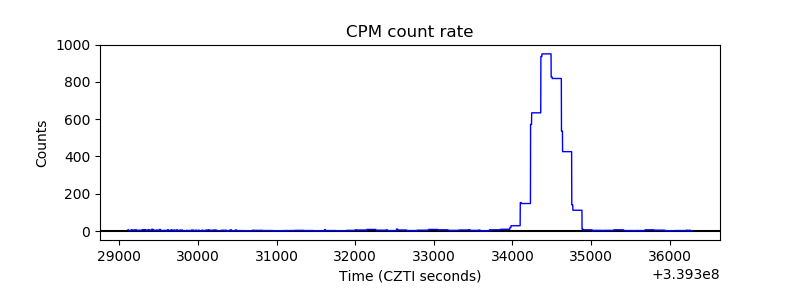 |
| CZT Counter | 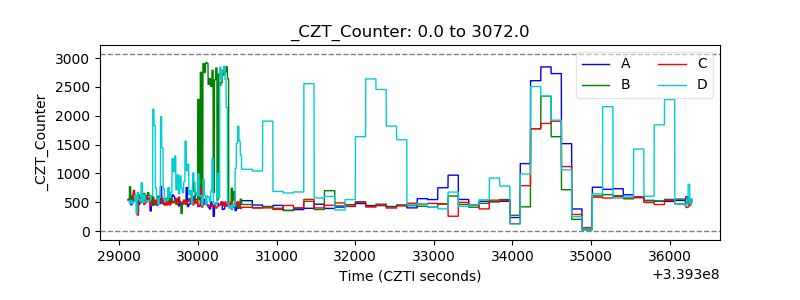 |
| +2.5 Volts monitor |  |
| +5 Volts monitor |  |
| _ROLL_ROT | 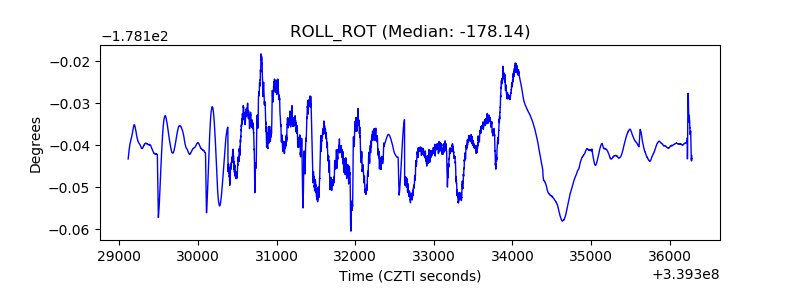 |
| _Roll_DEC |  |
| _Roll_RA | 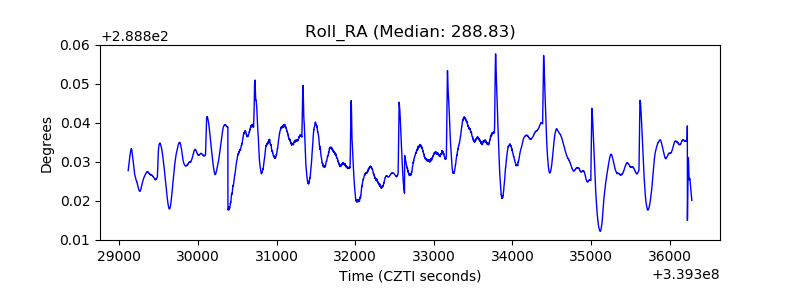 |
| Veto Counter | 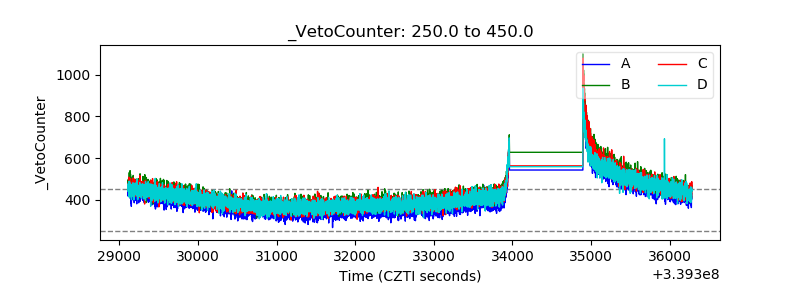 |