| Param | Original file | Final file |
|---|---|---|
| Filename | modeM0/AS1T03_244T01_9000003912cztM0_level2.fits | modeM0/AS1T03_244T01_9000003912cztM0_level2_quad_clean.evt |
| Size (bytes) | 1,834,007,040 | 1,386,221,760 |
| Size | 1.7 GB | 1.3 GB |
| Events in quadrant A | 11,468,684 | 7,764,264 |
| Events in quadrant B | 10,915,196 | 7,764,195 |
| Events in quadrant C | 11,173,500 | 7,442,030 |
| Events in quadrant D | 9,337,188 | 6,365,516 |
| Mode SS | |||
|---|---|---|---|
| Quadrant | BADHDUFLAG | Total packets | Discarded packets |
| A | 0 | 3766 | 0 |
| B | 0 | 3766 | 0 |
| C | 0 | 3766 | 0 |
| D | 0 | 3766 | 0 |
| Mode M9 | |||
|---|---|---|---|
| Quadrant | BADHDUFLAG | Total packets | Discarded packets |
| A | 0 | 308 | 0 |
| B | 0 | 308 | 0 |
| C | 0 | 308 | 0 |
| D | 0 | 308 | 0 |
| Mode M0 | |||
|---|---|---|---|
| Quadrant | BADHDUFLAG | Total packets | Discarded packets |
| A | 0 | 431099 | 0 |
| B | 0 | 418039 | 0 |
| C | 0 | 388709 | 0 |
| D | 0 | 590120 | 0 |
| Quadrant | Total seconds | Saturated seconds | Saturation percentage |
|---|---|---|---|
| A | 184502 | 3632 | 1.968542% |
| B | 184502 | 4270 | 2.314338% |
| C | 184502 | 2968 | 1.608655% |
| D | 184502 | 18177 | 9.851926% |
Noise dominated data is calculated using 1-second bins in cleaned event files. If a bin has >2000 counts, and if more than 50% of those come from <1% of pixels, then it is considered to be noise-dominated and hence unusable.
| Quadrant | # 1 sec bins | Bins with >0 counts | Bins with >2000 counts | High rate bins dominated by noise | Noise dominated (total time) | Noise dominated (detector-on time) | Marked lightcurve |
|---|---|---|---|---|---|---|---|
| A | 215637 | 184501 | 0 | 0 | 0.00% | 0.00% |  |
| B | 215637 | 184488 | 0 | 0 | 0.00% | 0.00% |  |
| C | 215637 | 184502 | 0 | 0 | 0.00% | 0.00% | 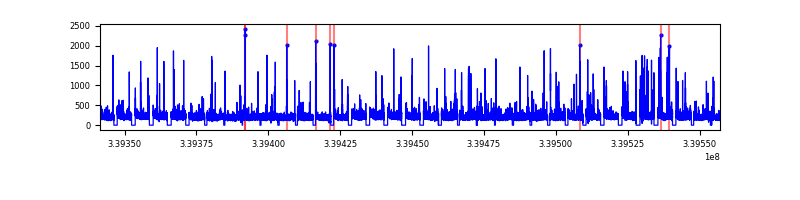 |
| D | 215637 | 184264 | 0 | 0 | 0.00% | 0.00% |  |
Top three noisy pixels from each quadrant. If the there are fewer than three noisy pixels in the level2.evt file, extra rows are filled as -1
| Pixel properties | Quadrant properties | ||||||
|---|---|---|---|---|---|---|---|
| Quadrant | DetID | PixID | Counts | Sigma | Mean | Median | Sigma |
| A | 0 | 29 | 9453 | 9.24 | 2987 | 2807 | 718.9 |
| A | 7 | 110 | 9019 | 8.64 | 2987 | 2807 | 718.9 |
| A | 9 | 19 | 8631 | 8.1 | 2987 | 2807 | 718.9 |
| B | 2 | 9 | 8685 | 10.71 | 2892 | 2768 | 552.3 |
| B | 2 | 8 | 7218 | 8.06 | 2892 | 2768 | 552.3 |
| B | 3 | 17 | 7129 | 7.9 | 2892 | 2768 | 552.3 |
| C | 12 | 241 | 7867 | 6.91 | 2954 | 2776 | 736.7 |
| C | 9 | 209 | 7601 | 6.55 | 2954 | 2776 | 736.7 |
| C | 3 | 187 | 7486 | 6.39 | 2954 | 2776 | 736.7 |
| D | 10 | 189 | 6775 | 6.25 | 2667 | 2437 | 694.4 |
| D | 6 | 67 | 6560 | 5.94 | 2667 | 2437 | 694.4 |
| D | 6 | 231 | 6499 | 5.85 | 2667 | 2437 | 694.4 |
Histogram calculated using DETX and DETY for each event in the final _common_clean file
| Quadrant A | 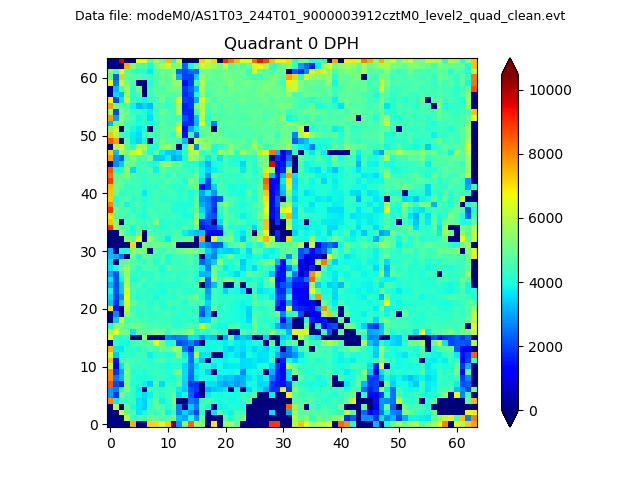 |
 |
Quadrant B |
|---|---|---|---|
| Quadrant D | 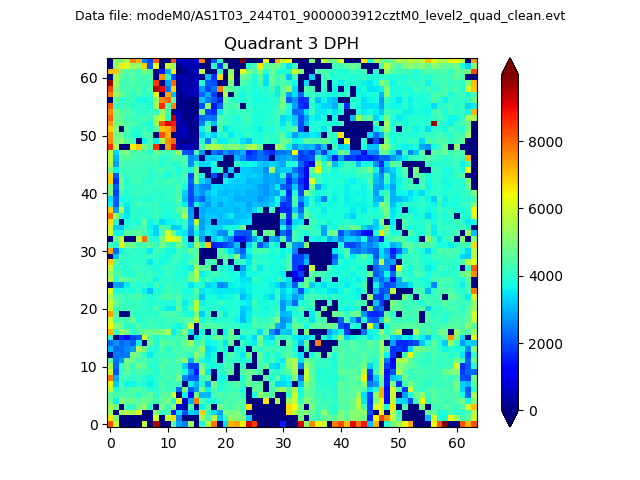 |
 |
Quadrant C |
| Plot type | Count rate plots | Images |
|---|---|---|
| Comparison with Poisson distribution Blue bars denote a histogram of data divided into 1 sec bins. Red curve is a Poisson curve with rate = median count rate of data. |
 |
 |
| Quadrant-wise count rates Data is divided into 100 sec bins |
 |
|
| Module-wise count rates for Quadrant A Data is divided into 100 sec bins |
 |
 |
| Module-wise count rates for Quadrant B Data is divided into 100 sec bins |
 |
 |
| Module-wise count rates for Quadrant C Data is divided into 100 sec bins |
 |
 |
| Module-wise count rates for Quadrant D Data is divided into 100 sec bins |
 |
 |
| Parameter | Plot |
|---|---|
| CZT HV Monitor |  |
| D_VDD | 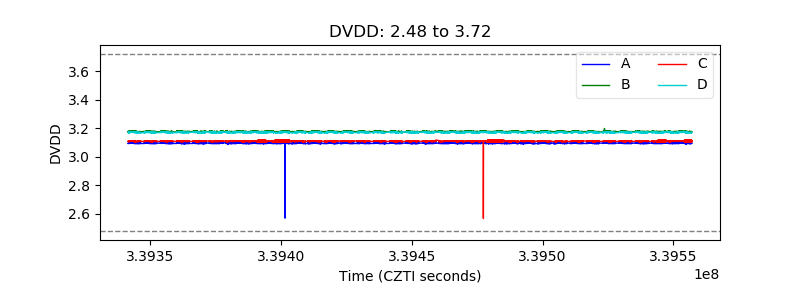 |
| Temperature 1 |  |
| Veto HV Monitor |  |
| Veto LLD | 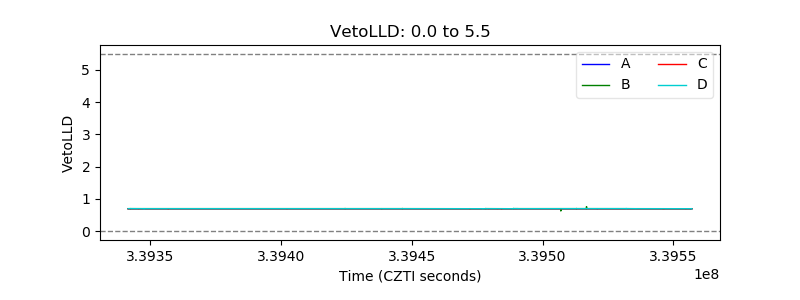 |
| Alpha Counter |  |
| _CPM_Rate |  |
| CZT Counter |  |
| +2.5 Volts monitor | 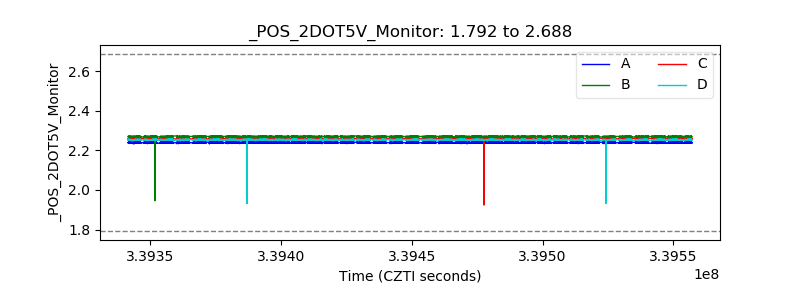 |
| +5 Volts monitor |  |
| _ROLL_ROT |  |
| _Roll_DEC | 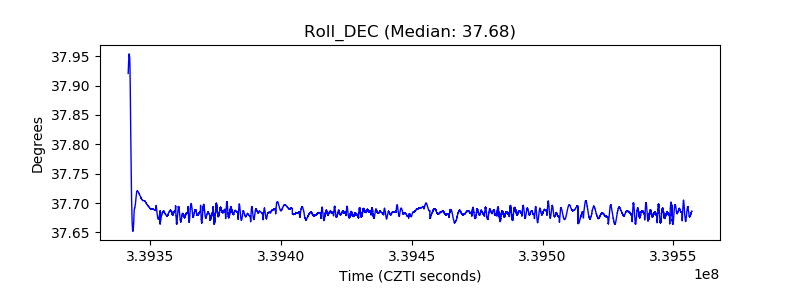 |
| _Roll_RA |  |
| Veto Counter |  |