| Param | Original file | Final file |
|---|---|---|
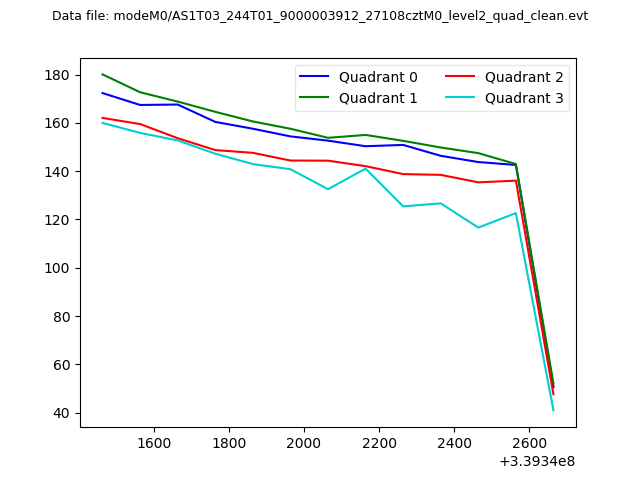
| Filename | modeM0/AS1T03_244T01_9000003912_27108cztM0_level2.evt | modeM0/AS1T03_244T01_9000003912_27108cztM0_level2_quad_clean.evt |
| Size (bytes) | 108,846,720 | 27,475,200 |
| Size | 103.8 MB | 26.2 MB |
| Events in quadrant A | 690,689 | 191,693 |
| Events in quadrant B | 693,719 | 195,806 |
| Events in quadrant C | 663,856 | 179,877 |
| Events in quadrant D | 1,160,933 | 170,555 |
| Mode M0 | |||
|---|---|---|---|
| Quadrant | BADHDUFLAG | Total packets | Discarded packets |
| A | 0 | 2826 | 0 |
| B | 0 | 2783 | 0 |
| C | 0 | 2668 | 0 |
| D | 0 | 4307 | 0 |
| Quadrant | Total seconds | Saturated seconds | Saturation percentage |
|---|---|---|---|
| A | 1240 | 3 | 0.241935% |
| B | 1240 | 3 | 0.241935% |
| C | 1240 | 11 | 0.887097% |
| D | 1239 | 107 | 8.635997% |
Noise dominated data is calculated using 1-second bins in cleaned event files. If a bin has >2000 counts, and if more than 50% of those come from <1% of pixels, then it is considered to be noise-dominated and hence unusable.
| Quadrant | # 1 sec bins | Bins with >0 counts | Bins with >2000 counts | High rate bins dominated by noise | Noise dominated (total time) | Noise dominated (detector-on time) | Marked lightcurve |
|---|---|---|---|---|---|---|---|
| A | 1240 | 1240 | 0 | 0 | 0.00% | 0.00% | 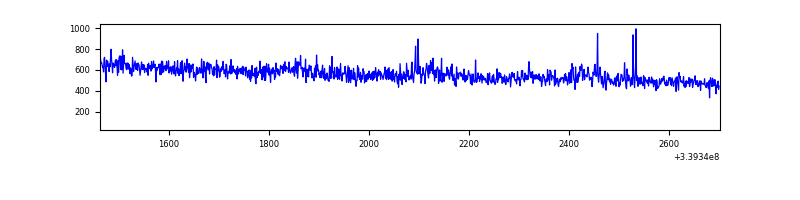 |
| B | 1240 | 1240 | 0 | 0 | 0.00% | 0.00% | 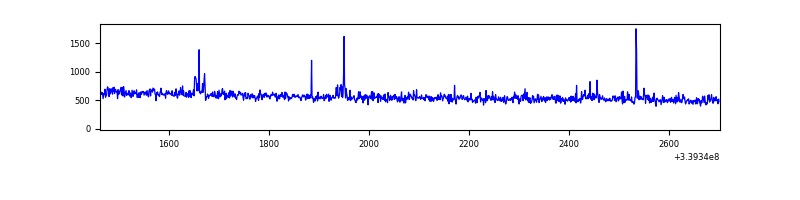 |
| C | 1240 | 1240 | 0 | 0 | 0.00% | 0.00% | 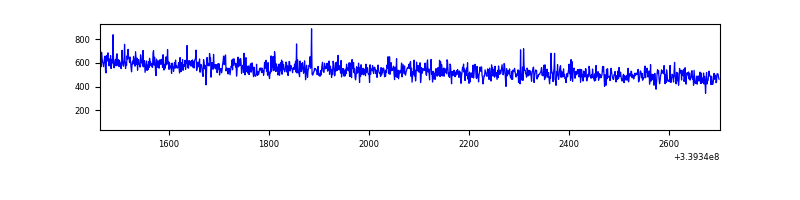 |
| D | 1239 | 1239 | 102 | 102 | 8.23% | 8.23% | 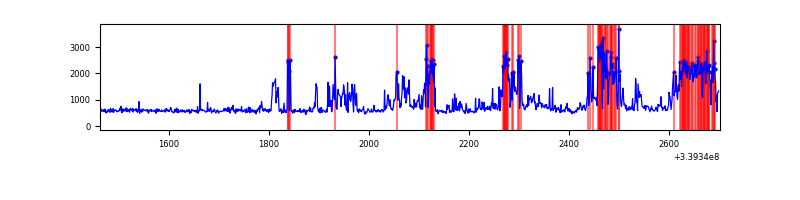 |
Top three noisy pixels from each quadrant. If the there are fewer than three noisy pixels in the level2.evt file, extra rows are filled as -1
| Pixel properties | Quadrant properties | ||||||
|---|---|---|---|---|---|---|---|
| Quadrant | DetID | PixID | Counts | Sigma | Mean | Median | Sigma |
| A | 14 | 235 | 5950 | 156.93 | 175 | 172 | 36.8 |
| A | 12 | 189 | 5224 | 137.21 | 175 | 172 | 36.8 |
| A | 13 | 248 | 2178 | 54.48 | 175 | 172 | 36.8 |
| B | 3 | 112 | 11431 | 325.1 | 171 | 168 | 34.6 |
| B | 10 | 245 | 4663 | 129.75 | 171 | 168 | 34.6 |
| B | 15 | 32 | 4408 | 122.39 | 171 | 168 | 34.6 |
| C | 14 | 238 | 26801 | 670.71 | 163 | 163 | 39.7 |
| C | 15 | 208 | 1362 | 30.19 | 163 | 163 | 39.7 |
| C | 13 | 61 | 1158 | 25.05 | 163 | 163 | 39.7 |
| D | 7 | 38 | 297688 | 7233.76 | 163 | 159 | 41.1 |
| D | 1 | 52 | 171472 | 4165.1 | 163 | 159 | 41.1 |
| D | 12 | 227 | 36080 | 873.34 | 163 | 159 | 41.1 |
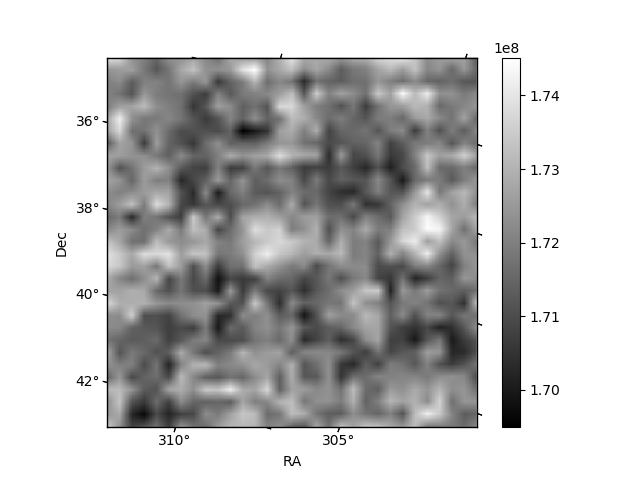
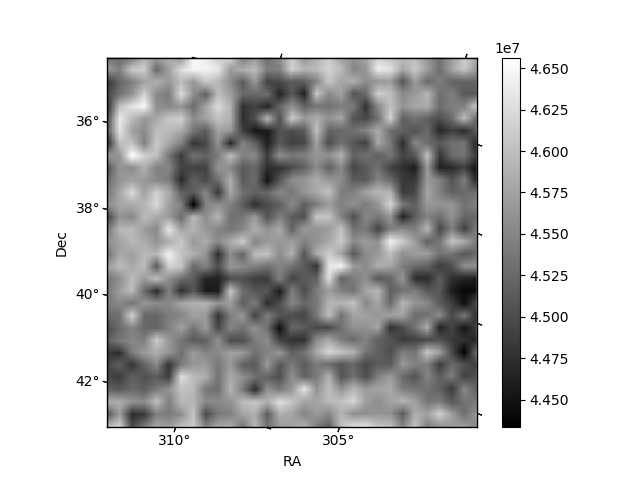
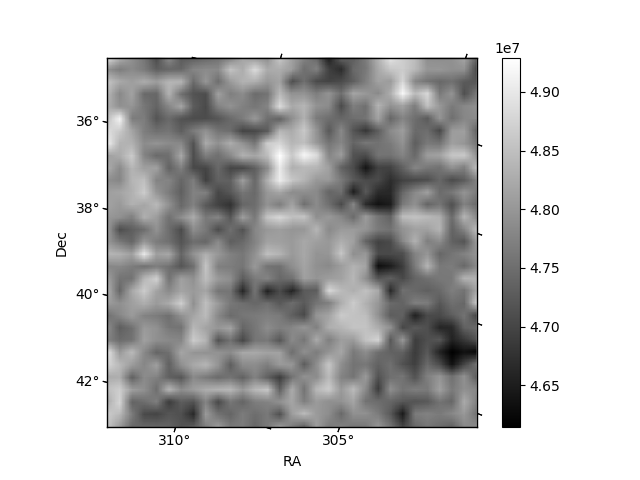
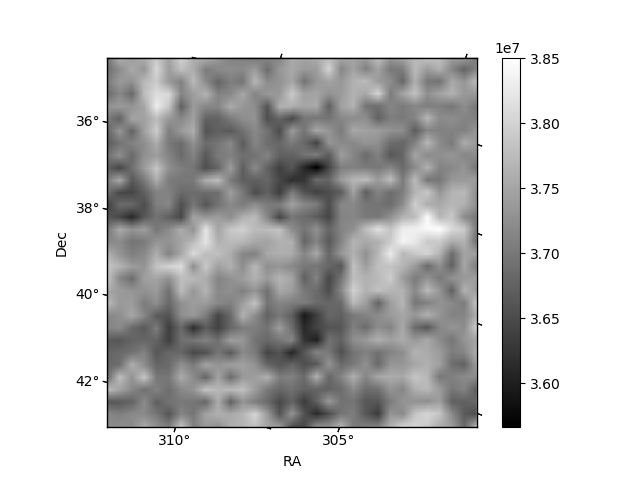
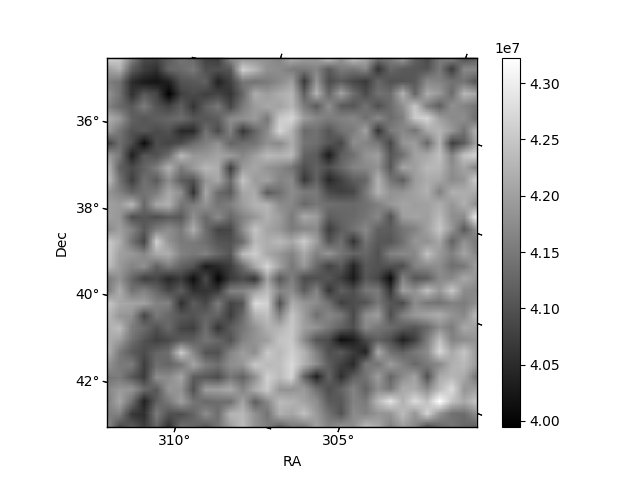
Histogram calculated using DETX and DETY for each event in the final _common_clean file
| Quadrant A | 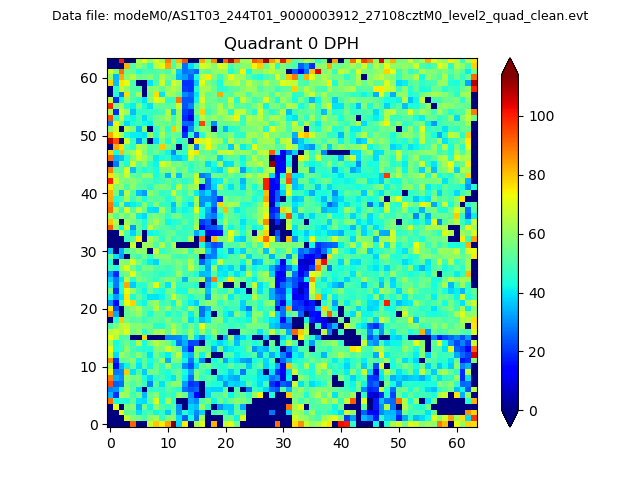 |
 |
Quadrant B |
|---|---|---|---|
| Quadrant D | 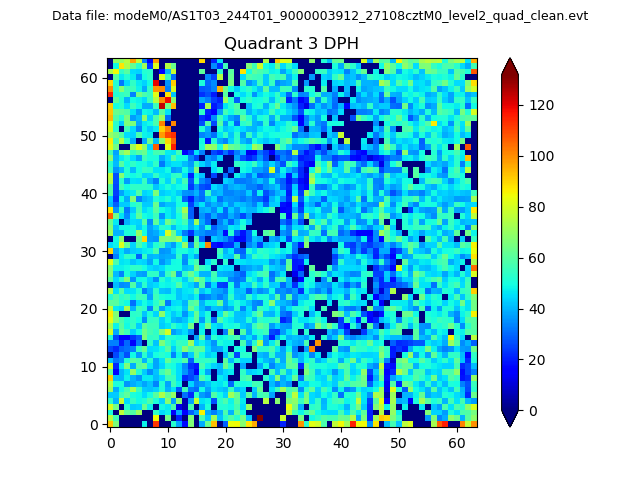 |
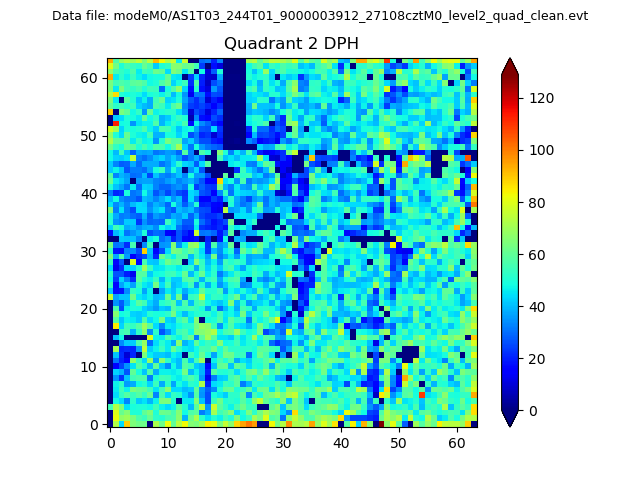 |
Quadrant C |
| Plot type | Count rate plots | Images |
|---|---|---|
| Comparison with Poisson distribution Blue bars denote a histogram of data divided into 1 sec bins. Red curve is a Poisson curve with rate = median count rate of data. |
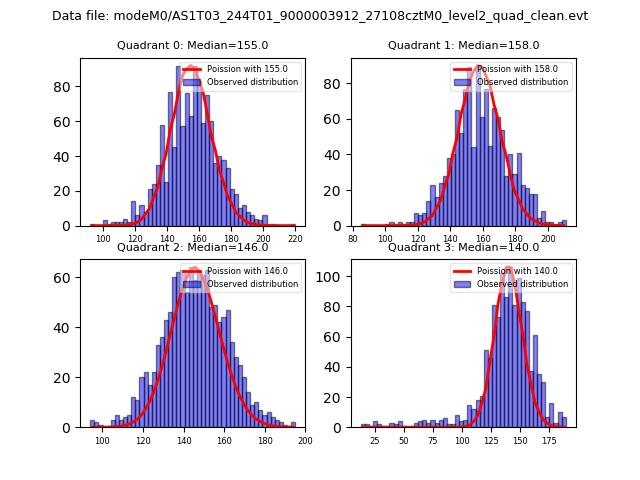 |
 |
| Quadrant-wise count rates Data is divided into 100 sec bins |
 |
|
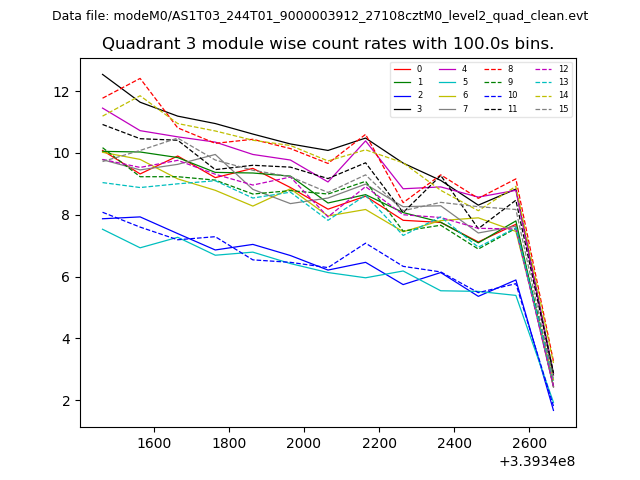
| Module-wise count rates for Quadrant A Data is divided into 100 sec bins |
 |
 |
| Module-wise count rates for Quadrant B Data is divided into 100 sec bins |
 |
 |
| Module-wise count rates for Quadrant C Data is divided into 100 sec bins |
 |
 |
| Module-wise count rates for Quadrant D Data is divided into 100 sec bins |
 |
 |
| Parameter | Plot |
|---|---|
| CZT HV Monitor |  |
| D_VDD | 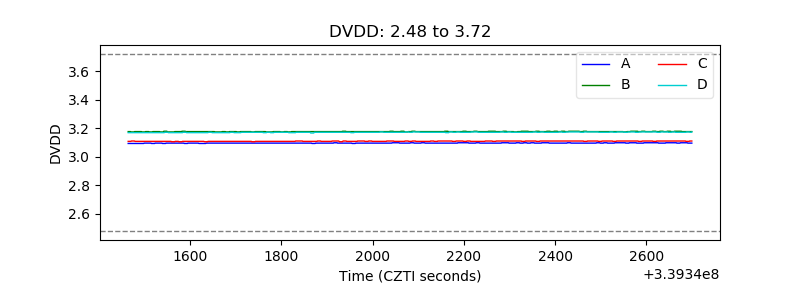 |
| Temperature 1 | 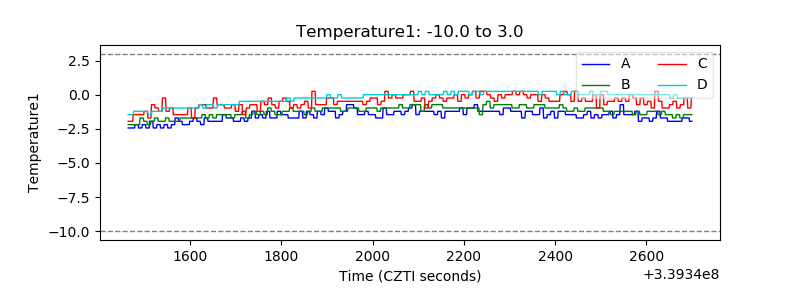 |
| Veto HV Monitor | 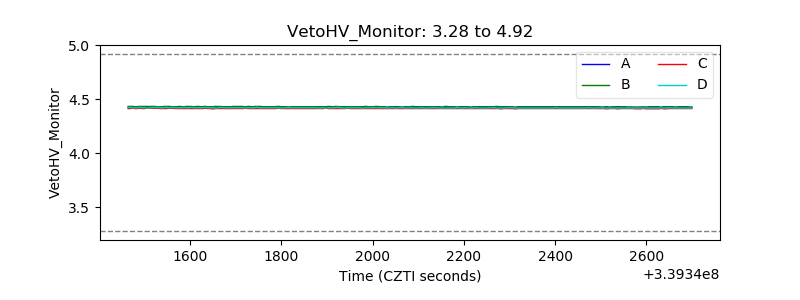 |
| Veto LLD | 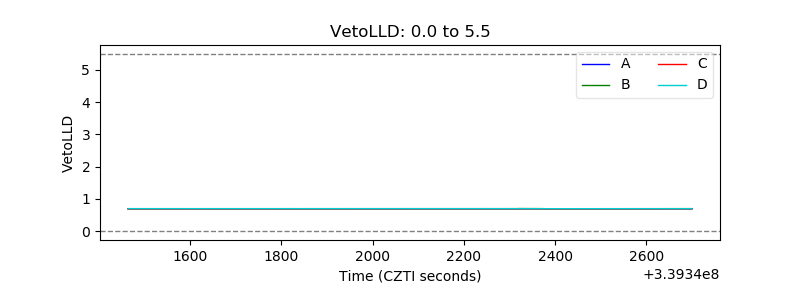 |
| Alpha Counter |  |
| _CPM_Rate | 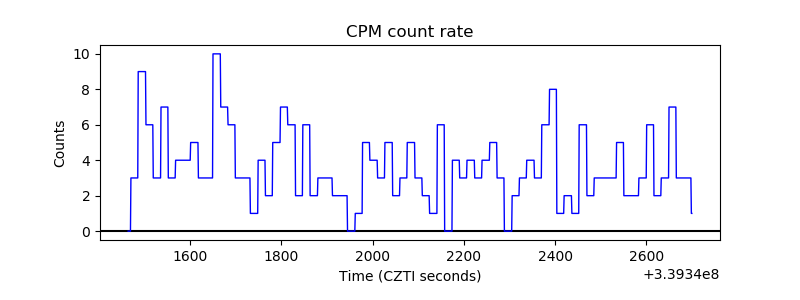 |
| CZT Counter | 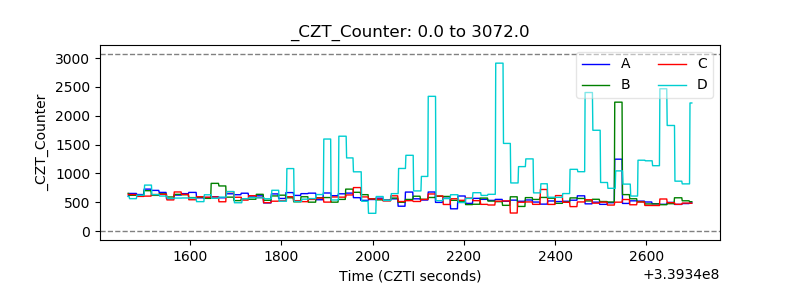 |
| +2.5 Volts monitor |  |
| +5 Volts monitor |  |
| _ROLL_ROT | 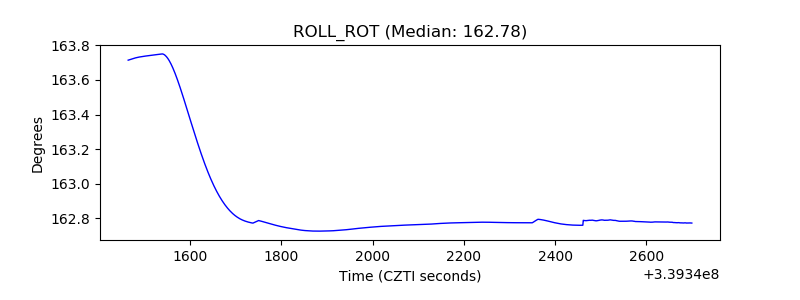 |
| _Roll_DEC | 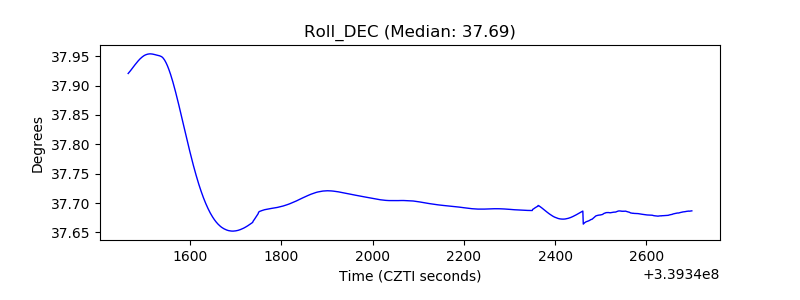 |
| _Roll_RA | 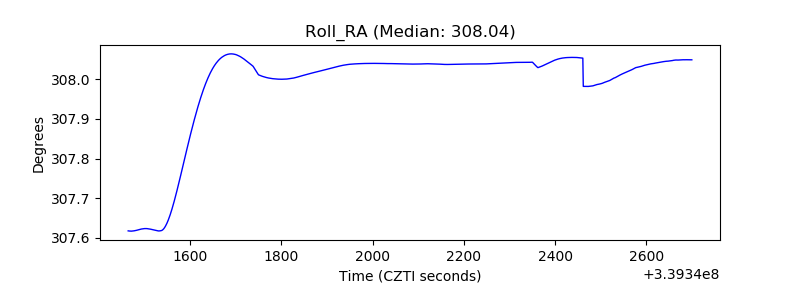 |
| Veto Counter | 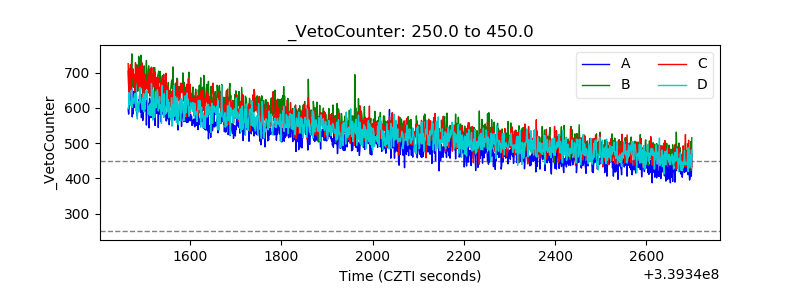 |