| Param | Original file | Final file |
|---|---|---|
| Filename | modeM0/AS1T03_244T01_9000003912_27109cztM0_level2.evt | modeM0/AS1T03_244T01_9000003912_27109cztM0_level2_quad_clean.evt |
| Size (bytes) | 495,285,120 | 99,141,120 |
| Size | 472.3 MB | 94.5 MB |
| Events in quadrant A | 3,617,658 | 669,685 |
| Events in quadrant B | 3,102,865 | 679,477 |
| Events in quadrant C | 2,982,848 | 640,855 |
| Events in quadrant D | 4,898,963 | 602,860 |
| Mode M9 | |||
|---|---|---|---|
| Quadrant | BADHDUFLAG | Total packets | Discarded packets |
| A | 0 | 11 | 0 |
| B | 0 | 11 | 0 |
| C | 0 | 11 | 0 |
| D | 0 | 11 | 0 |
| Mode M0 | |||
|---|---|---|---|
| Quadrant | BADHDUFLAG | Total packets | Discarded packets |
| A | 0 | 14509 | 0 |
| B | 0 | 13073 | 0 |
| C | 0 | 12611 | 0 |
| D | 0 | 18640 | 0 |
| Quadrant | Total seconds | Saturated seconds | Saturation percentage |
|---|---|---|---|
| A | 5857 | 218 | 3.722042% |
| B | 5858 | 85 | 1.451007% |
| C | 5858 | 107 | 1.826562% |
| D | 5857 | 432 | 7.375790% |
Noise dominated data is calculated using 1-second bins in cleaned event files. If a bin has >2000 counts, and if more than 50% of those come from <1% of pixels, then it is considered to be noise-dominated and hence unusable.
| Quadrant | # 1 sec bins | Bins with >0 counts | Bins with >2000 counts | High rate bins dominated by noise | Noise dominated (total time) | Noise dominated (detector-on time) | Marked lightcurve |
|---|---|---|---|---|---|---|---|
| A | 7022 | 5858 | 100 | 100 | 1.42% | 1.71% | 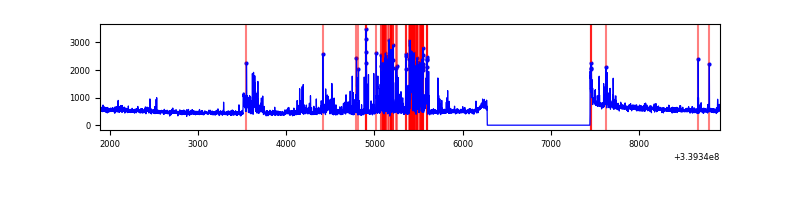 |
| B | 7023 | 5859 | 6 | 6 | 0.09% | 0.10% | 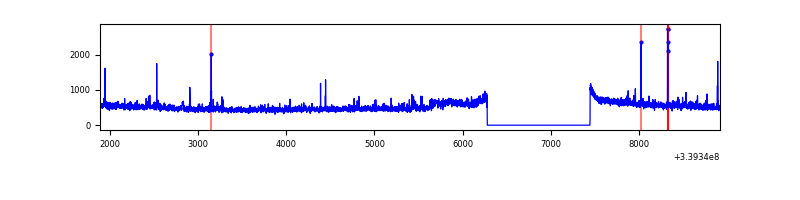 |
| C | 7023 | 5859 | 6 | 6 | 0.09% | 0.10% | 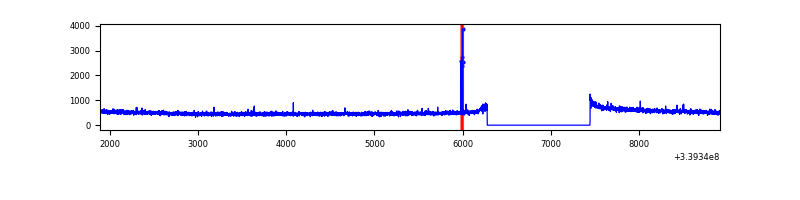 |
| D | 7022 | 5858 | 394 | 394 | 5.61% | 6.73% | 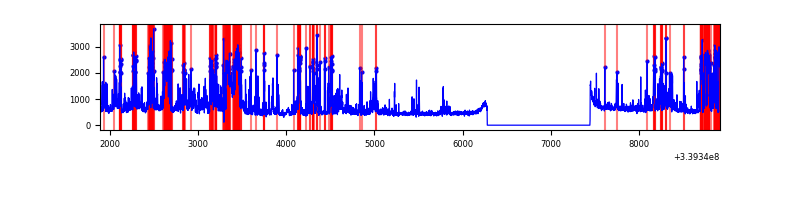 |
Top three noisy pixels from each quadrant. If the there are fewer than three noisy pixels in the level2.evt file, extra rows are filled as -1
| Pixel properties | Quadrant properties | ||||||
|---|---|---|---|---|---|---|---|
| Quadrant | DetID | PixID | Counts | Sigma | Mean | Median | Sigma |
| A | 14 | 235 | 648975 | 4330.81 | 752 | 739 | 149.7 |
| A | 6 | 16 | 47155 | 310.1 | 752 | 739 | 149.7 |
| A | 12 | 189 | 15483 | 98.5 | 752 | 739 | 149.7 |
| B | 0 | 189 | 67380 | 468.89 | 752 | 734 | 142.1 |
| B | 3 | 112 | 41371 | 285.9 | 752 | 734 | 142.1 |
| B | 5 | 172 | 22036 | 149.87 | 752 | 734 | 142.1 |
| C | 14 | 238 | 117692 | 692.67 | 725 | 731 | 168.9 |
| C | 15 | 208 | 36515 | 211.92 | 725 | 731 | 168.9 |
| C | 13 | 61 | 5047 | 25.56 | 725 | 731 | 168.9 |
| D | 7 | 38 | 1113745 | 6536.33 | 721 | 704 | 170.3 |
| D | 1 | 52 | 683397 | 4009.11 | 721 | 704 | 170.3 |
| D | 2 | 250 | 161518 | 944.38 | 721 | 704 | 170.3 |
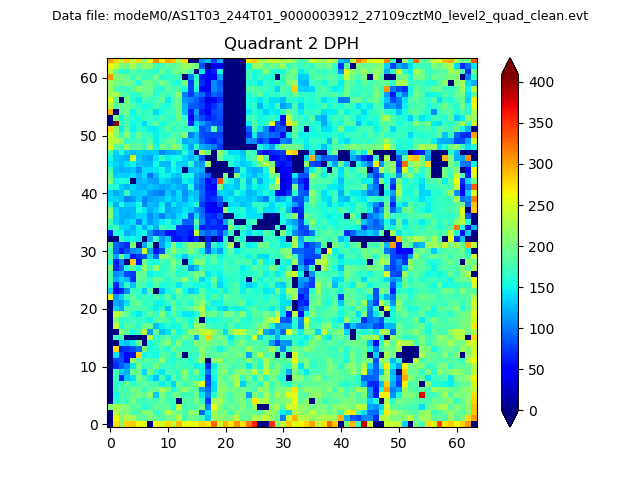
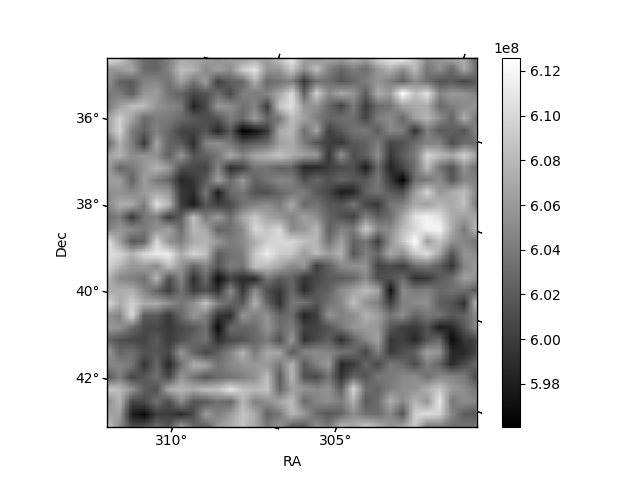
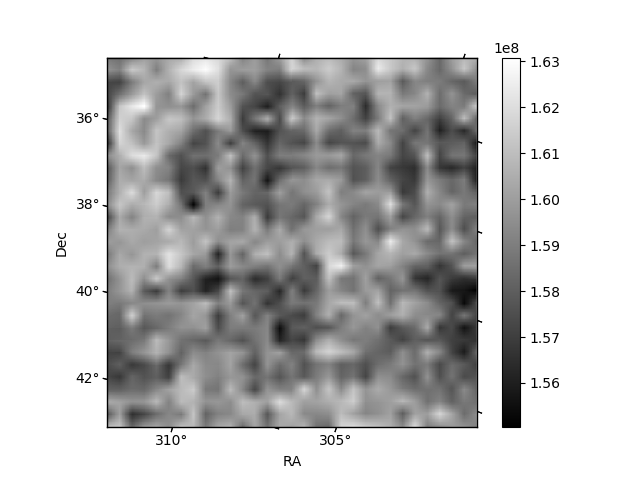
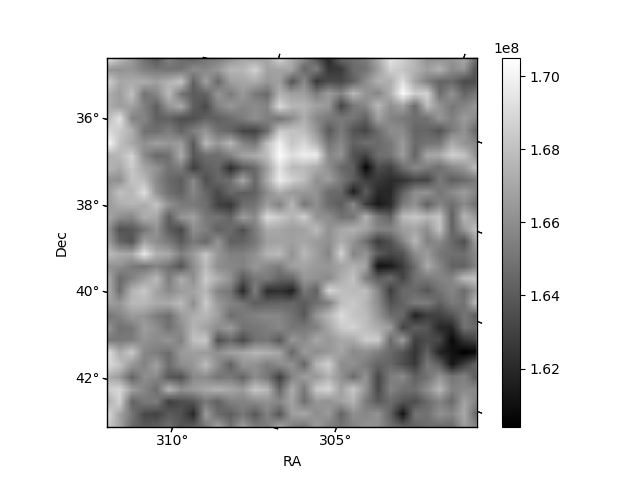
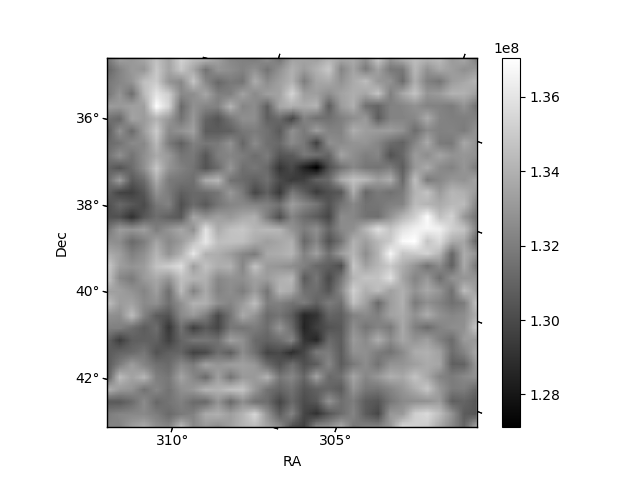
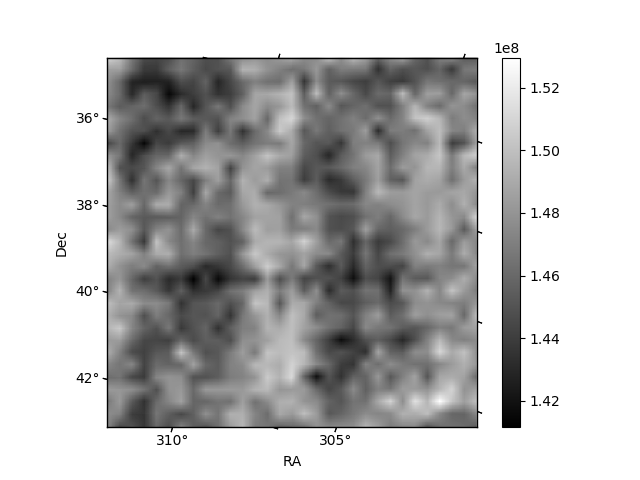
Histogram calculated using DETX and DETY for each event in the final _common_clean file
| Quadrant A | 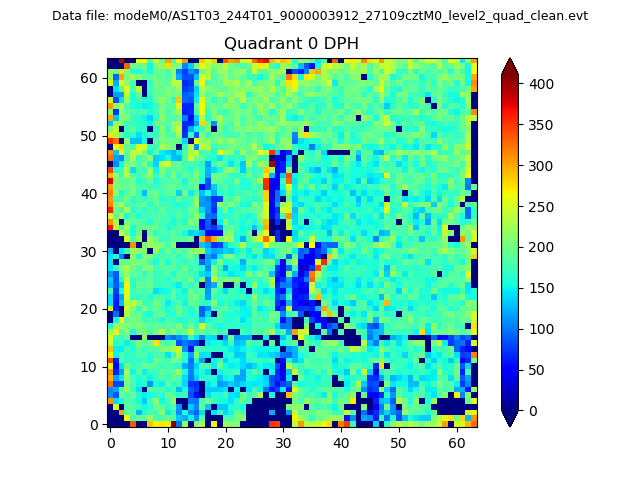 |
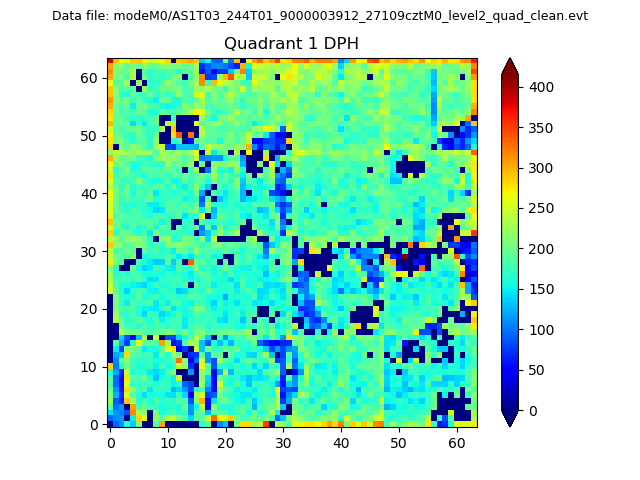 |
Quadrant B |
|---|---|---|---|
| Quadrant D | 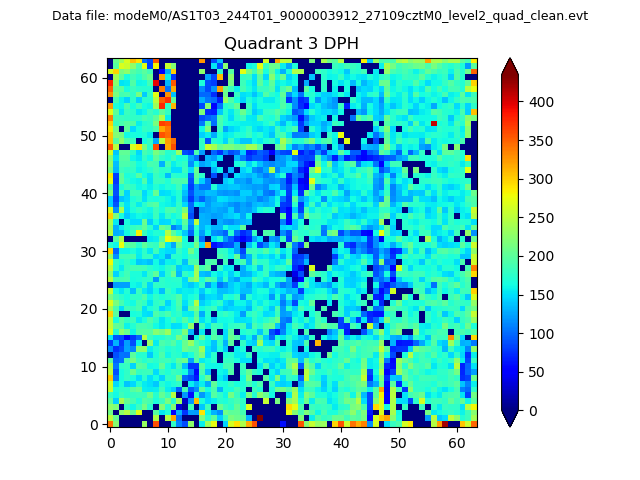 |
 |
Quadrant C |
| Plot type | Count rate plots | Images |
|---|---|---|
| Comparison with Poisson distribution Blue bars denote a histogram of data divided into 1 sec bins. Red curve is a Poisson curve with rate = median count rate of data. |
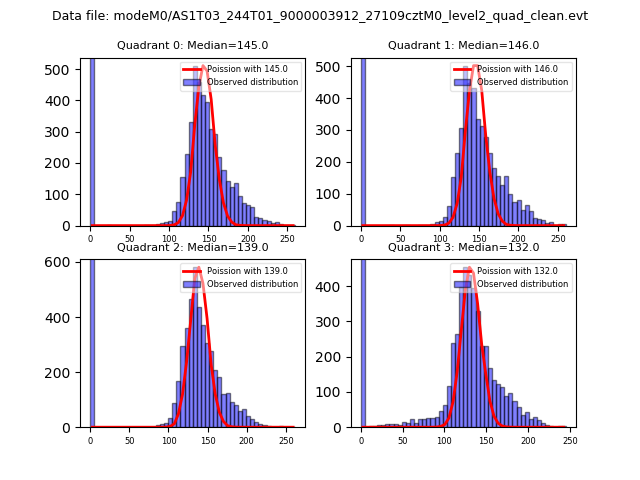 |
 |
| Quadrant-wise count rates Data is divided into 100 sec bins |
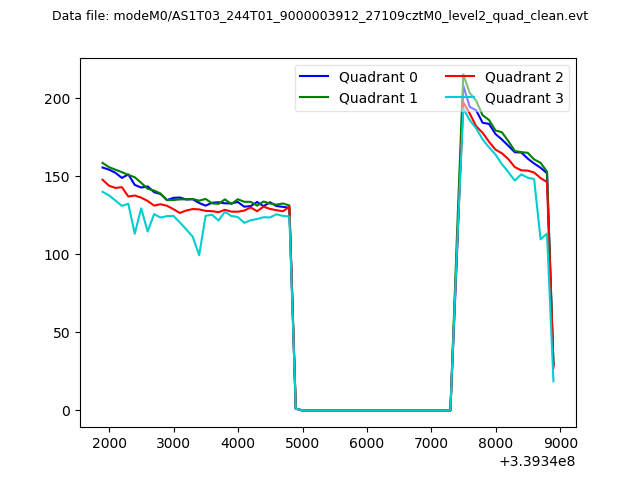 |
|
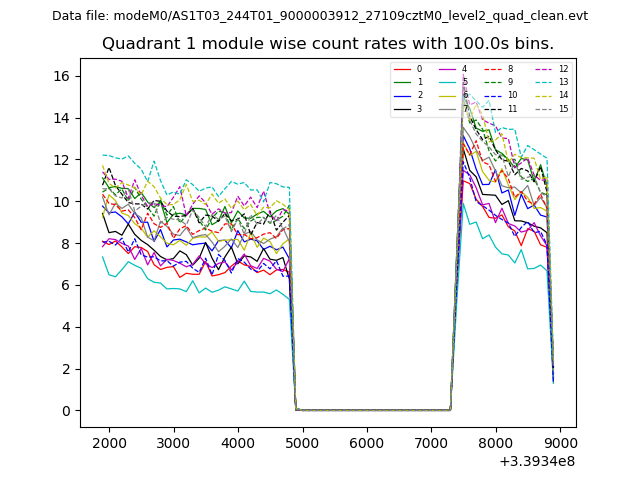
| Module-wise count rates for Quadrant A Data is divided into 100 sec bins |
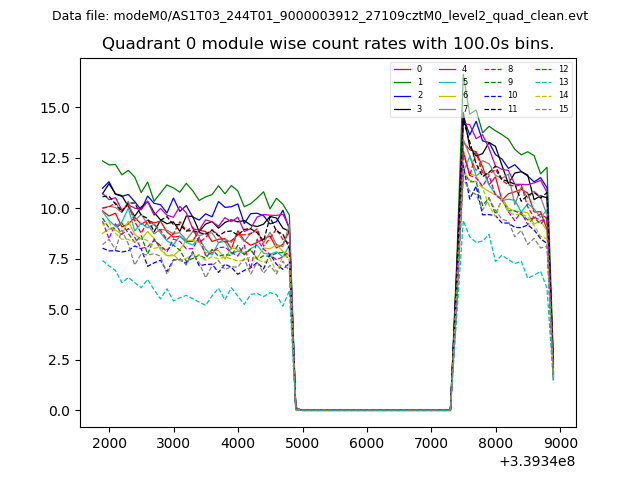 |
 |
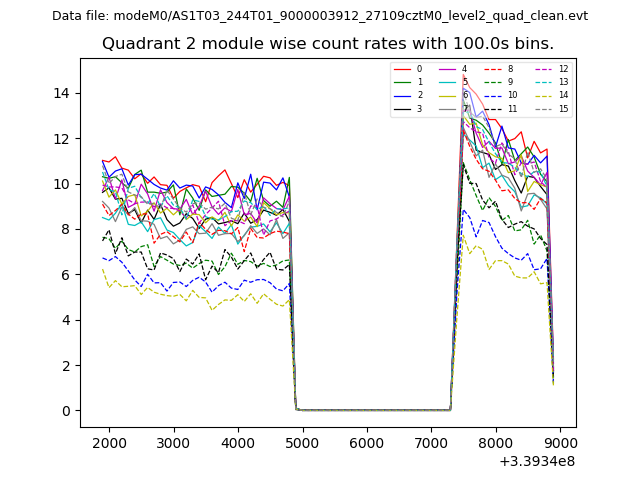
| Module-wise count rates for Quadrant B Data is divided into 100 sec bins |
 |
 |
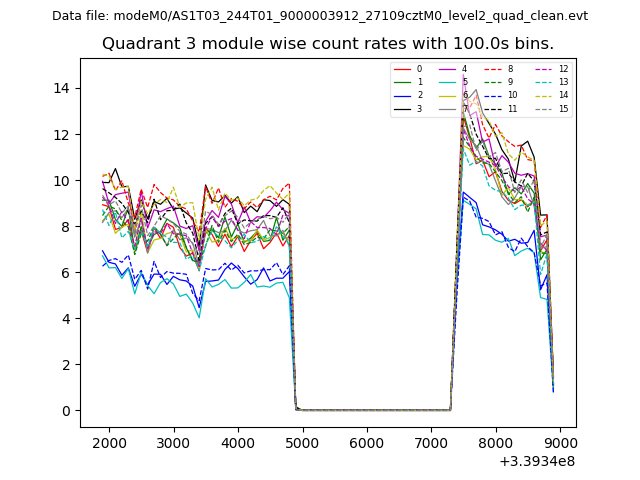
| Module-wise count rates for Quadrant C Data is divided into 100 sec bins |
 |
 |
| Module-wise count rates for Quadrant D Data is divided into 100 sec bins |
 |
 |
| Parameter | Plot |
|---|---|
| CZT HV Monitor | 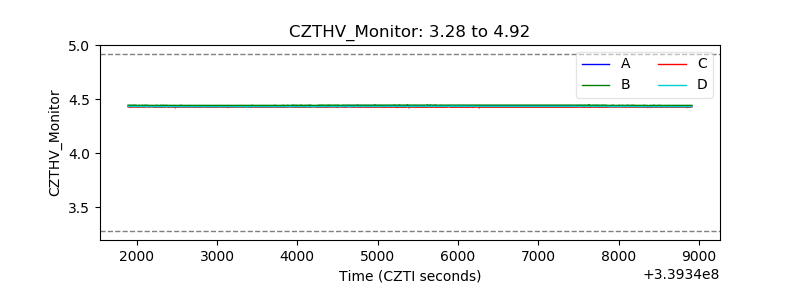 |
| D_VDD | 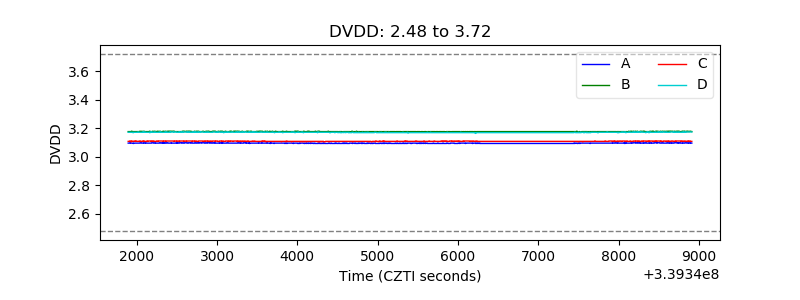 |
| Temperature 1 | 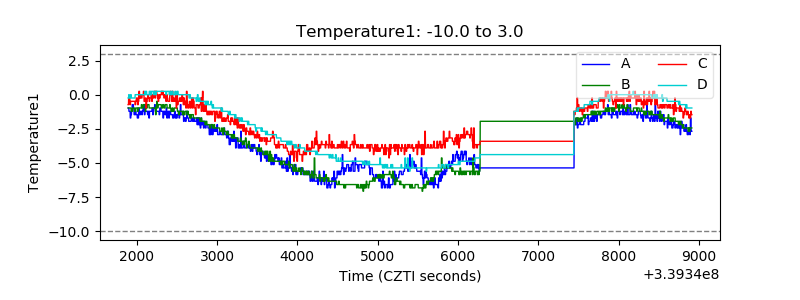 |
| Veto HV Monitor | 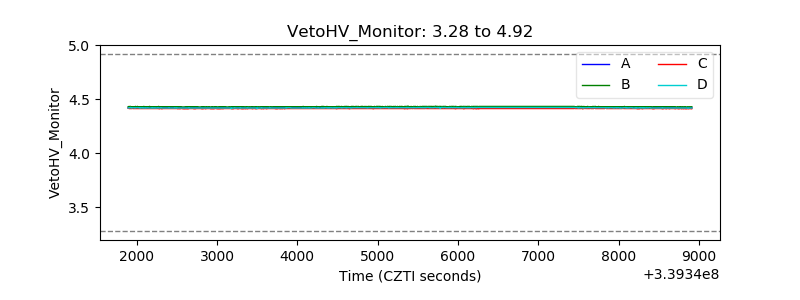 |
| Veto LLD | 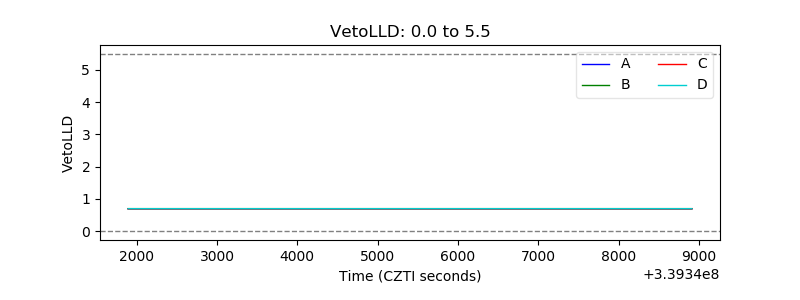 |
| Alpha Counter |  |
| _CPM_Rate | 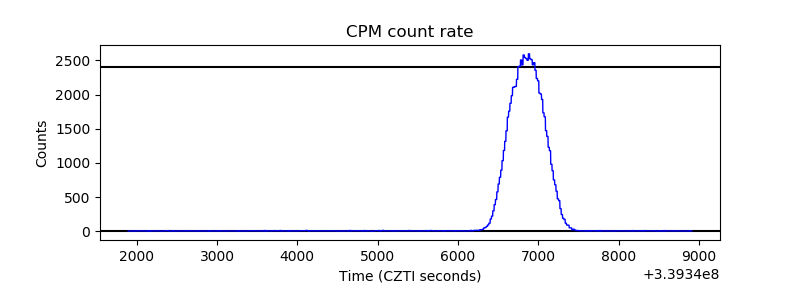 |
| CZT Counter | 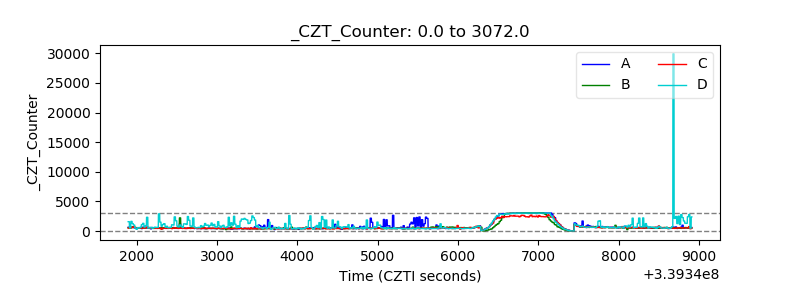 |
| +2.5 Volts monitor |  |
| +5 Volts monitor |  |
| _ROLL_ROT | 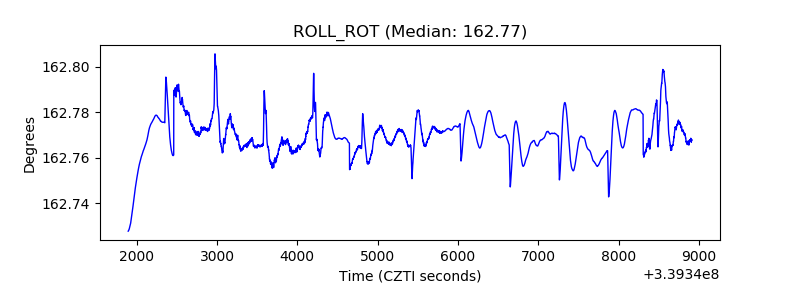 |
| _Roll_DEC | 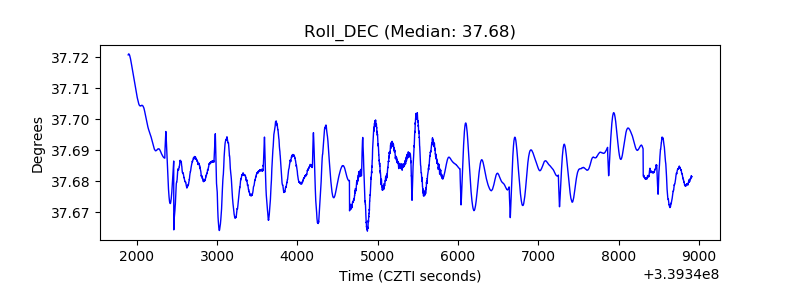 |
| _Roll_RA |  |
| Veto Counter | 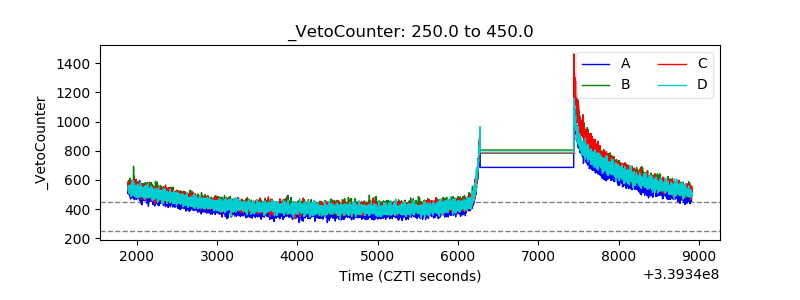 |