| Param | Original file | Final file |
|---|---|---|
| Filename | modeM0/AS1T03_244T01_9000003912_27110cztM0_level2.evt | modeM0/AS1T03_244T01_9000003912_27110cztM0_level2_quad_clean.evt |
| Size (bytes) | 624,294,720 | 96,958,080 |
| Size | 595.4 MB | 92.5 MB |
| Events in quadrant A | 3,952,725 | 670,602 |
| Events in quadrant B | 3,185,246 | 687,590 |
| Events in quadrant C | 3,119,577 | 649,022 |
| Events in quadrant D | 8,247,258 | 513,415 |
| Mode M9 | |||
|---|---|---|---|
| Quadrant | BADHDUFLAG | Total packets | Discarded packets |
| A | 0 | 13 | 0 |
| B | 0 | 13 | 0 |
| C | 0 | 13 | 0 |
| D | 0 | 13 | 0 |
| Mode M0 | |||
|---|---|---|---|
| Quadrant | BADHDUFLAG | Total packets | Discarded packets |
| A | 0 | 15758 | 0 |
| B | 0 | 13139 | 0 |
| C | 0 | 12920 | 0 |
| D | 0 | 28627 | 0 |
| Quadrant | Total seconds | Saturated seconds | Saturation percentage |
|---|---|---|---|
| A | 5945 | 117 | 1.968040% |
| B | 5946 | 81 | 1.362260% |
| C | 5946 | 107 | 1.799529% |
| D | 5945 | 1785 | 30.025231% |
Noise dominated data is calculated using 1-second bins in cleaned event files. If a bin has >2000 counts, and if more than 50% of those come from <1% of pixels, then it is considered to be noise-dominated and hence unusable.
| Quadrant | # 1 sec bins | Bins with >0 counts | Bins with >2000 counts | High rate bins dominated by noise | Noise dominated (total time) | Noise dominated (detector-on time) | Marked lightcurve |
|---|---|---|---|---|---|---|---|
| A | 7205 | 5946 | 27 | 27 | 0.37% | 0.45% | 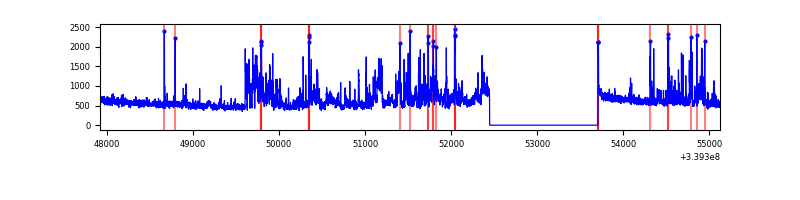 |
| B | 7206 | 5947 | 6 | 6 | 0.08% | 0.10% | 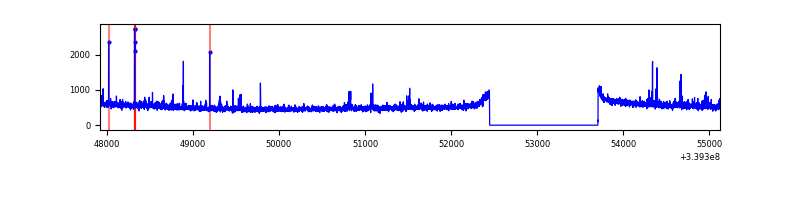 |
| C | 7206 | 5947 | 0 | 0 | 0.00% | 0.00% | 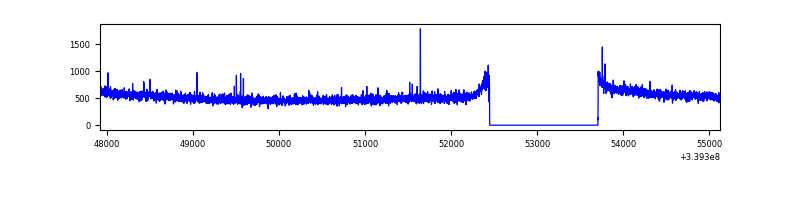 |
| D | 7205 | 5946 | 1771 | 1771 | 24.58% | 29.78% | 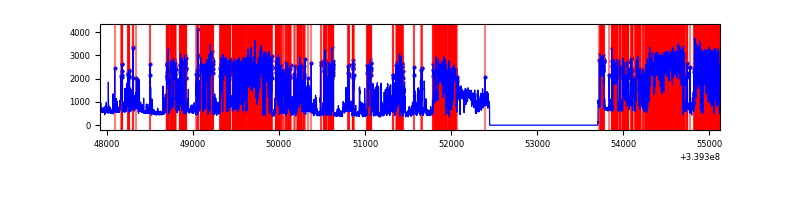 |
Top three noisy pixels from each quadrant. If the there are fewer than three noisy pixels in the level2.evt file, extra rows are filled as -1
| Pixel properties | Quadrant properties | ||||||
|---|---|---|---|---|---|---|---|
| Quadrant | DetID | PixID | Counts | Sigma | Mean | Median | Sigma |
| A | 6 | 16 | 504940 | 3213.9 | 792 | 777 | 156.9 |
| A | 14 | 235 | 353722 | 2249.93 | 792 | 777 | 156.9 |
| A | 12 | 189 | 23670 | 145.94 | 792 | 777 | 156.9 |
| B | 3 | 112 | 47442 | 318.77 | 787 | 770 | 146.4 |
| B | 5 | 172 | 25362 | 167.96 | 787 | 770 | 146.4 |
| B | 0 | 219 | 18210 | 119.12 | 787 | 770 | 146.4 |
| C | 14 | 238 | 124114 | 695.91 | 763 | 768 | 177.2 |
| C | 15 | 208 | 18096 | 97.76 | 763 | 768 | 177.2 |
| C | 13 | 61 | 5257 | 25.32 | 763 | 768 | 177.2 |
| D | 1 | 52 | 4750649 | 29909.29 | 681 | 665 | 158.8 |
| D | 7 | 38 | 564475 | 3550.15 | 681 | 665 | 158.8 |
| D | 12 | 233 | 192582 | 1208.45 | 681 | 665 | 158.8 |
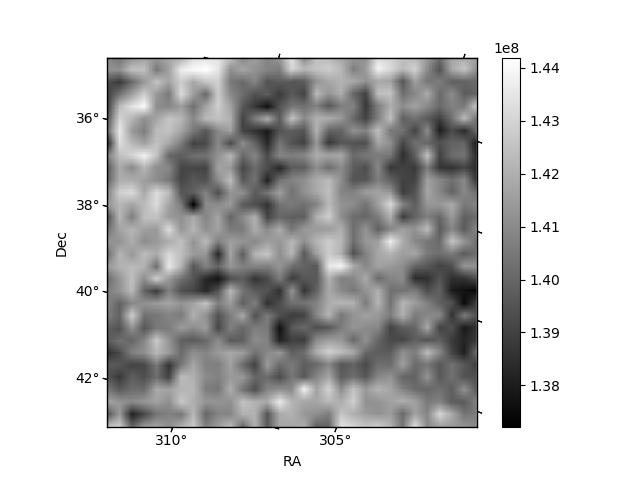
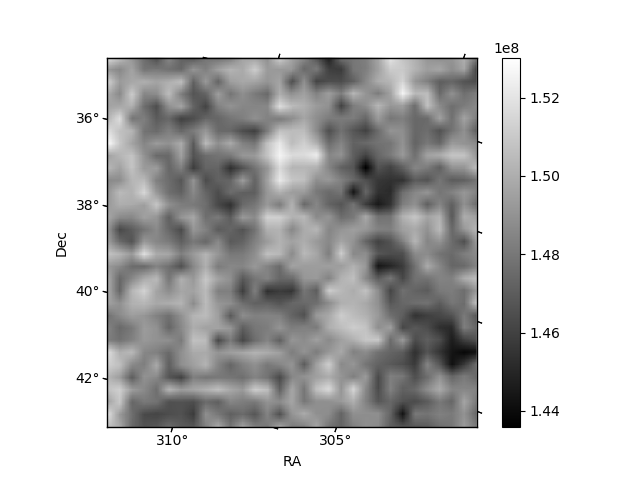
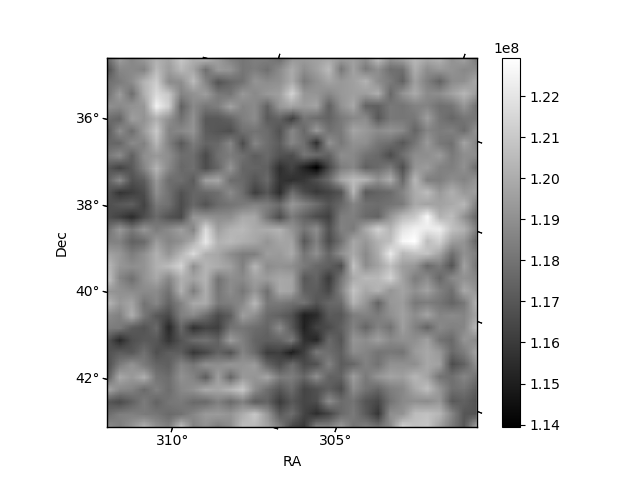
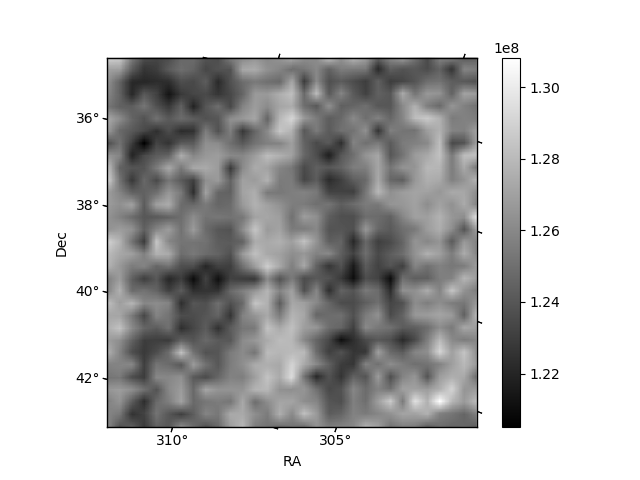
Histogram calculated using DETX and DETY for each event in the final _common_clean file
| Quadrant A | 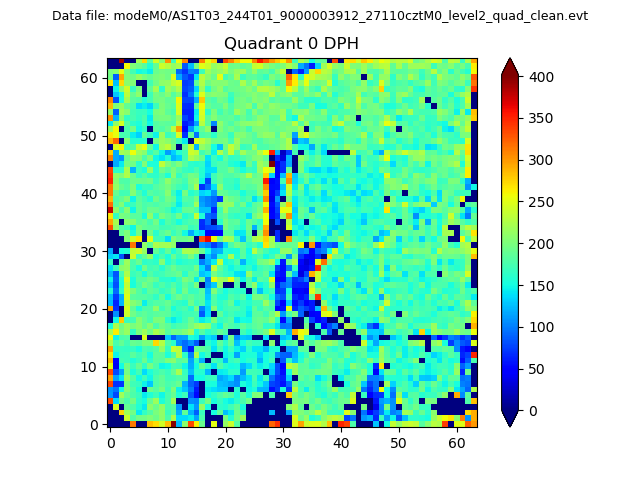 |
 |
Quadrant B |
|---|---|---|---|
| Quadrant D | 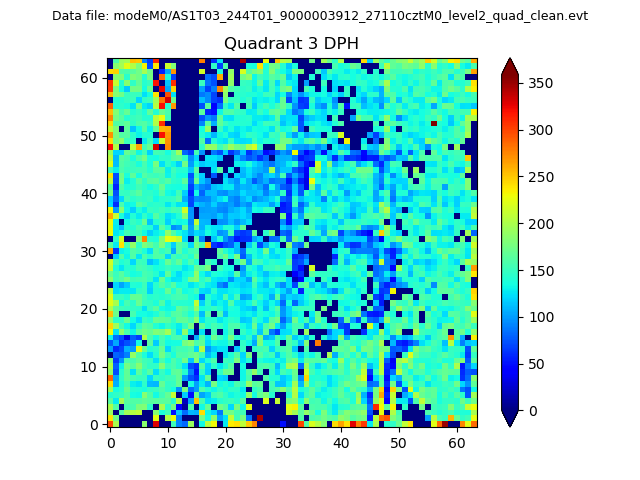 |
 |
Quadrant C |
| Plot type | Count rate plots | Images |
|---|---|---|
| Comparison with Poisson distribution Blue bars denote a histogram of data divided into 1 sec bins. Red curve is a Poisson curve with rate = median count rate of data. |
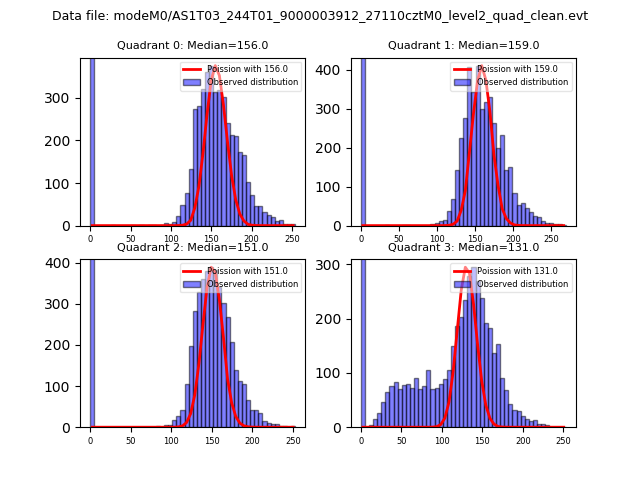 |
 |
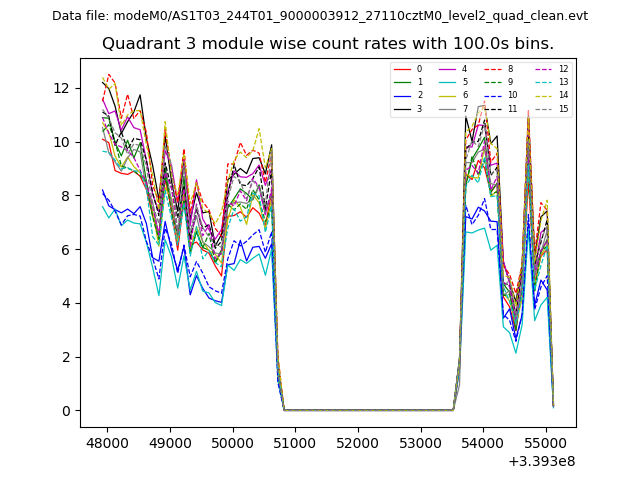
| Quadrant-wise count rates Data is divided into 100 sec bins |
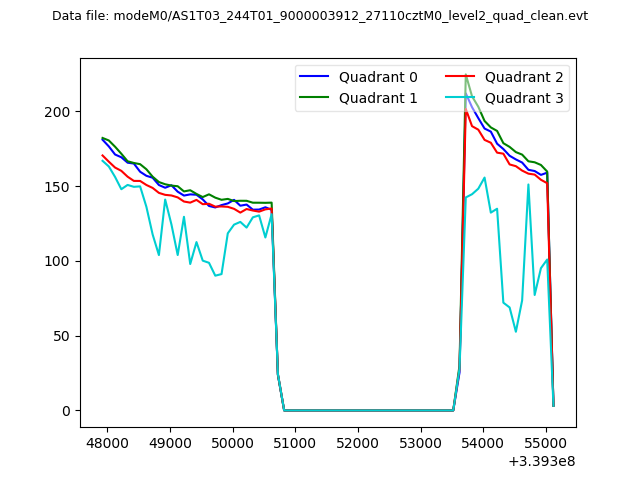 |
|
| Module-wise count rates for Quadrant A Data is divided into 100 sec bins |
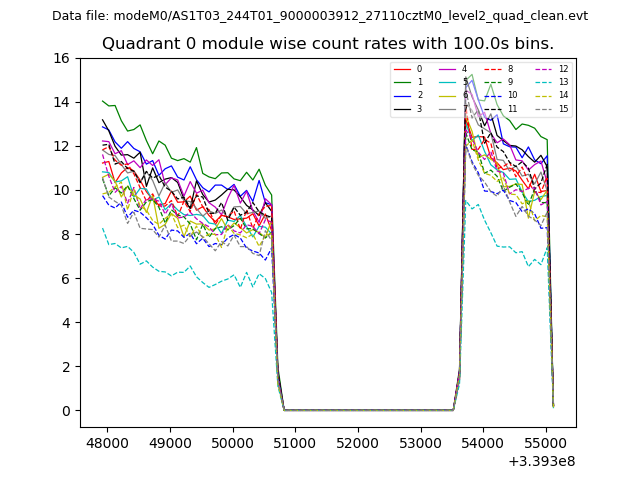 |
 |
| Module-wise count rates for Quadrant B Data is divided into 100 sec bins |
 |
 |
| Module-wise count rates for Quadrant C Data is divided into 100 sec bins |
 |
 |
| Module-wise count rates for Quadrant D Data is divided into 100 sec bins |
 |
 |
| Parameter | Plot |
|---|---|
| CZT HV Monitor | 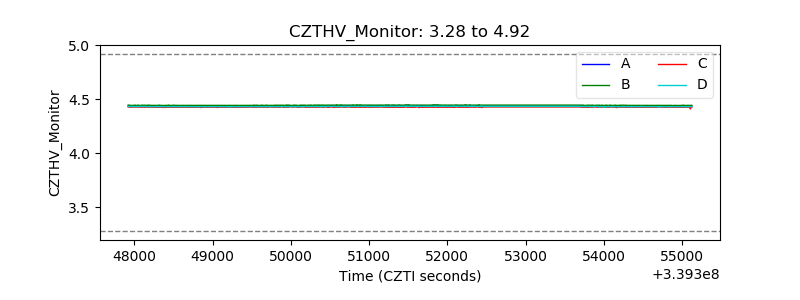 |
| D_VDD | 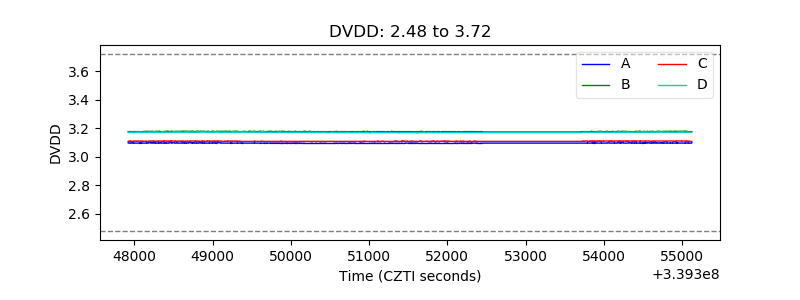 |
| Temperature 1 | 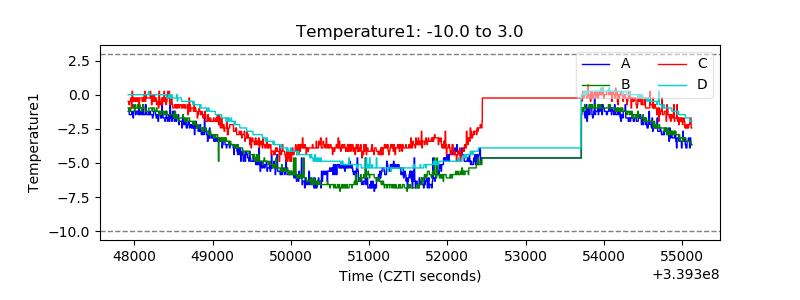 |
| Veto HV Monitor | 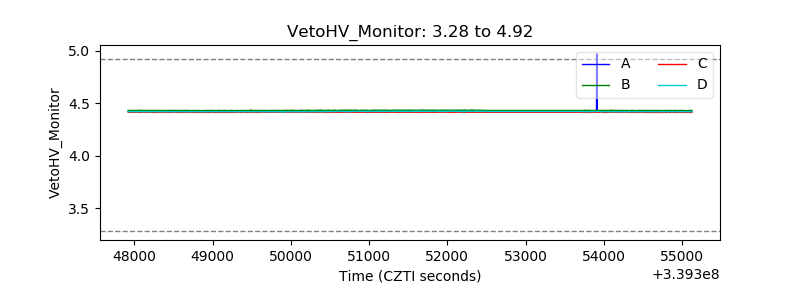 |
| Veto LLD |  |
| Alpha Counter | 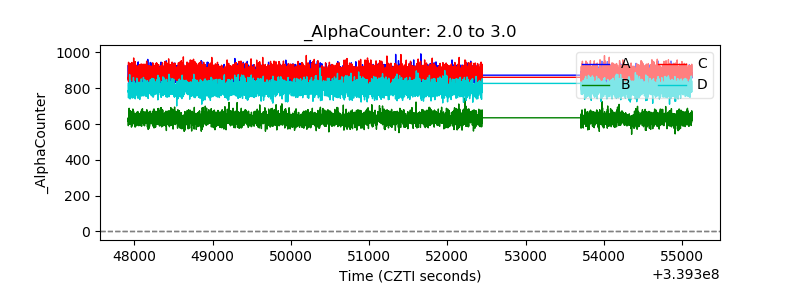 |
| _CPM_Rate | 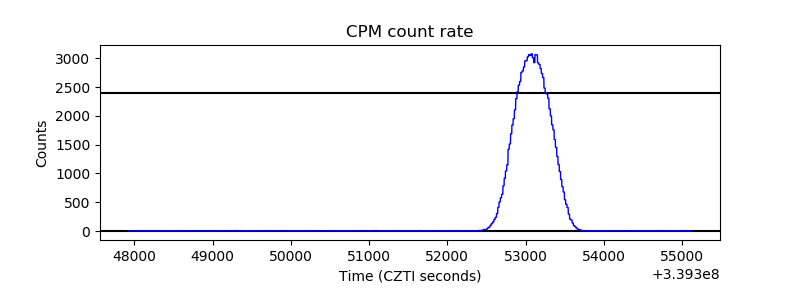 |
| CZT Counter |  |
| +2.5 Volts monitor |  |
| +5 Volts monitor | 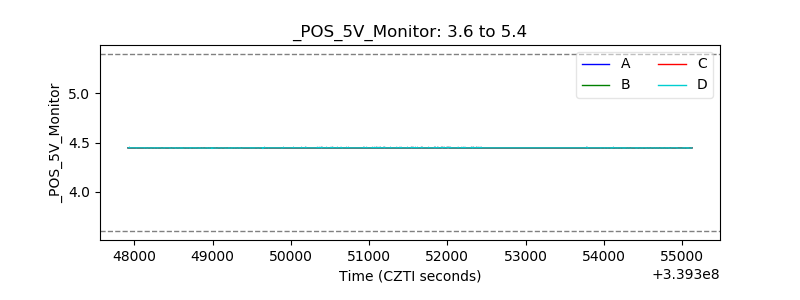 |
| _ROLL_ROT | 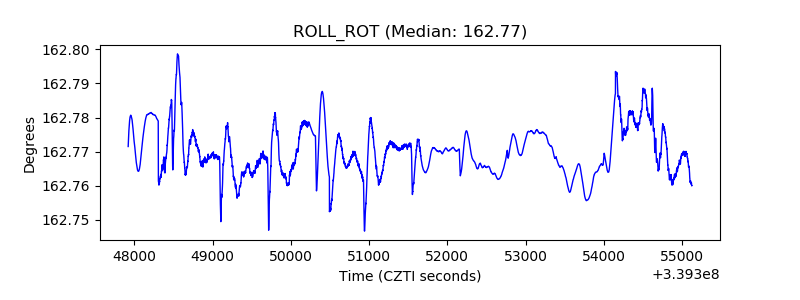 |
| _Roll_DEC | 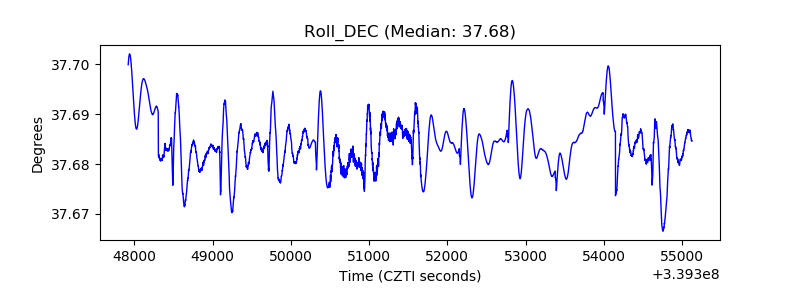 |
| _Roll_RA |  |
| Veto Counter | 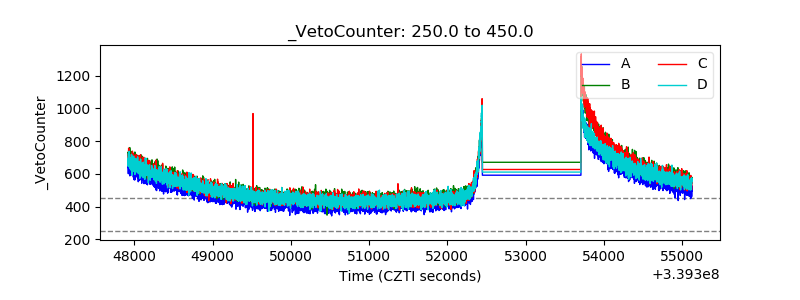 |