| Param | Original file | Final file |
|---|---|---|
| Filename | modeM0/AS1T03_244T01_9000003912_27111cztM0_level2.evt | modeM0/AS1T03_244T01_9000003912_27111cztM0_level2_quad_clean.evt |
| Size (bytes) | 646,272,000 | 94,475,520 |
| Size | 616.3 MB | 90.1 MB |
| Events in quadrant A | 3,963,501 | 655,126 |
| Events in quadrant B | 3,264,935 | 675,078 |
| Events in quadrant C | 3,229,746 | 638,343 |
| Events in quadrant D | 8,702,000 | 466,070 |
| Mode M9 | |||
|---|---|---|---|
| Quadrant | BADHDUFLAG | Total packets | Discarded packets |
| A | 0 | 13 | 0 |
| B | 0 | 13 | 0 |
| C | 0 | 13 | 0 |
| D | 0 | 13 | 0 |
| Mode M0 | |||
|---|---|---|---|
| Quadrant | BADHDUFLAG | Total packets | Discarded packets |
| A | 0 | 15756 | 0 |
| B | 0 | 13457 | 0 |
| C | 0 | 13329 | 0 |
| D | 0 | 29980 | 0 |
| Quadrant | Total seconds | Saturated seconds | Saturation percentage |
|---|---|---|---|
| A | 6088 | 115 | 1.888962% |
| B | 6089 | 51 | 0.837576% |
| C | 6089 | 89 | 1.461652% |
| D | 6088 | 1937 | 31.816689% |
Noise dominated data is calculated using 1-second bins in cleaned event files. If a bin has >2000 counts, and if more than 50% of those come from <1% of pixels, then it is considered to be noise-dominated and hence unusable.
| Quadrant | # 1 sec bins | Bins with >0 counts | Bins with >2000 counts | High rate bins dominated by noise | Noise dominated (total time) | Noise dominated (detector-on time) | Marked lightcurve |
|---|---|---|---|---|---|---|---|
| A | 7433 | 6089 | 57 | 57 | 0.77% | 0.94% | 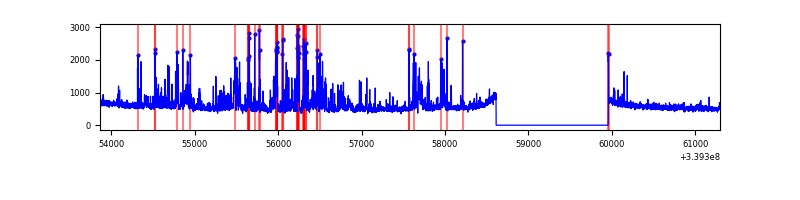 |
| B | 7434 | 6090 | 1 | 1 | 0.01% | 0.02% | 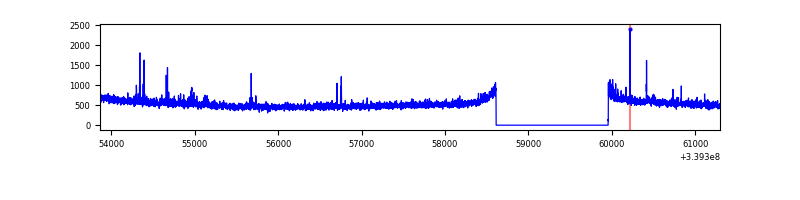 |
| C | 7434 | 6090 | 1 | 1 | 0.01% | 0.02% | 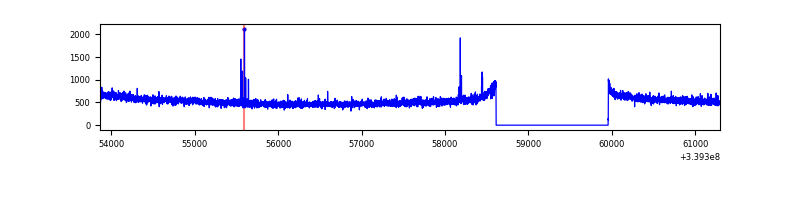 |
| D | 7433 | 6089 | 1982 | 1982 | 26.66% | 32.55% | 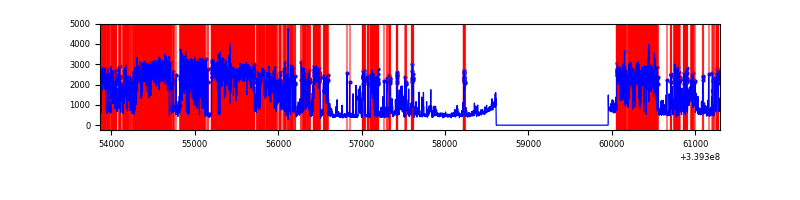 |
Top three noisy pixels from each quadrant. If the there are fewer than three noisy pixels in the level2.evt file, extra rows are filled as -1
| Pixel properties | Quadrant properties | ||||||
|---|---|---|---|---|---|---|---|
| Quadrant | DetID | PixID | Counts | Sigma | Mean | Median | Sigma |
| A | 14 | 235 | 771703 | 4789.72 | 816 | 802 | 160.9 |
| A | 13 | 248 | 19534 | 116.38 | 816 | 802 | 160.9 |
| A | 13 | 254 | 10545 | 60.53 | 816 | 802 | 160.9 |
| B | 3 | 112 | 38599 | 252.5 | 815 | 797 | 149.7 |
| B | 12 | 111 | 16888 | 107.48 | 815 | 797 | 149.7 |
| B | 5 | 172 | 15488 | 98.13 | 815 | 797 | 149.7 |
| C | 14 | 238 | 127353 | 690.73 | 790 | 796 | 183.2 |
| C | 15 | 208 | 12270 | 62.62 | 790 | 796 | 183.2 |
| C | 2 | 16 | 9427 | 47.11 | 790 | 796 | 183.2 |
| D | 1 | 52 | 5190058 | 28906.36 | 683 | 672 | 179.5 |
| D | 7 | 38 | 543186 | 3021.96 | 683 | 672 | 179.5 |
| D | 2 | 250 | 225170 | 1250.52 | 683 | 672 | 179.5 |
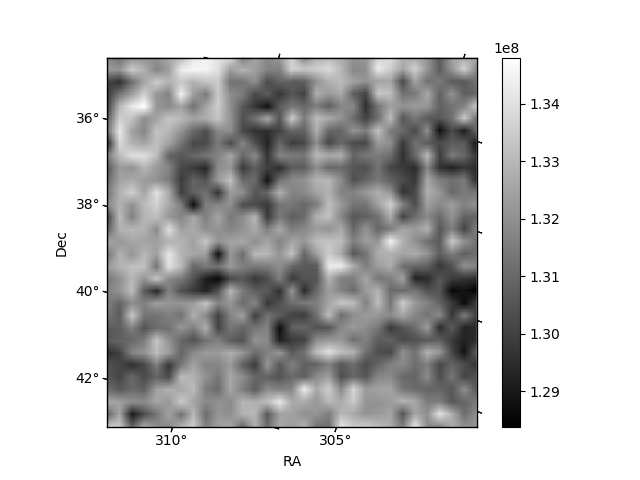
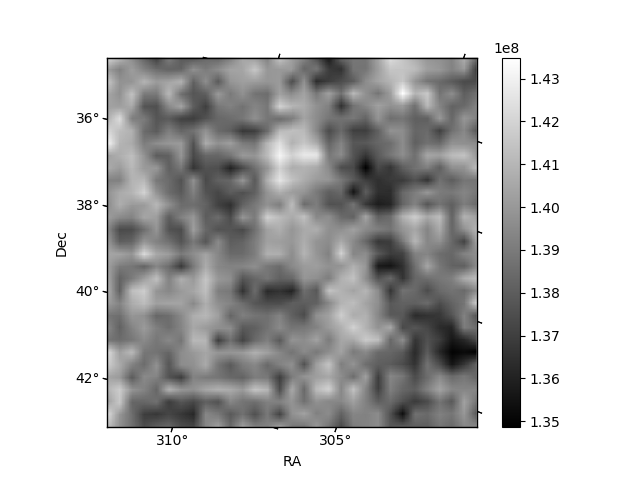
Histogram calculated using DETX and DETY for each event in the final _common_clean file
| Quadrant A | 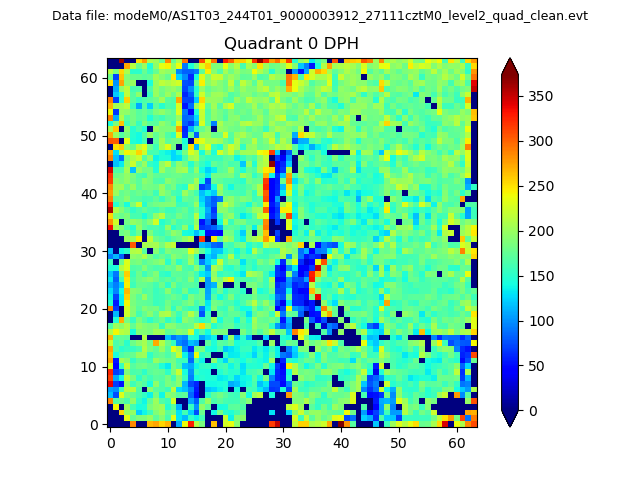 |
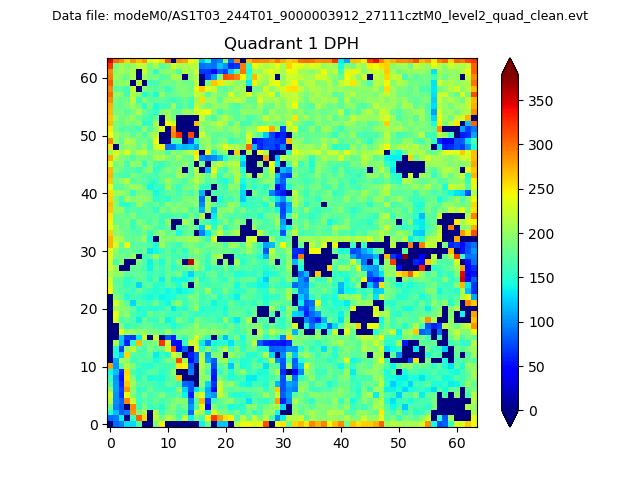 |
Quadrant B |
|---|---|---|---|
| Quadrant D |  |
 |
Quadrant C |
| Plot type | Count rate plots | Images |
|---|---|---|
| Comparison with Poisson distribution Blue bars denote a histogram of data divided into 1 sec bins. Red curve is a Poisson curve with rate = median count rate of data. |
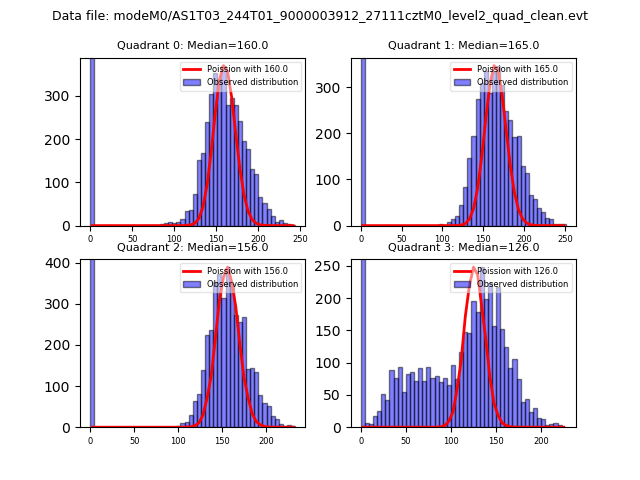 |
 |
| Quadrant-wise count rates Data is divided into 100 sec bins |
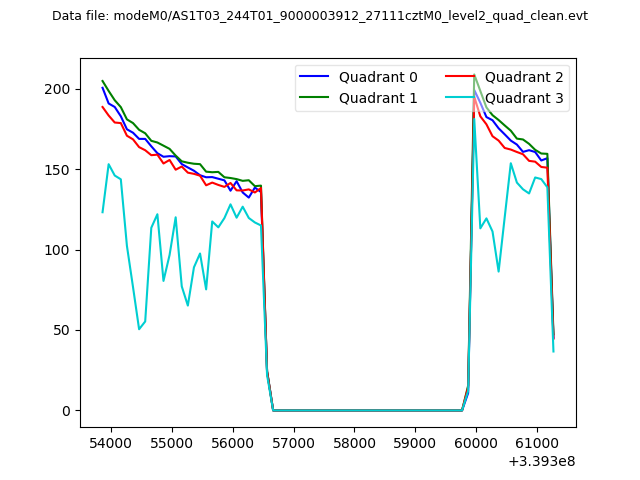 |
|
| Module-wise count rates for Quadrant A Data is divided into 100 sec bins |
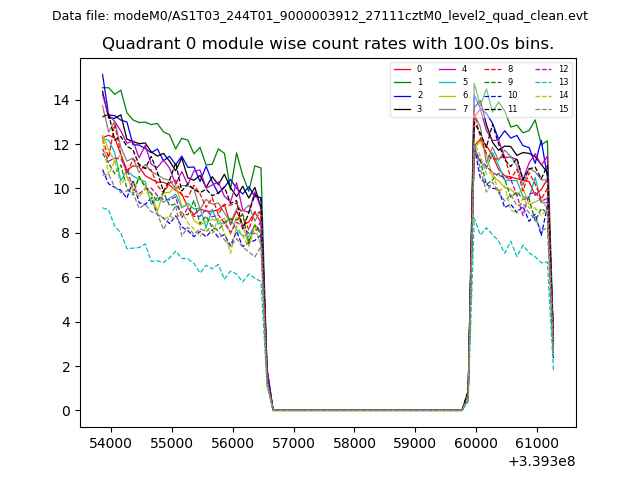 |
 |
| Module-wise count rates for Quadrant B Data is divided into 100 sec bins |
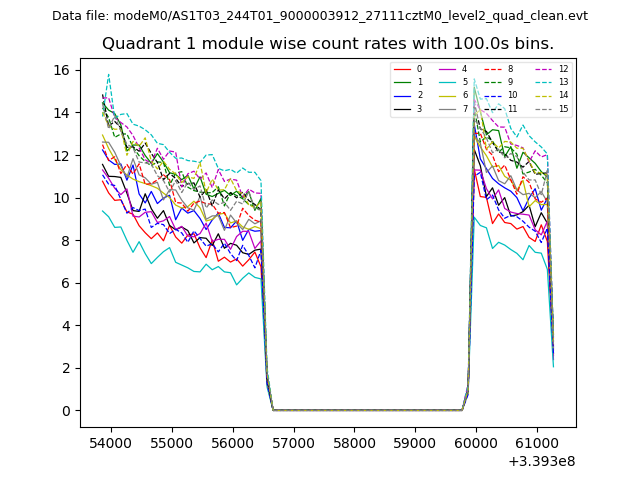 |
 |
| Module-wise count rates for Quadrant C Data is divided into 100 sec bins |
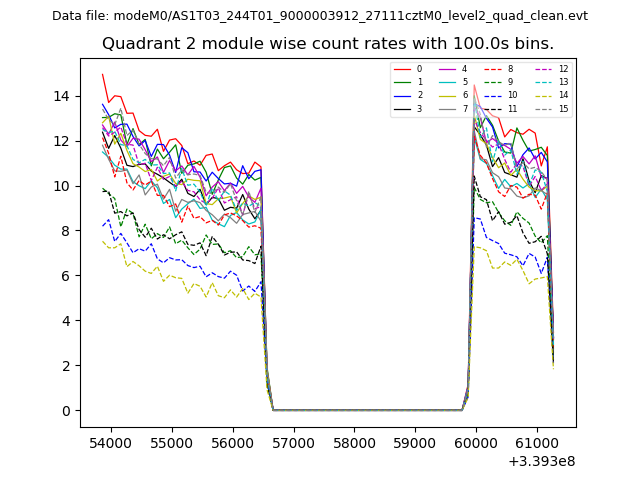 |
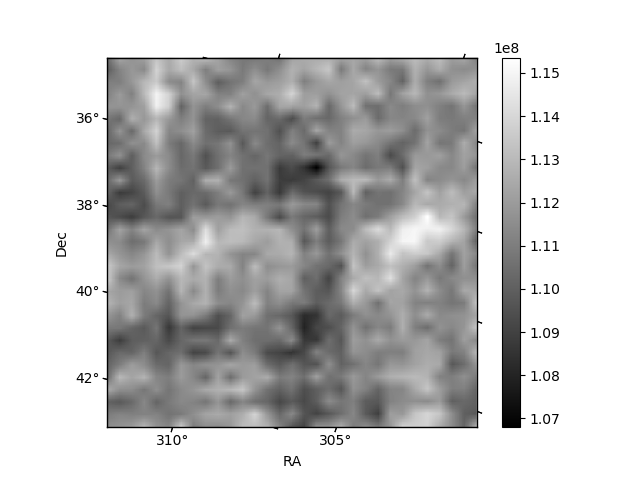 |
| Module-wise count rates for Quadrant D Data is divided into 100 sec bins |
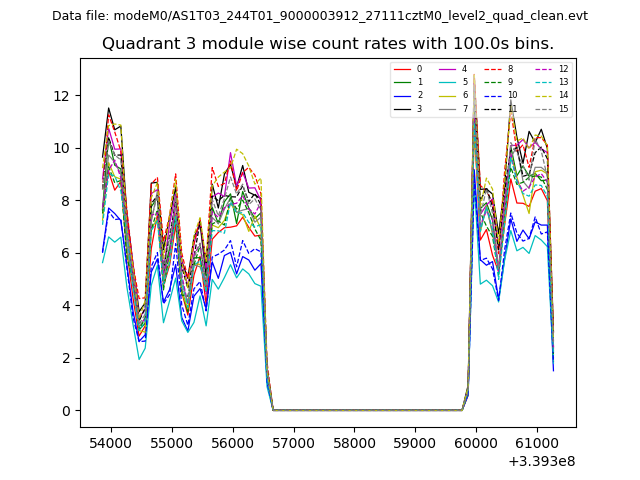 |
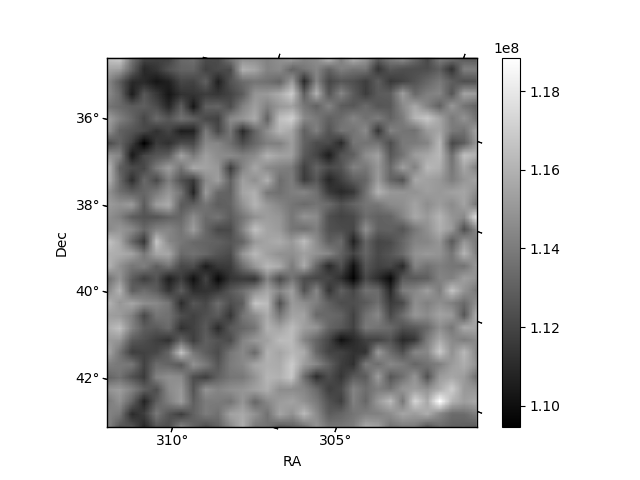 |
| Parameter | Plot |
|---|---|
| CZT HV Monitor | 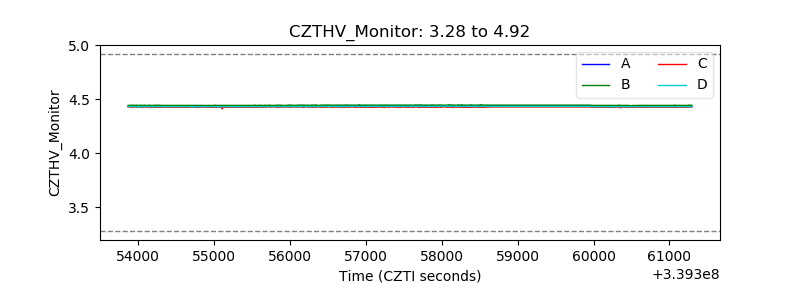 |
| D_VDD | 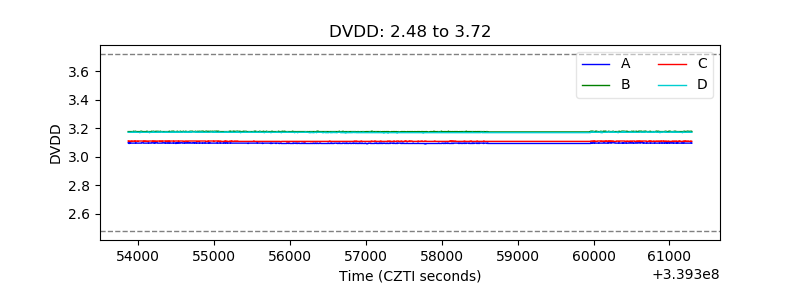 |
| Temperature 1 | 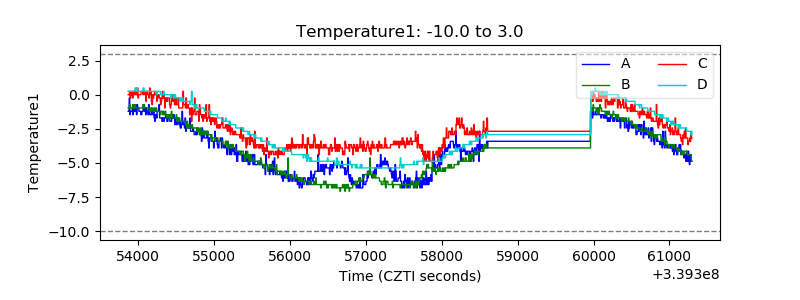 |
| Veto HV Monitor | 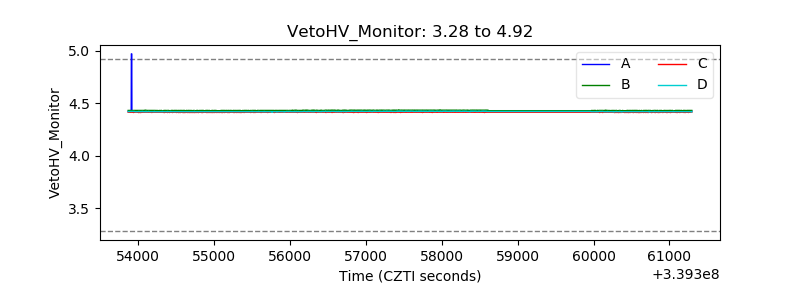 |
| Veto LLD | 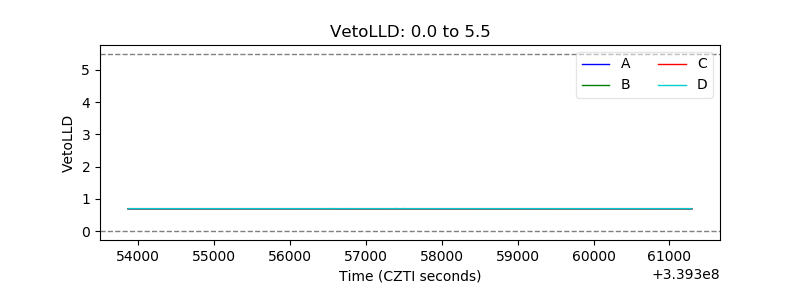 |
| Alpha Counter | 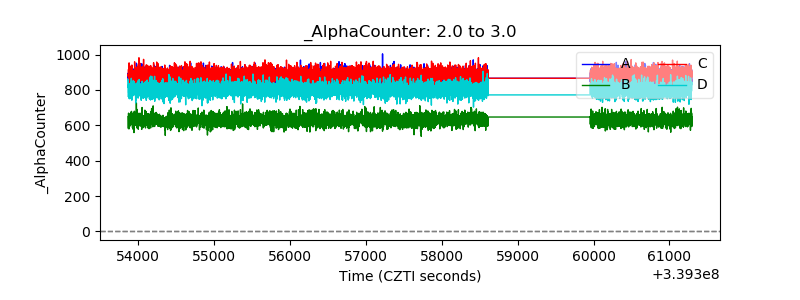 |
| _CPM_Rate | 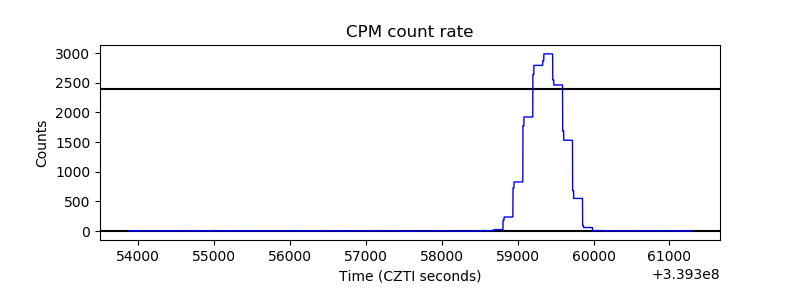 |
| CZT Counter |  |
| +2.5 Volts monitor |  |
| +5 Volts monitor | 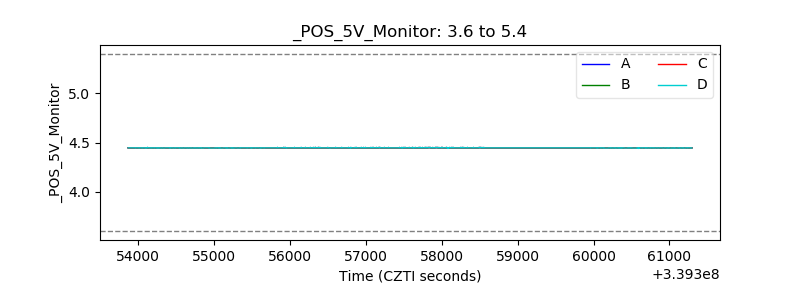 |
| _ROLL_ROT | 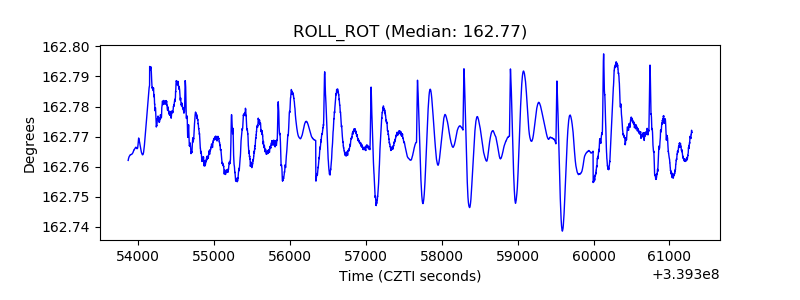 |
| _Roll_DEC | 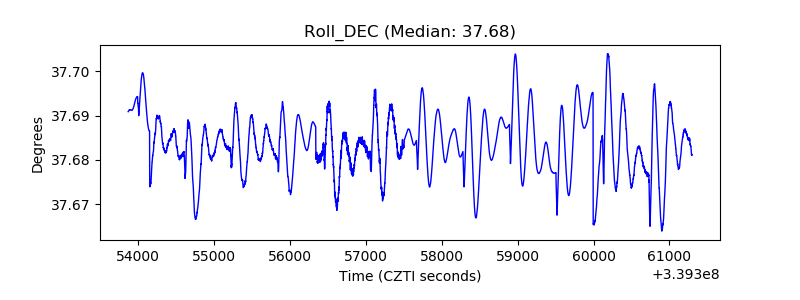 |
| _Roll_RA |  |
| Veto Counter | 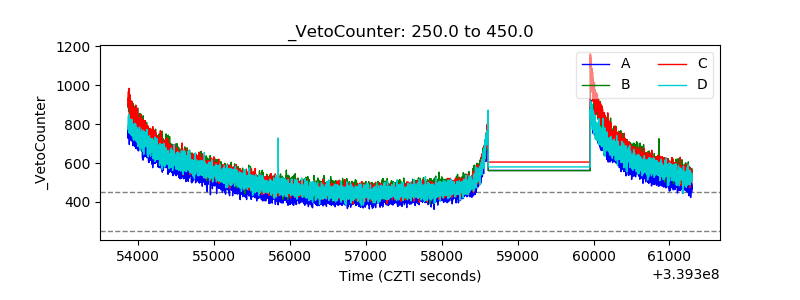 |