| Param | Original file | Final file |
|---|---|---|
| Filename | modeM0/AS1T03_244T01_9000003912_27112cztM0_level2.evt | modeM0/AS1T03_244T01_9000003912_27112cztM0_level2_quad_clean.evt |
| Size (bytes) | 644,495,040 | 92,465,280 |
| Size | 614.6 MB | 88.2 MB |
| Events in quadrant A | 4,383,993 | 623,652 |
| Events in quadrant B | 3,218,441 | 649,201 |
| Events in quadrant C | 3,214,583 | 613,609 |
| Events in quadrant D | 8,287,443 | 485,364 |
| Mode M9 | |||
|---|---|---|---|
| Quadrant | BADHDUFLAG | Total packets | Discarded packets |
| A | 0 | 17 | 0 |
| B | 0 | 18 | 0 |
| C | 0 | 18 | 0 |
| D | 0 | 18 | 0 |
| Mode M0 | |||
|---|---|---|---|
| Quadrant | BADHDUFLAG | Total packets | Discarded packets |
| A | 0 | 16893 | 0 |
| B | 0 | 13270 | 0 |
| C | 0 | 13242 | 0 |
| D | 0 | 28870 | 0 |
| Quadrant | Total seconds | Saturated seconds | Saturation percentage |
|---|---|---|---|
| A | 6130 | 248 | 4.045677% |
| B | 6130 | 51 | 0.831974% |
| C | 6130 | 89 | 1.451876% |
| D | 6129 | 1489 | 24.294338% |
Noise dominated data is calculated using 1-second bins in cleaned event files. If a bin has >2000 counts, and if more than 50% of those come from <1% of pixels, then it is considered to be noise-dominated and hence unusable.
| Quadrant | # 1 sec bins | Bins with >0 counts | Bins with >2000 counts | High rate bins dominated by noise | Noise dominated (total time) | Noise dominated (detector-on time) | Marked lightcurve |
|---|---|---|---|---|---|---|---|
| A | 7480 | 6131 | 195 | 195 | 2.61% | 3.18% | 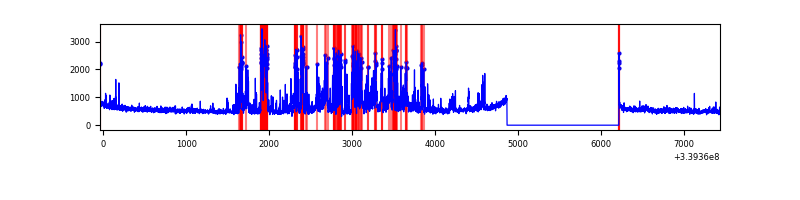 |
| B | 7480 | 6131 | 3 | 3 | 0.04% | 0.05% | 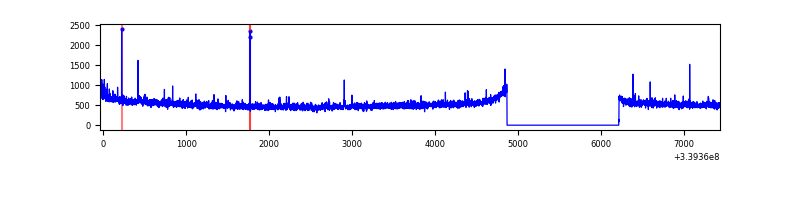 |
| C | 7480 | 6131 | 4 | 4 | 0.05% | 0.07% |  |
| D | 7479 | 6130 | 1517 | 1517 | 20.28% | 24.75% |  |
Top three noisy pixels from each quadrant. If the there are fewer than three noisy pixels in the level2.evt file, extra rows are filled as -1
| Pixel properties | Quadrant properties | ||||||
|---|---|---|---|---|---|---|---|
| Quadrant | DetID | PixID | Counts | Sigma | Mean | Median | Sigma |
| A | 14 | 235 | 1275301 | 8128.23 | 797 | 784 | 156.8 |
| A | 8 | 192 | 17396 | 105.94 | 797 | 784 | 156.8 |
| A | 12 | 189 | 11897 | 70.87 | 797 | 784 | 156.8 |
| B | 3 | 112 | 26797 | 173.08 | 807 | 787 | 150.3 |
| B | 12 | 111 | 17348 | 110.21 | 807 | 787 | 150.3 |
| B | 11 | 111 | 15544 | 98.2 | 807 | 787 | 150.3 |
| C | 14 | 238 | 125420 | 687.34 | 782 | 791 | 181.3 |
| C | 15 | 208 | 26950 | 144.27 | 782 | 791 | 181.3 |
| C | 3 | 233 | 7755 | 38.4 | 782 | 791 | 181.3 |
| D | 1 | 52 | 4984518 | 27294.09 | 696 | 686 | 182.6 |
| D | 7 | 38 | 403781 | 2207.56 | 696 | 686 | 182.6 |
| D | 2 | 250 | 173795 | 948.04 | 696 | 686 | 182.6 |
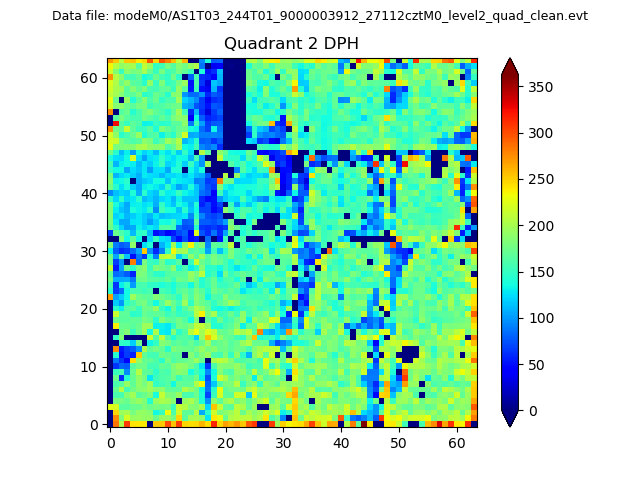
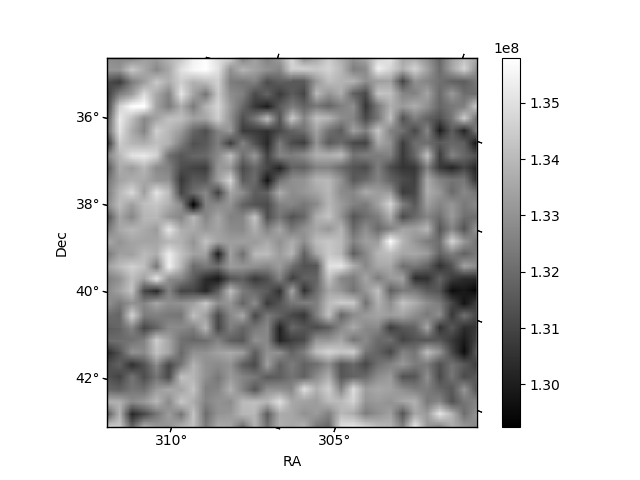
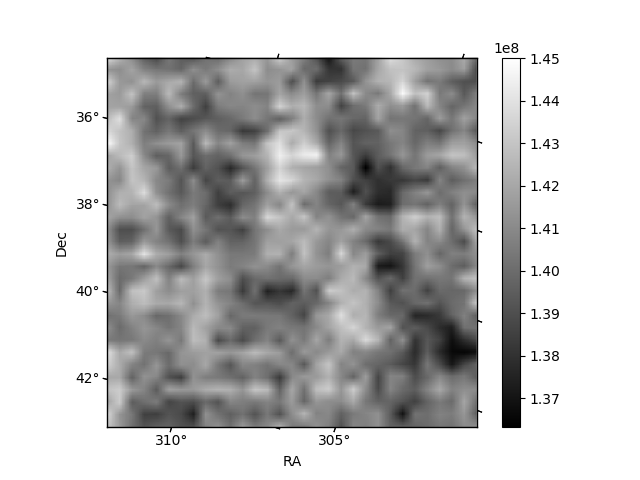
Histogram calculated using DETX and DETY for each event in the final _common_clean file
| Quadrant A | 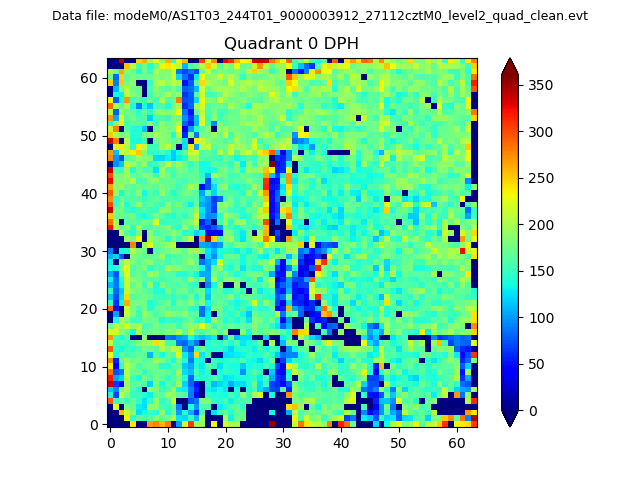 |
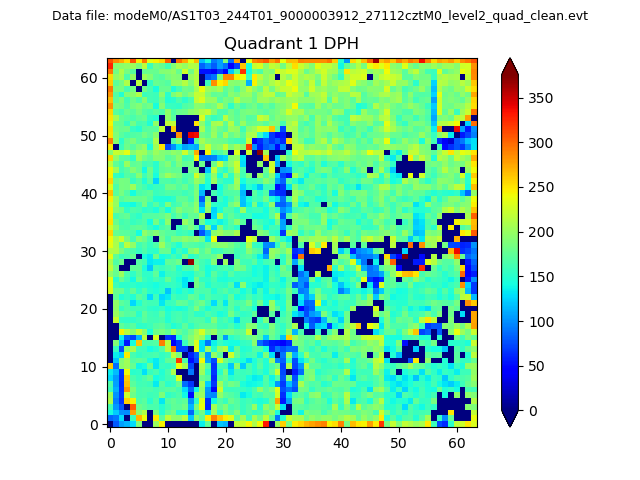 |
Quadrant B |
|---|---|---|---|
| Quadrant D | 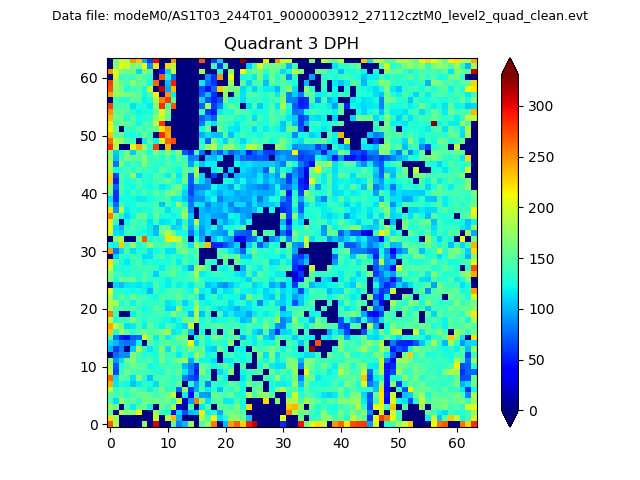 |
 |
Quadrant C |
| Plot type | Count rate plots | Images |
|---|---|---|
| Comparison with Poisson distribution Blue bars denote a histogram of data divided into 1 sec bins. Red curve is a Poisson curve with rate = median count rate of data. |
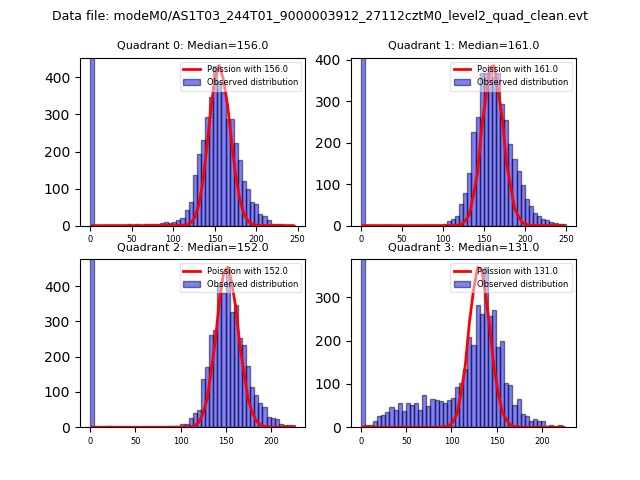 |
 |
| Quadrant-wise count rates Data is divided into 100 sec bins |
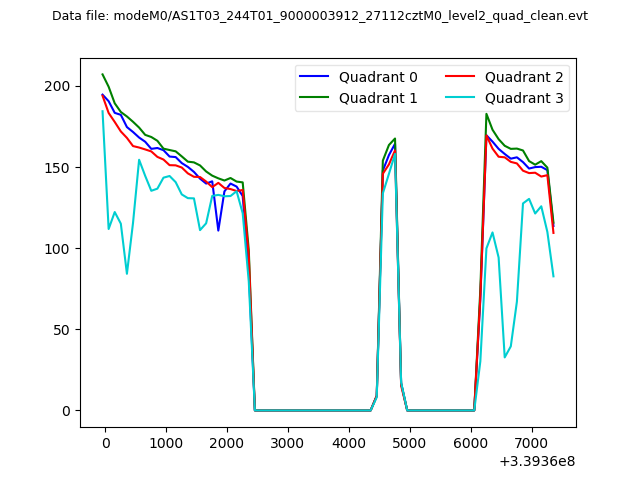 |
|
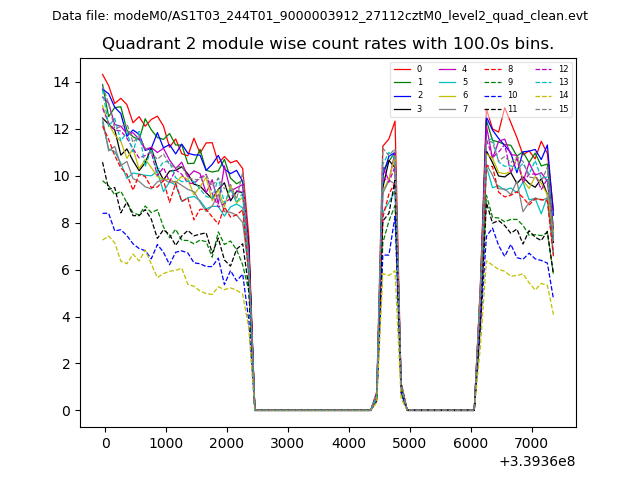
| Module-wise count rates for Quadrant A Data is divided into 100 sec bins |
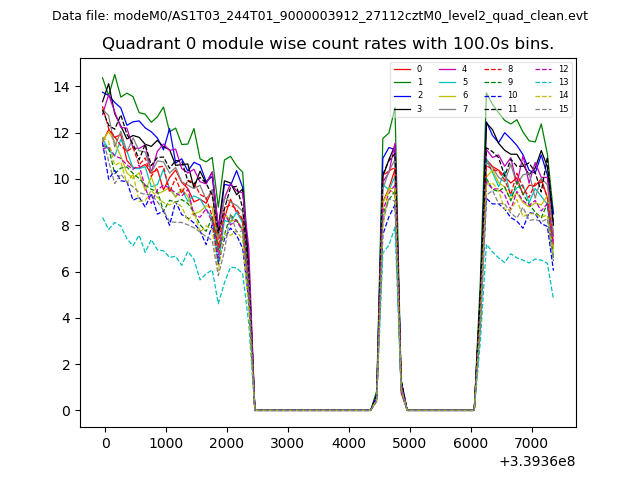 |
 |
| Module-wise count rates for Quadrant B Data is divided into 100 sec bins |
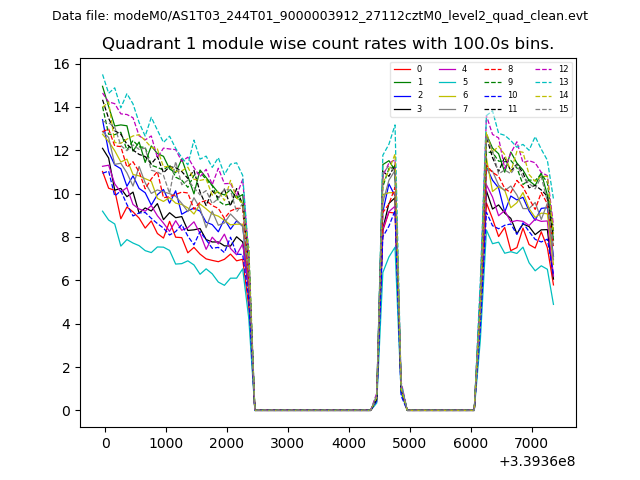 |
 |
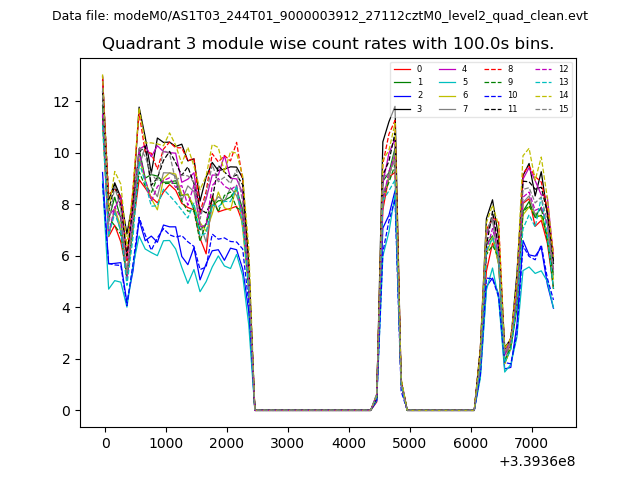
| Module-wise count rates for Quadrant C Data is divided into 100 sec bins |
 |
 |
| Module-wise count rates for Quadrant D Data is divided into 100 sec bins |
 |
 |
| Parameter | Plot |
|---|---|
| CZT HV Monitor | 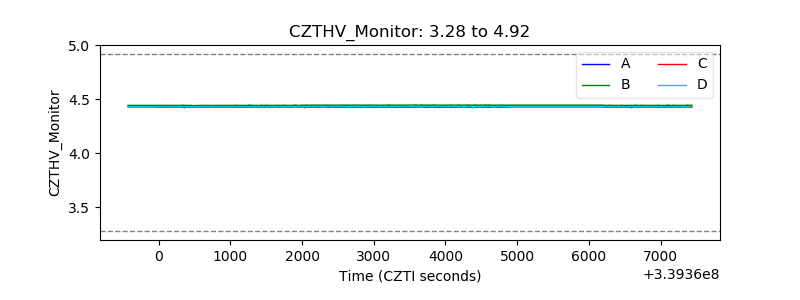 |
| D_VDD |  |
| Temperature 1 | 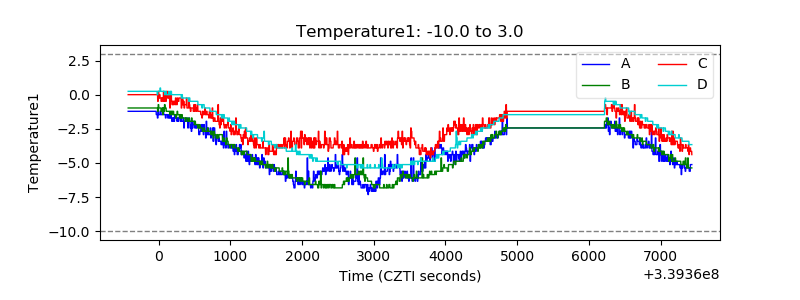 |
| Veto HV Monitor |  |
| Veto LLD | 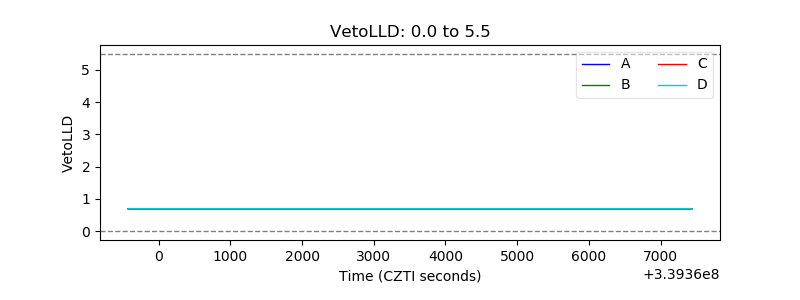 |
| Alpha Counter | 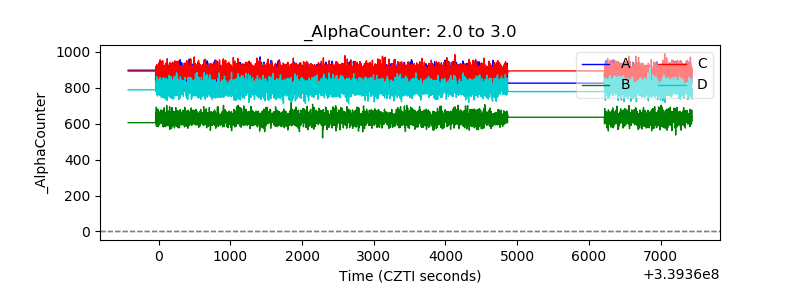 |
| _CPM_Rate | 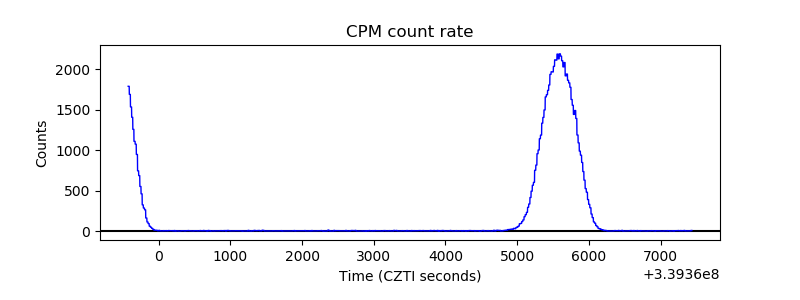 |
| CZT Counter | 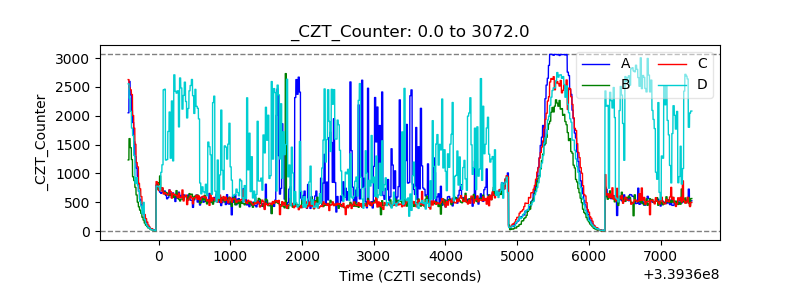 |
| +2.5 Volts monitor |  |
| +5 Volts monitor |  |
| _ROLL_ROT | 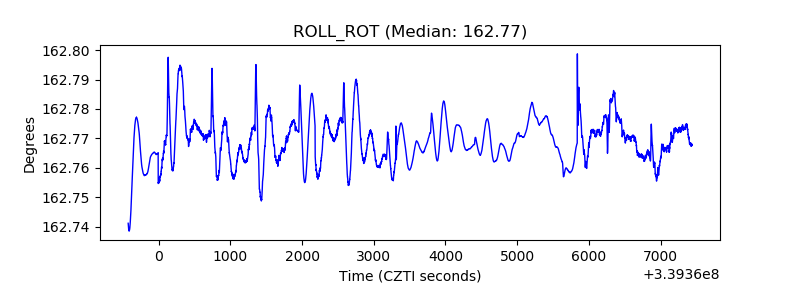 |
| _Roll_DEC | 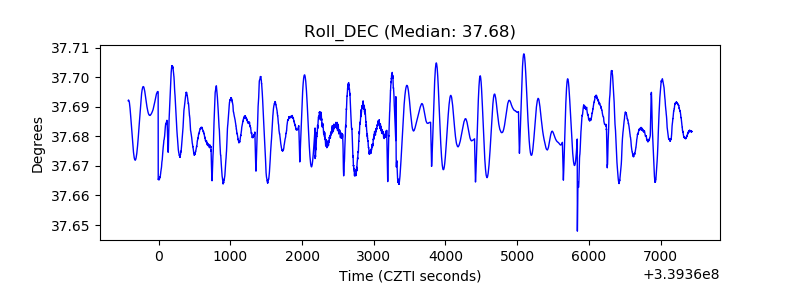 |
| _Roll_RA | 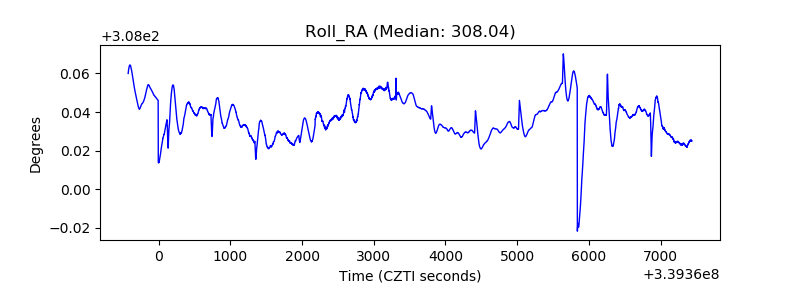 |
| Veto Counter | 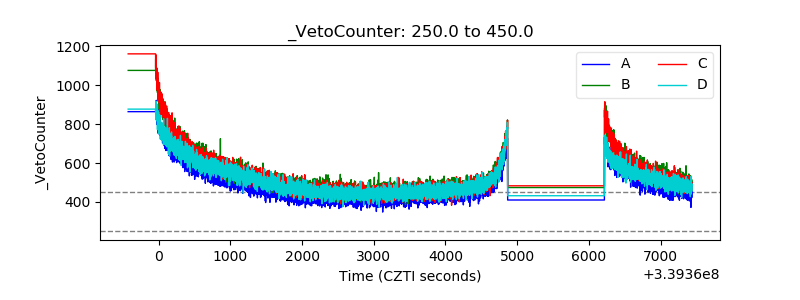 |