| Param | Original file | Final file |
|---|---|---|
| Filename | modeM0/AS1T03_244T01_9000003912_27113cztM0_level2.evt | modeM0/AS1T03_244T01_9000003912_27113cztM0_level2_quad_clean.evt |
| Size (bytes) | 641,056,320 | 92,361,600 |
| Size | 611.4 MB | 88.1 MB |
| Events in quadrant A | 3,957,678 | 623,087 |
| Events in quadrant B | 3,243,953 | 644,175 |
| Events in quadrant C | 3,236,948 | 611,861 |
| Events in quadrant D | 8,540,301 | 468,442 |
| Mode M9 | |||
|---|---|---|---|
| Quadrant | BADHDUFLAG | Total packets | Discarded packets |
| A | 0 | 11 | 0 |
| B | 0 | 12 | 0 |
| C | 0 | 12 | 0 |
| D | 0 | 12 | 0 |
| Mode M0 | |||
|---|---|---|---|
| Quadrant | BADHDUFLAG | Total packets | Discarded packets |
| A | 0 | 15805 | 0 |
| B | 0 | 13593 | 0 |
| C | 0 | 13558 | 0 |
| D | 0 | 29834 | 0 |
| Quadrant | Total seconds | Saturated seconds | Saturation percentage |
|---|---|---|---|
| A | 6427 | 195 | 3.034075% |
| B | 6426 | 51 | 0.793651% |
| C | 6426 | 84 | 1.307190% |
| D | 6426 | 1912 | 29.754124% |
Noise dominated data is calculated using 1-second bins in cleaned event files. If a bin has >2000 counts, and if more than 50% of those come from <1% of pixels, then it is considered to be noise-dominated and hence unusable.
| Quadrant | # 1 sec bins | Bins with >0 counts | Bins with >2000 counts | High rate bins dominated by noise | Noise dominated (total time) | Noise dominated (detector-on time) | Marked lightcurve |
|---|---|---|---|---|---|---|---|
| A | 7582 | 6428 | 167 | 167 | 2.20% | 2.60% | 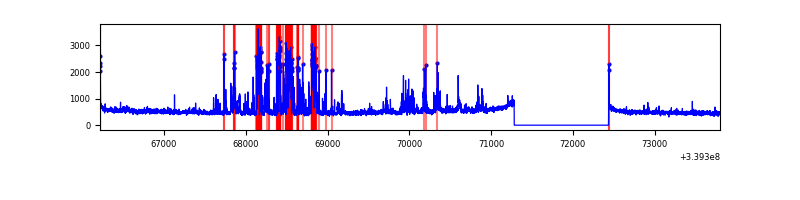 |
| B | 7581 | 6427 | 0 | 0 | 0.00% | 0.00% | 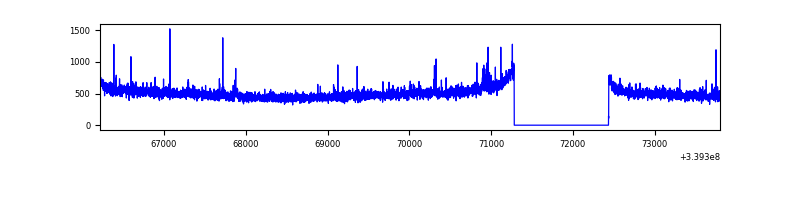 |
| C | 7581 | 6427 | 2 | 2 | 0.03% | 0.03% | 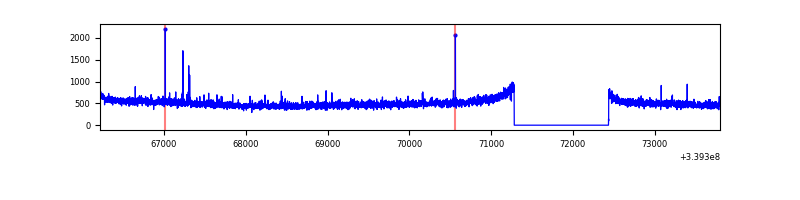 |
| D | 7581 | 6427 | 1965 | 1965 | 25.92% | 30.57% | 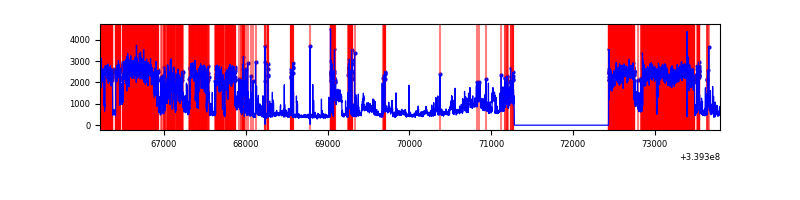 |
Top three noisy pixels from each quadrant. If the there are fewer than three noisy pixels in the level2.evt file, extra rows are filled as -1
| Pixel properties | Quadrant properties | ||||||
|---|---|---|---|---|---|---|---|
| Quadrant | DetID | PixID | Counts | Sigma | Mean | Median | Sigma |
| A | 14 | 235 | 843938 | 5307.13 | 801 | 784 | 158.9 |
| A | 8 | 192 | 17972 | 108.19 | 801 | 784 | 158.9 |
| A | 13 | 254 | 10348 | 60.2 | 801 | 784 | 158.9 |
| B | 3 | 112 | 41412 | 266.12 | 813 | 791 | 152.6 |
| B | 12 | 111 | 18271 | 114.52 | 813 | 791 | 152.6 |
| B | 11 | 111 | 16051 | 99.97 | 813 | 791 | 152.6 |
| C | 14 | 238 | 127316 | 683.0 | 789 | 794 | 185.2 |
| C | 15 | 208 | 23569 | 122.95 | 789 | 794 | 185.2 |
| C | 3 | 233 | 6642 | 31.57 | 789 | 794 | 185.2 |
| D | 1 | 52 | 5252984 | 28820.7 | 690 | 675 | 182.2 |
| D | 7 | 38 | 321994 | 1763.15 | 690 | 675 | 182.2 |
| D | 2 | 250 | 207171 | 1133.09 | 690 | 675 | 182.2 |
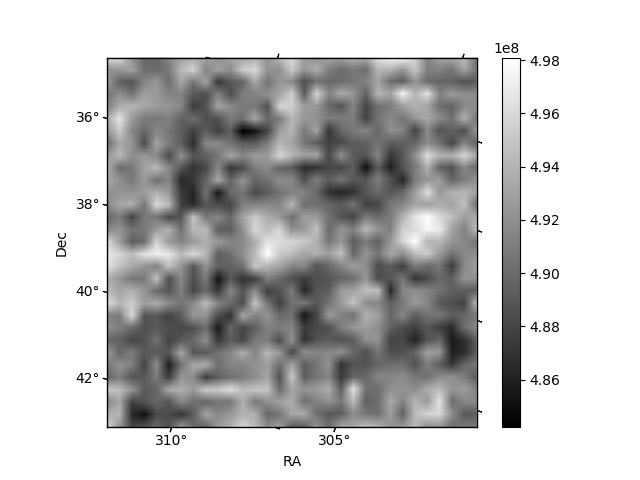
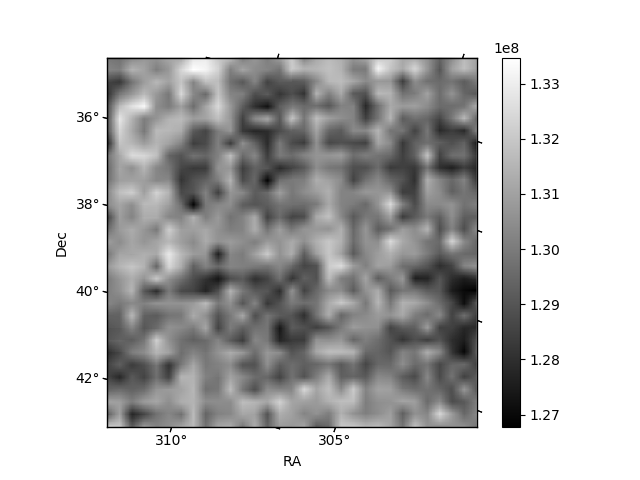
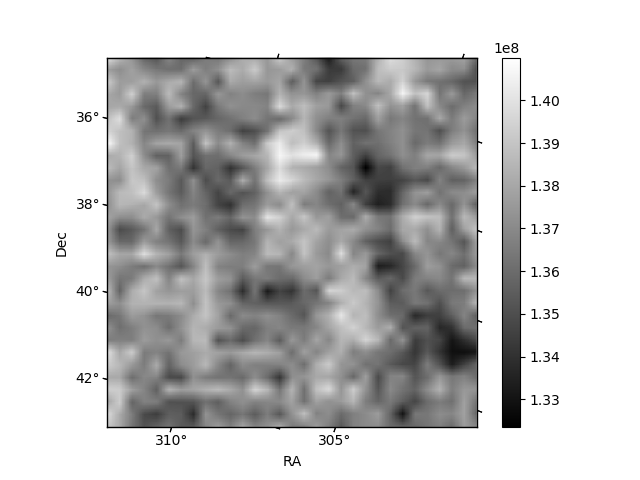
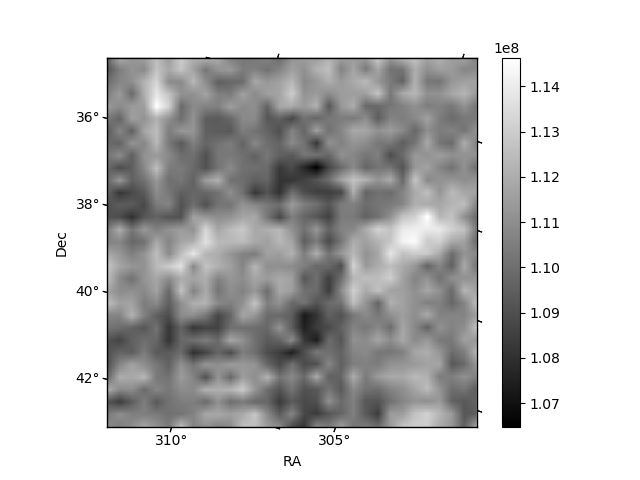
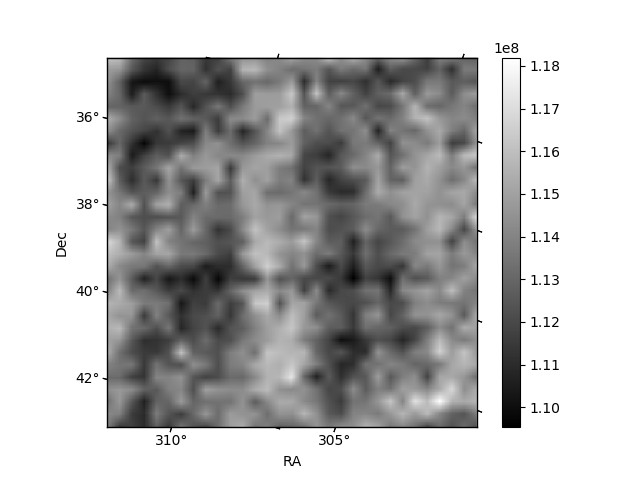
Histogram calculated using DETX and DETY for each event in the final _common_clean file
| Quadrant A | 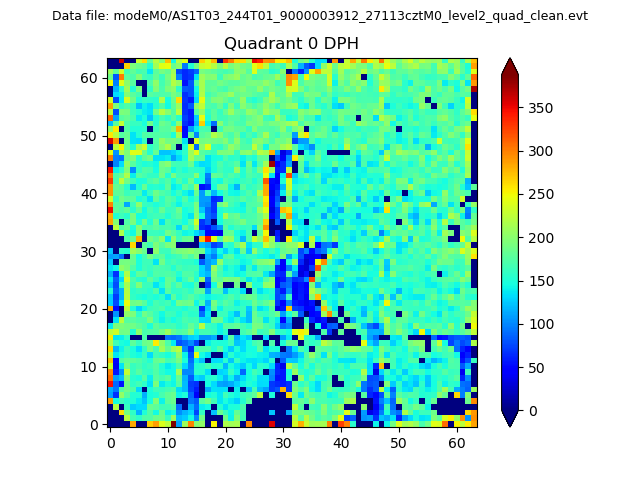 |
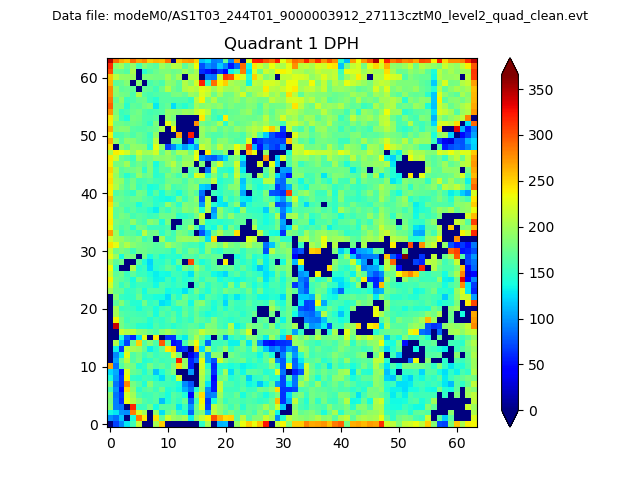 |
Quadrant B |
|---|---|---|---|
| Quadrant D | 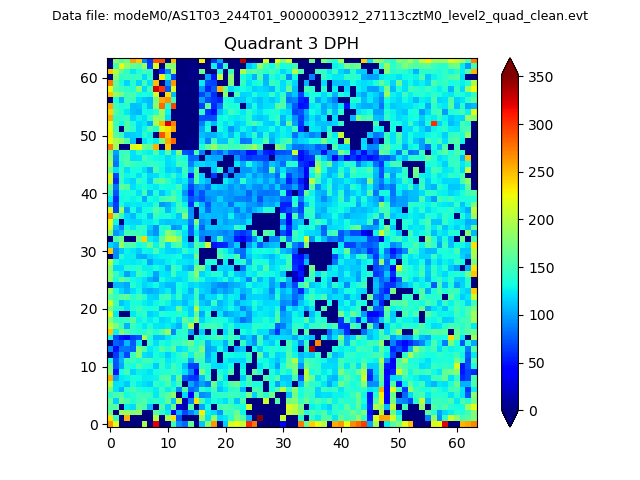 |
 |
Quadrant C |
| Plot type | Count rate plots | Images |
|---|---|---|
| Comparison with Poisson distribution Blue bars denote a histogram of data divided into 1 sec bins. Red curve is a Poisson curve with rate = median count rate of data. |
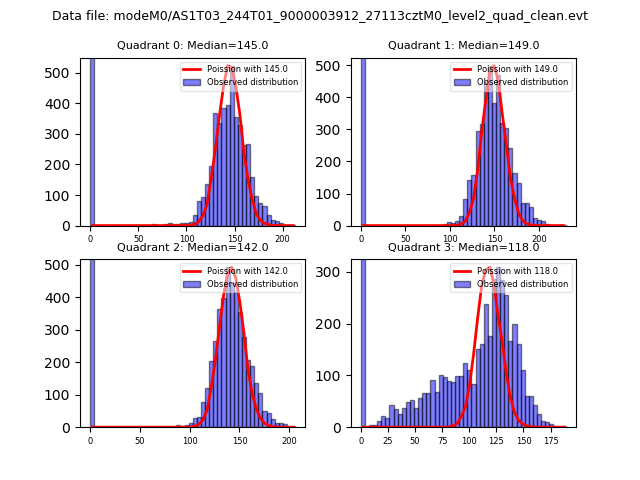 |
 |
| Quadrant-wise count rates Data is divided into 100 sec bins |
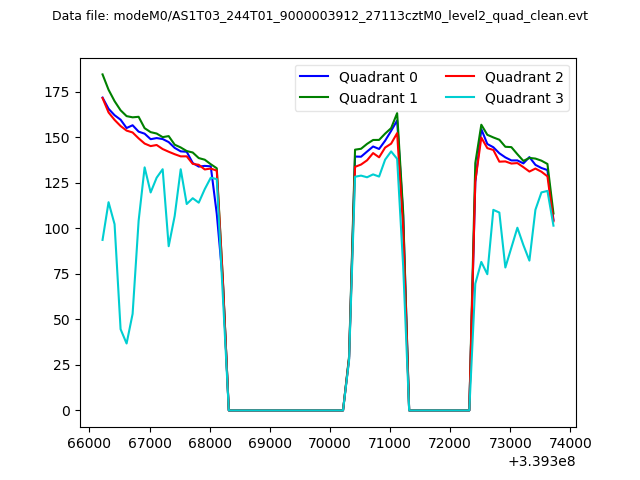 |
|
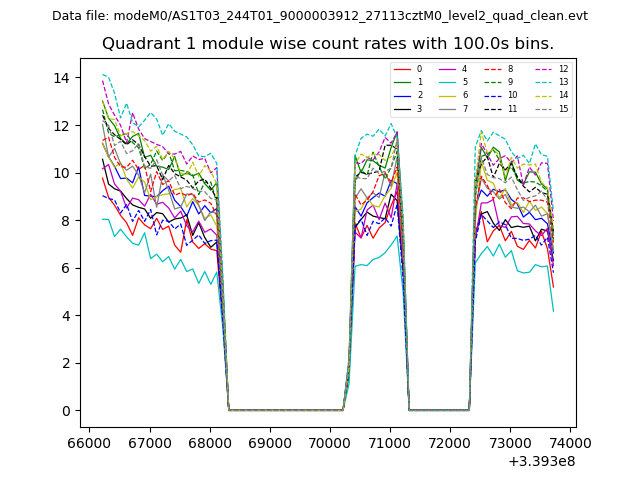
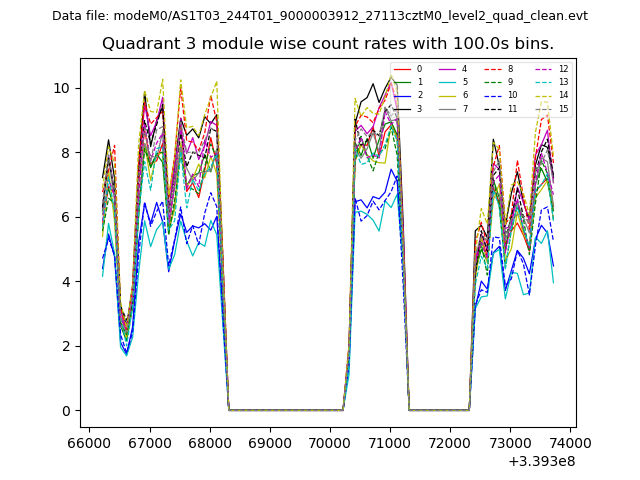
| Module-wise count rates for Quadrant A Data is divided into 100 sec bins |
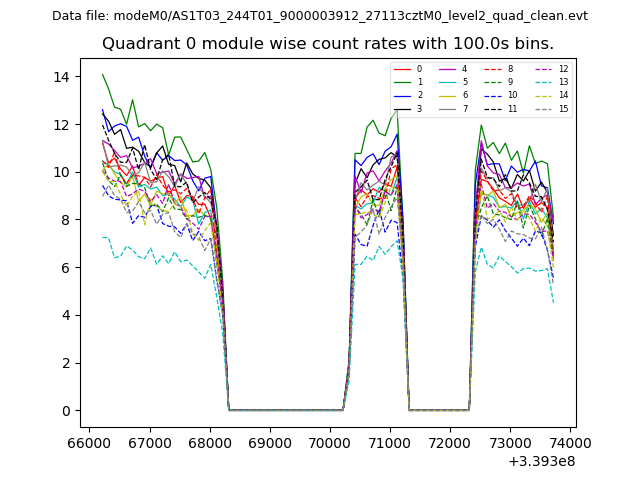 |
 |
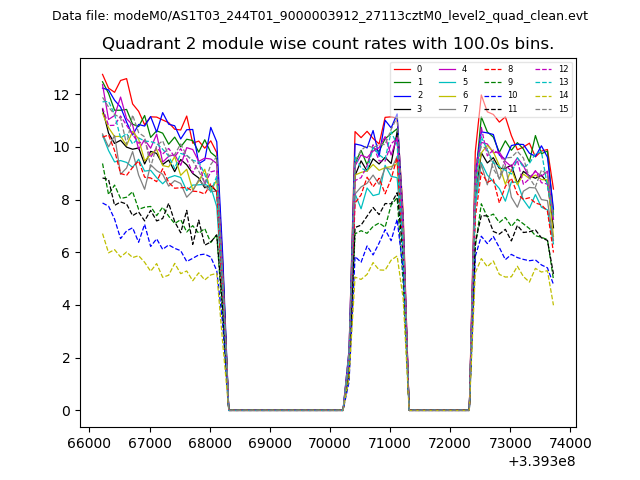
| Module-wise count rates for Quadrant B Data is divided into 100 sec bins |
 |
 |
| Module-wise count rates for Quadrant C Data is divided into 100 sec bins |
 |
 |
| Module-wise count rates for Quadrant D Data is divided into 100 sec bins |
 |
 |
| Parameter | Plot |
|---|---|
| CZT HV Monitor | 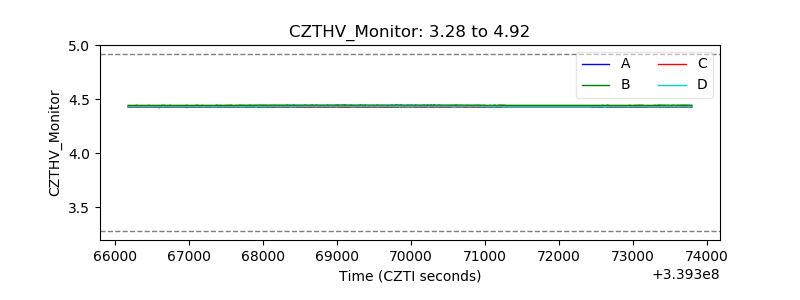 |
| D_VDD | 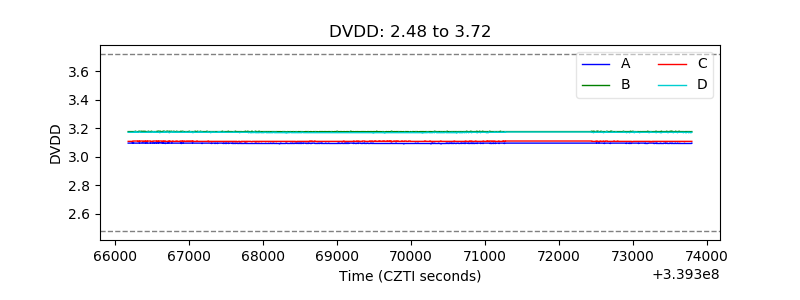 |
| Temperature 1 | 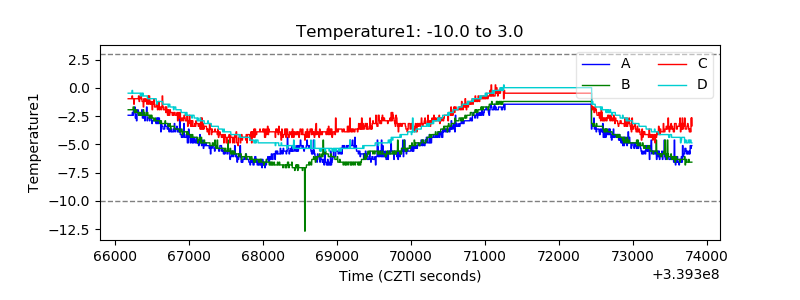 |
| Veto HV Monitor | 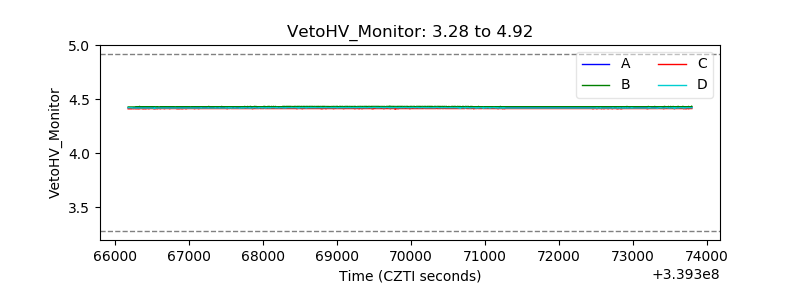 |
| Veto LLD | 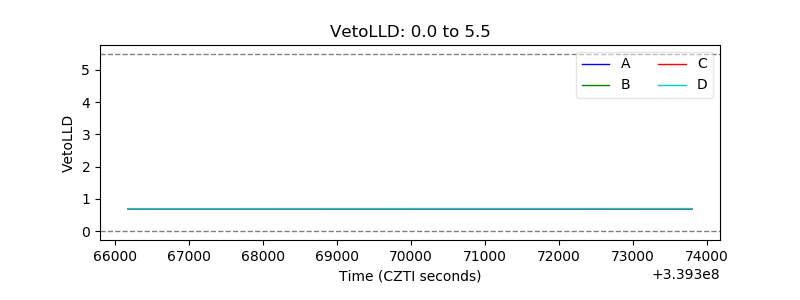 |
| Alpha Counter | 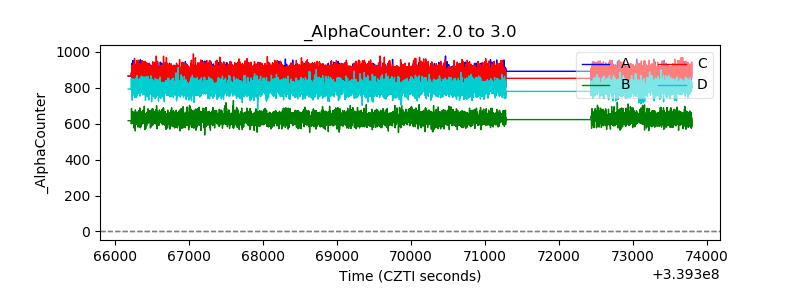 |
| _CPM_Rate | 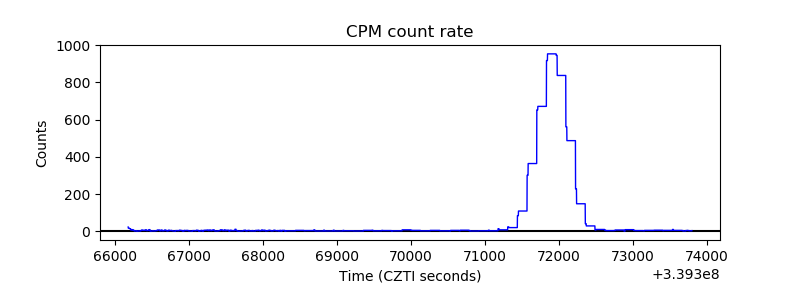 |
| CZT Counter | 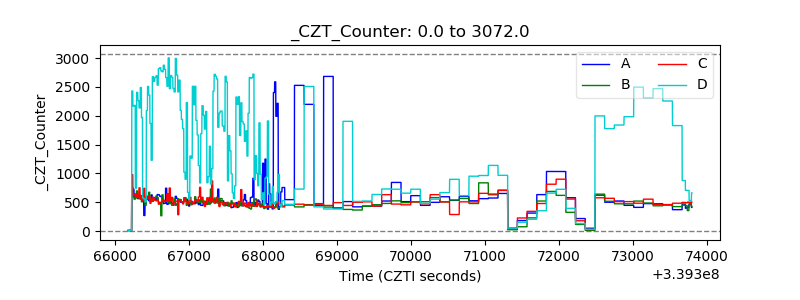 |
| +2.5 Volts monitor |  |
| +5 Volts monitor |  |
| _ROLL_ROT | 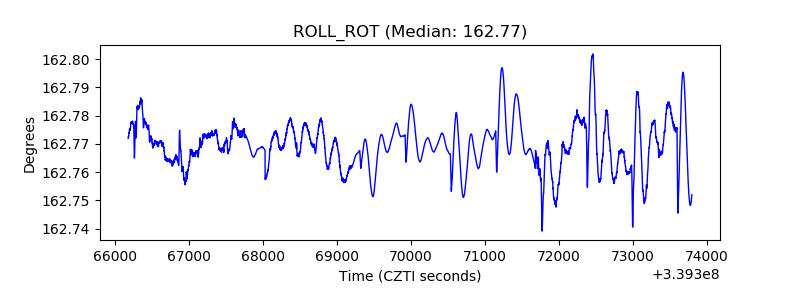 |
| _Roll_DEC |  |
| _Roll_RA | 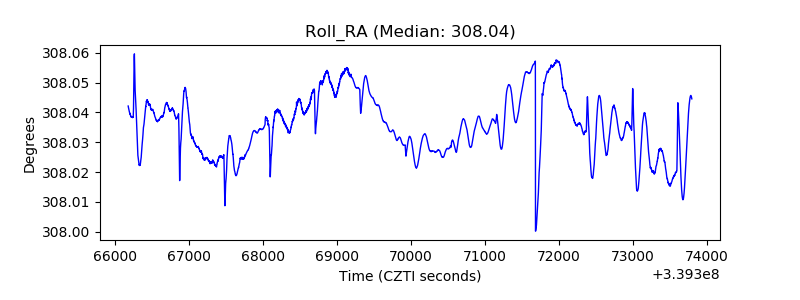 |
| Veto Counter | 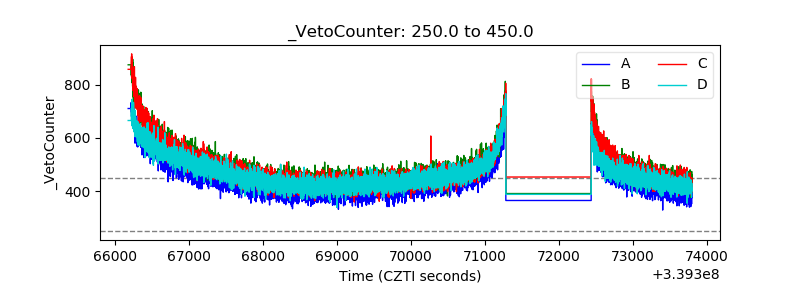 |