| Param | Original file | Final file |
|---|---|---|
| Filename | modeM0/AS1T03_244T01_9000003912_27114cztM0_level2.evt | modeM0/AS1T03_244T01_9000003912_27114cztM0_level2_quad_clean.evt |
| Size (bytes) | 552,352,320 | 95,895,360 |
| Size | 526.8 MB | 91.5 MB |
| Events in quadrant A | 3,498,766 | 625,434 |
| Events in quadrant B | 3,393,881 | 641,995 |
| Events in quadrant C | 3,315,067 | 612,714 |
| Events in quadrant D | 6,054,107 | 544,757 |
| Mode M9 | |||
|---|---|---|---|
| Quadrant | BADHDUFLAG | Total packets | Discarded packets |
| A | 0 | 17 | 0 |
| B | 0 | 18 | 0 |
| C | 0 | 18 | 0 |
| D | 0 | 18 | 0 |
| Mode M0 | |||
|---|---|---|---|
| Quadrant | BADHDUFLAG | Total packets | Discarded packets |
| A | 0 | 14838 | 0 |
| B | 0 | 14410 | 0 |
| C | 0 | 14163 | 0 |
| D | 0 | 22723 | 0 |
| Quadrant | Total seconds | Saturated seconds | Saturation percentage |
|---|---|---|---|
| A | 6869 | 54 | 0.786141% |
| B | 6869 | 55 | 0.800699% |
| C | 6869 | 91 | 1.324793% |
| D | 6869 | 1001 | 14.572718% |
Noise dominated data is calculated using 1-second bins in cleaned event files. If a bin has >2000 counts, and if more than 50% of those come from <1% of pixels, then it is considered to be noise-dominated and hence unusable.
| Quadrant | # 1 sec bins | Bins with >0 counts | Bins with >2000 counts | High rate bins dominated by noise | Noise dominated (total time) | Noise dominated (detector-on time) | Marked lightcurve |
|---|---|---|---|---|---|---|---|
| A | 7684 | 6870 | 6 | 6 | 0.08% | 0.09% | 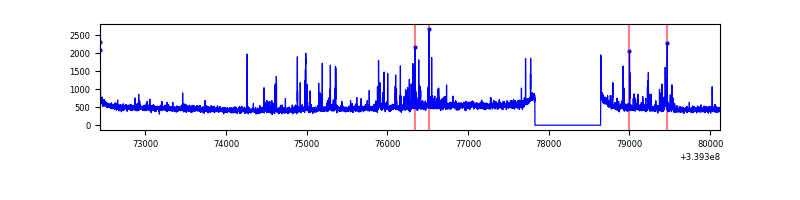 |
| B | 7684 | 6870 | 0 | 0 | 0.00% | 0.00% | 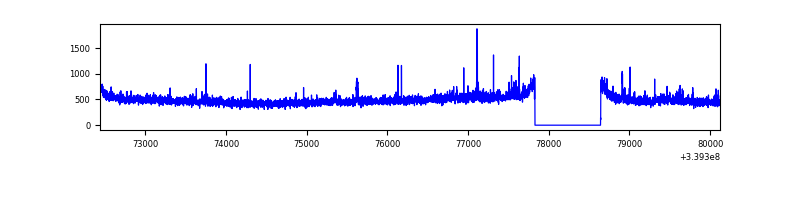 |
| C | 7684 | 6870 | 0 | 0 | 0.00% | 0.00% | 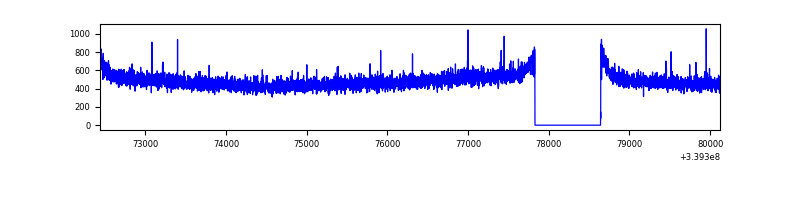 |
| D | 7684 | 6870 | 994 | 994 | 12.94% | 14.47% | 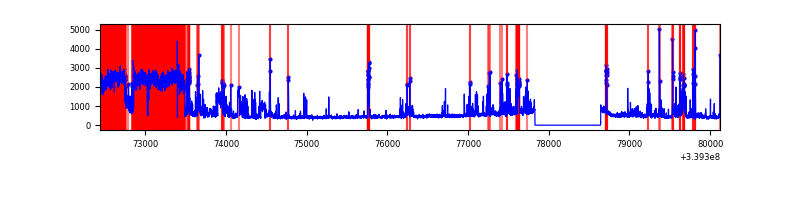 |
Top three noisy pixels from each quadrant. If the there are fewer than three noisy pixels in the level2.evt file, extra rows are filled as -1
| Pixel properties | Quadrant properties | ||||||
|---|---|---|---|---|---|---|---|
| Quadrant | DetID | PixID | Counts | Sigma | Mean | Median | Sigma |
| A | 14 | 235 | 228697 | 1347.39 | 838 | 820 | 169.1 |
| A | 12 | 189 | 17902 | 101.0 | 838 | 820 | 169.1 |
| A | 8 | 192 | 16054 | 90.08 | 838 | 820 | 169.1 |
| B | 3 | 112 | 31902 | 193.35 | 840 | 818 | 160.8 |
| B | 0 | 189 | 24027 | 144.37 | 840 | 818 | 160.8 |
| B | 12 | 111 | 19381 | 115.47 | 840 | 818 | 160.8 |
| C | 14 | 238 | 130839 | 683.62 | 814 | 818 | 190.2 |
| C | 15 | 208 | 10967 | 53.36 | 814 | 818 | 190.2 |
| C | 13 | 61 | 5693 | 25.63 | 814 | 818 | 190.2 |
| D | 1 | 52 | 2350987 | 11620.44 | 769 | 753 | 202.3 |
| D | 7 | 38 | 361477 | 1783.55 | 769 | 753 | 202.3 |
| D | 2 | 250 | 262016 | 1291.78 | 769 | 753 | 202.3 |
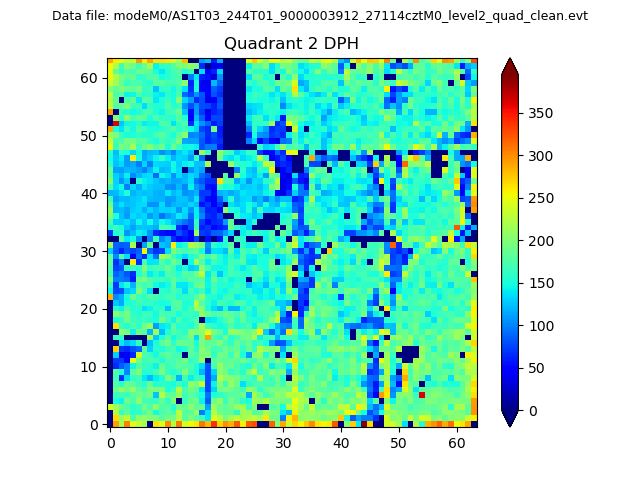
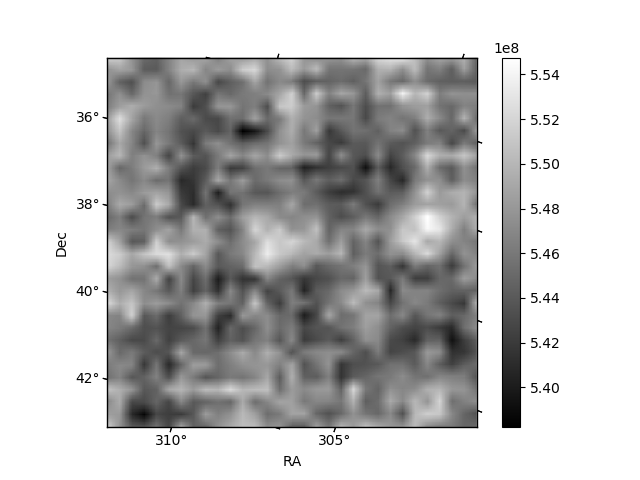
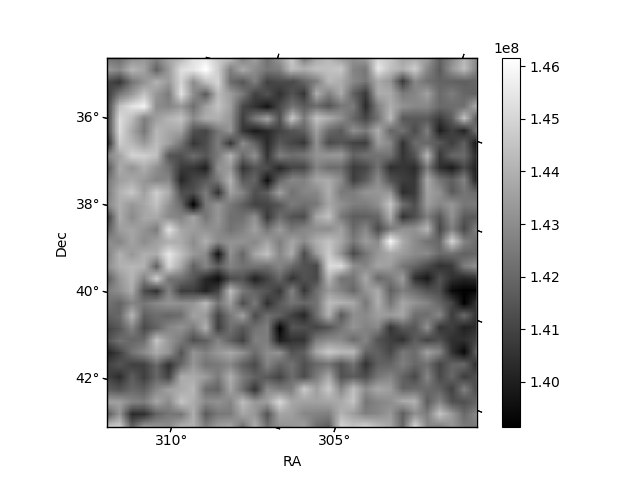
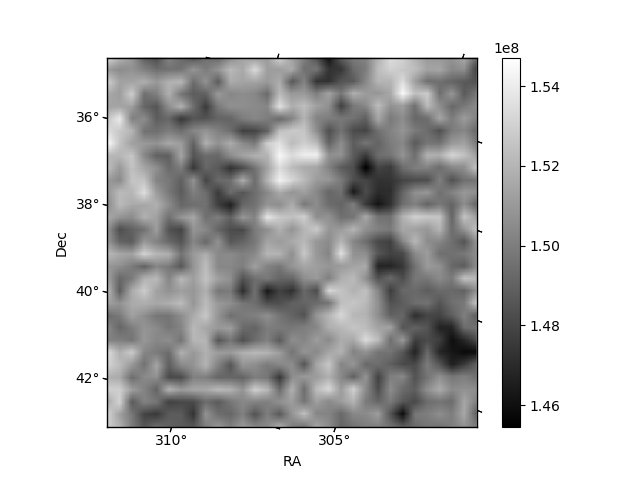
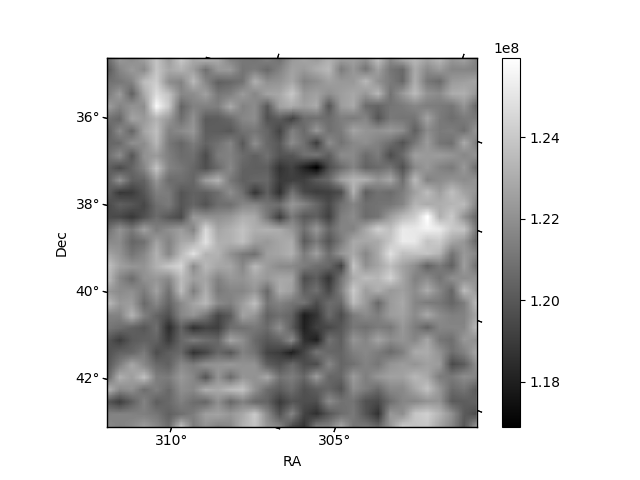
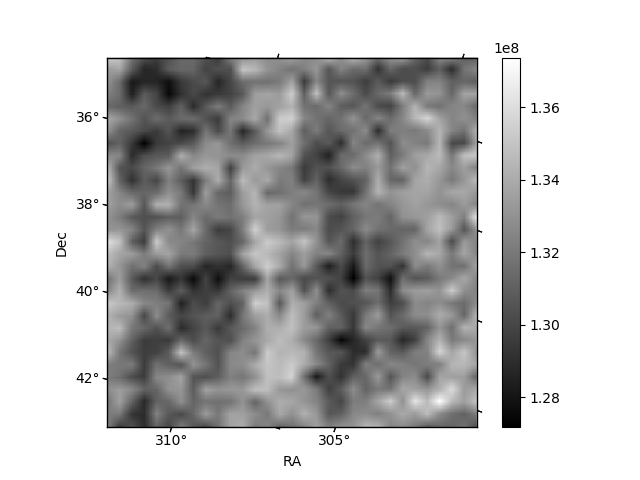
Histogram calculated using DETX and DETY for each event in the final _common_clean file
| Quadrant A | 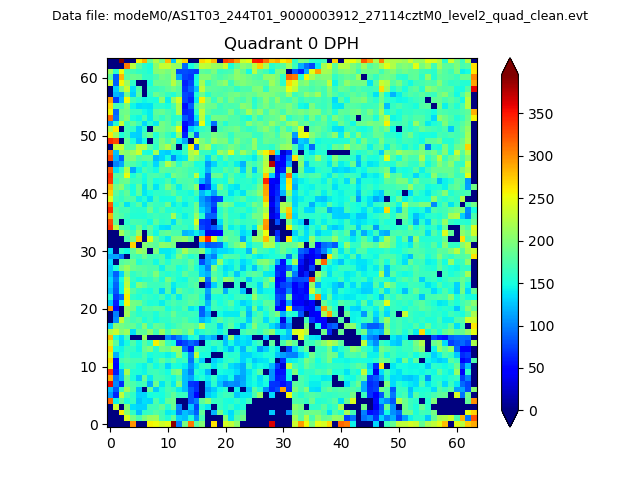 |
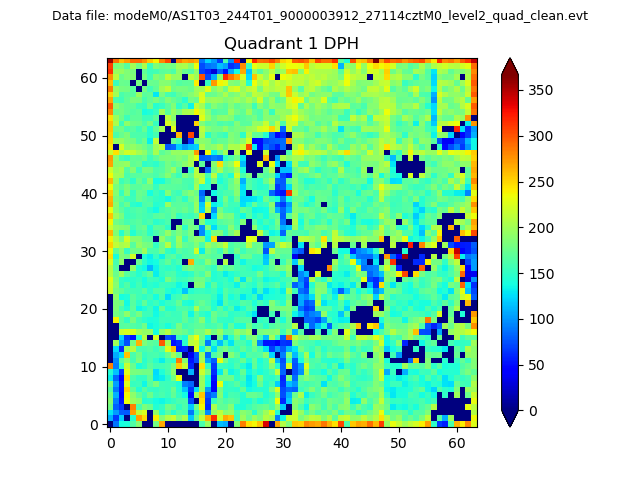 |
Quadrant B |
|---|---|---|---|
| Quadrant D | 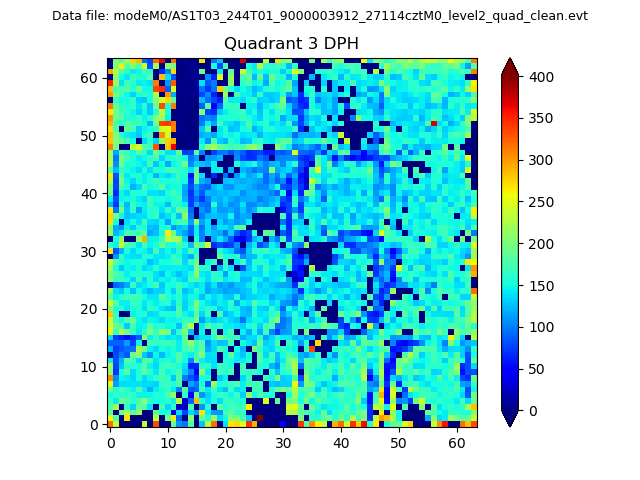 |
 |
Quadrant C |
| Plot type | Count rate plots | Images |
|---|---|---|
| Comparison with Poisson distribution Blue bars denote a histogram of data divided into 1 sec bins. Red curve is a Poisson curve with rate = median count rate of data. |
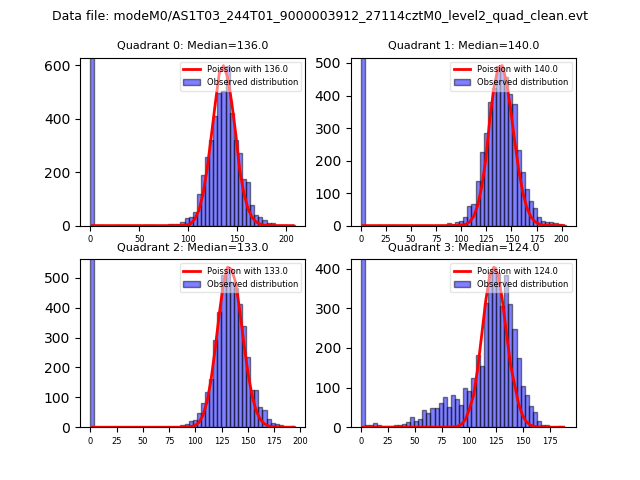 |
 |
| Quadrant-wise count rates Data is divided into 100 sec bins |
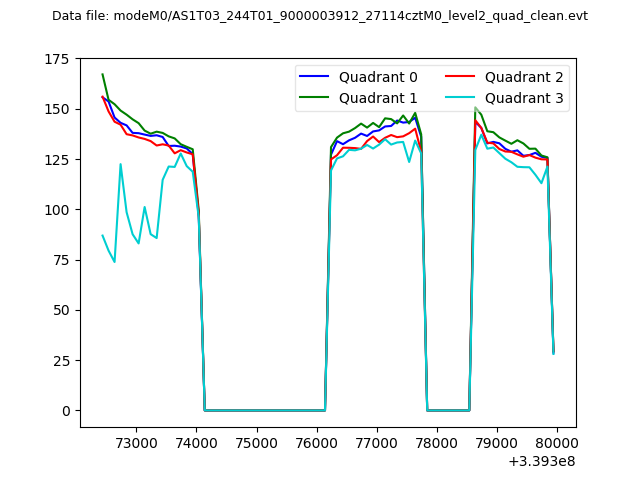 |
|
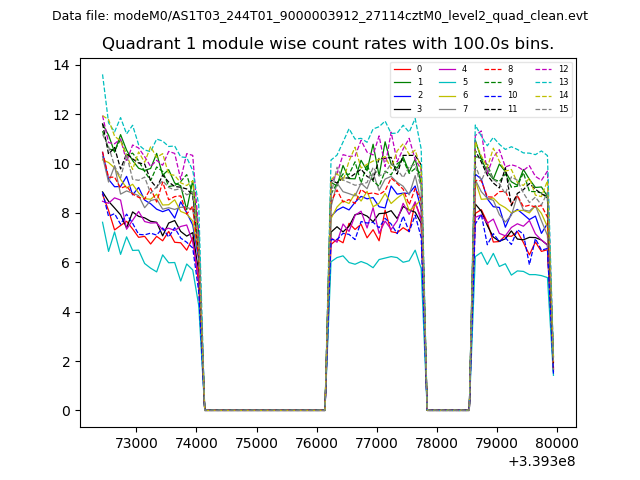
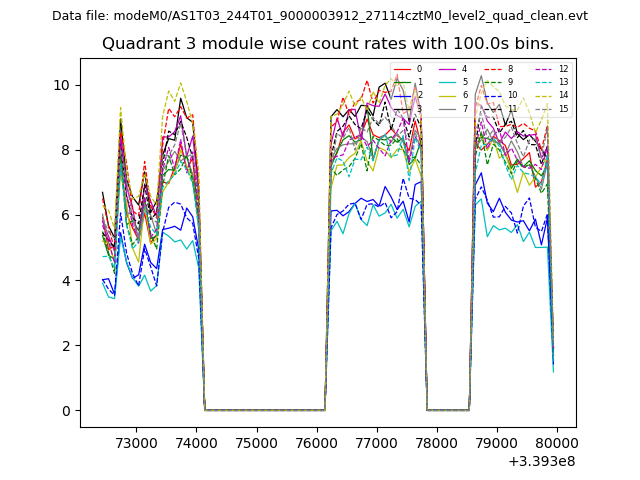
| Module-wise count rates for Quadrant A Data is divided into 100 sec bins |
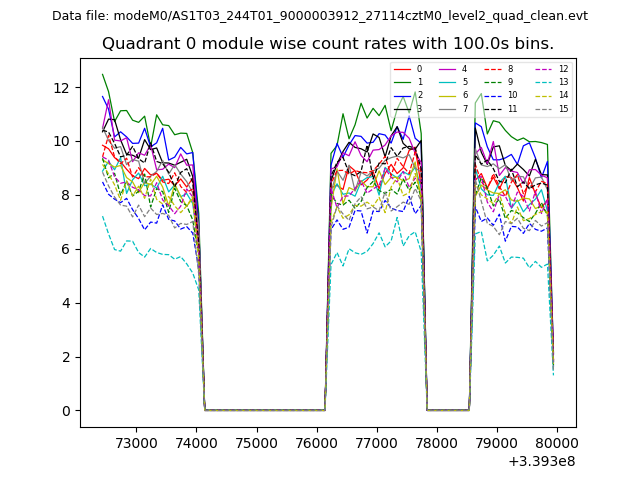 |
 |
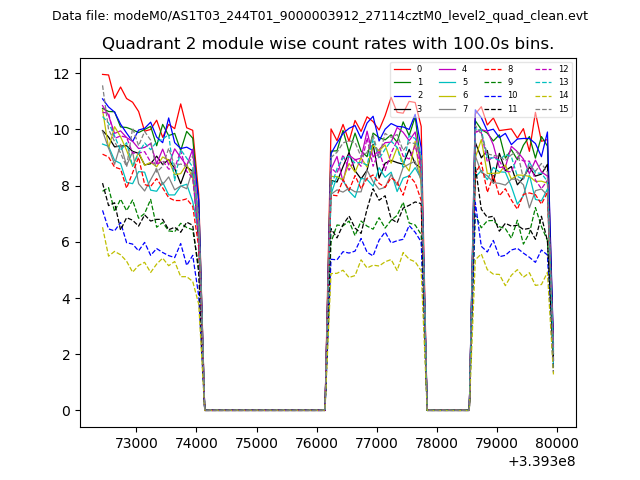
| Module-wise count rates for Quadrant B Data is divided into 100 sec bins |
 |
 |
| Module-wise count rates for Quadrant C Data is divided into 100 sec bins |
 |
 |
| Module-wise count rates for Quadrant D Data is divided into 100 sec bins |
 |
 |
| Parameter | Plot |
|---|---|
| CZT HV Monitor | 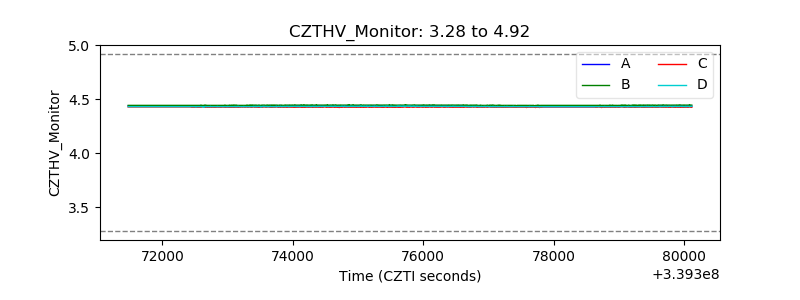 |
| D_VDD | 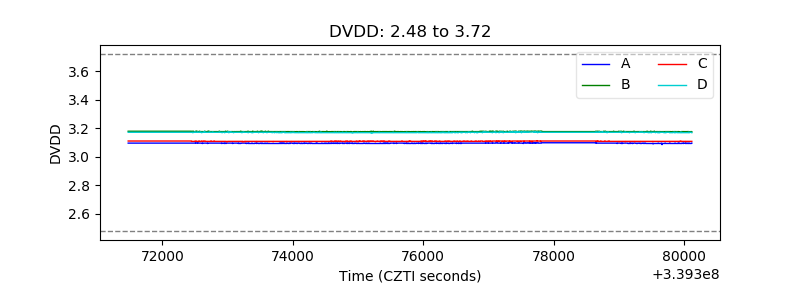 |
| Temperature 1 | 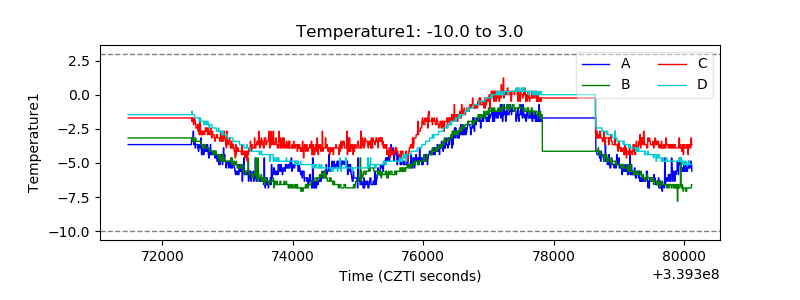 |
| Veto HV Monitor | 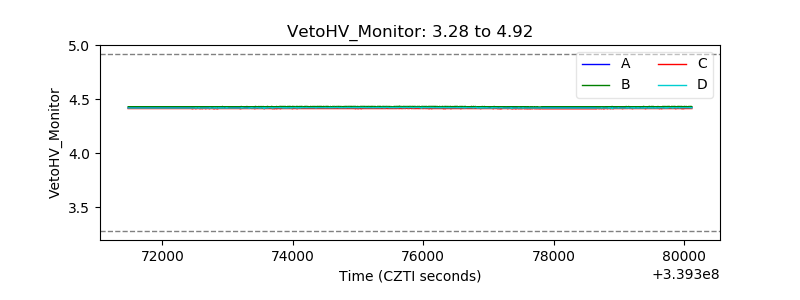 |
| Veto LLD | 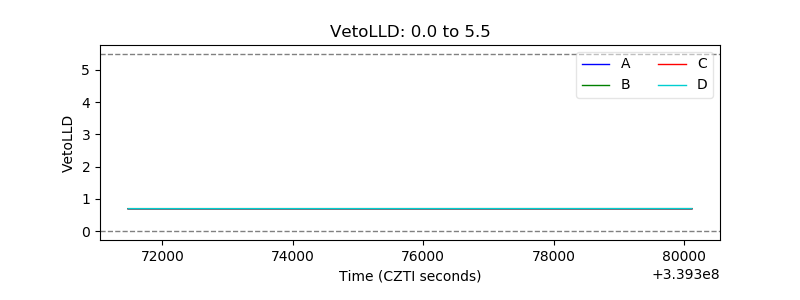 |
| Alpha Counter | 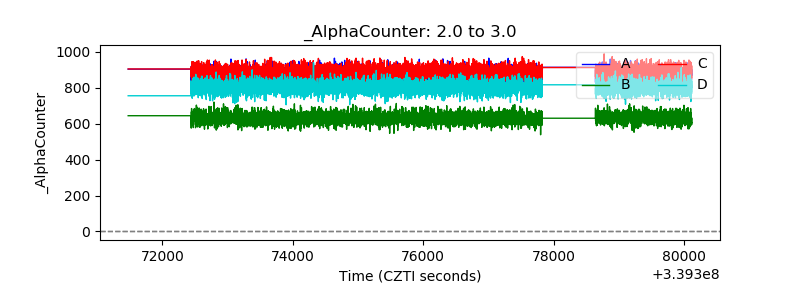 |
| _CPM_Rate | 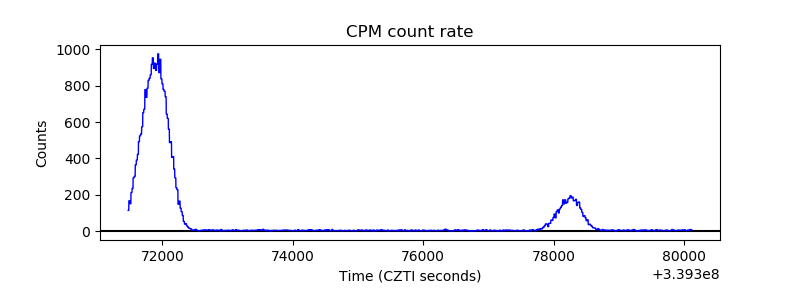 |
| CZT Counter | 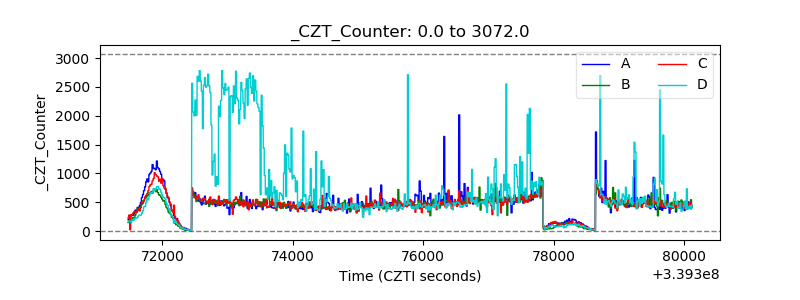 |
| +2.5 Volts monitor |  |
| +5 Volts monitor |  |
| _ROLL_ROT | 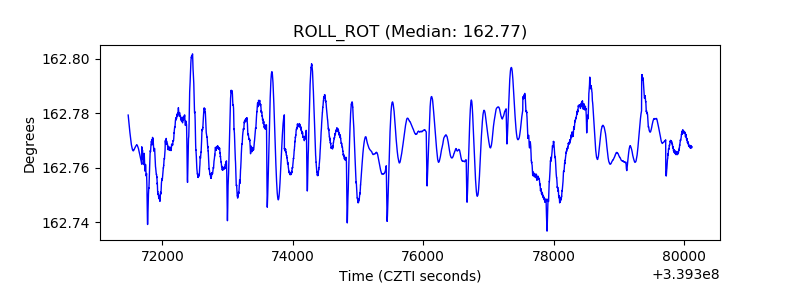 |
| _Roll_DEC | 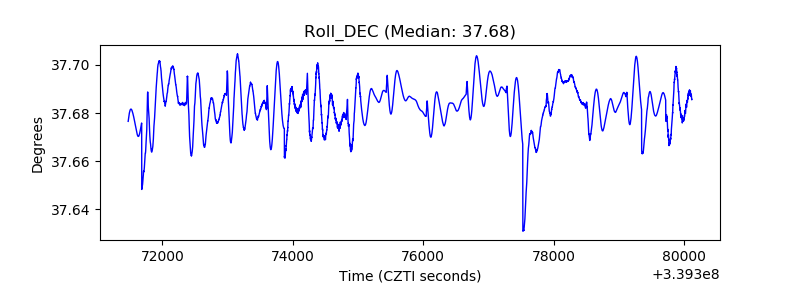 |
| _Roll_RA | 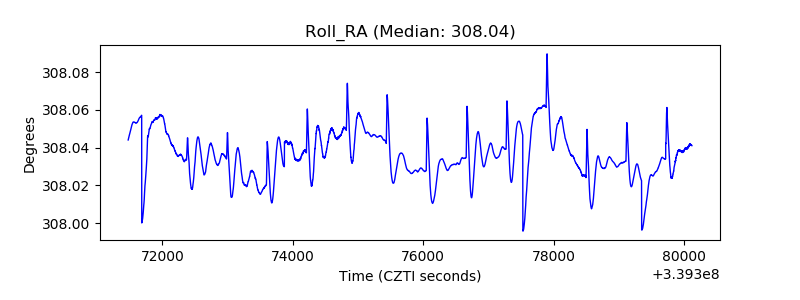 |
| Veto Counter | 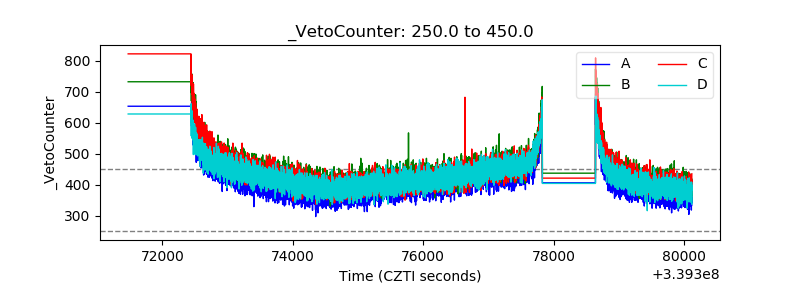 |