| Param | Original file | Final file |
|---|---|---|
| Filename | modeM0/AS1T03_244T01_9000003912_27116cztM0_level2.evt | modeM0/AS1T03_244T01_9000003912_27116cztM0_level2_quad_clean.evt |
| Size (bytes) | 623,260,800 | 106,303,680 |
| Size | 594.4 MB | 101.4 MB |
| Events in quadrant A | 4,311,250 | 672,425 |
| Events in quadrant B | 4,329,813 | 684,260 |
| Events in quadrant C | 4,032,729 | 657,002 |
| Events in quadrant D | 5,649,311 | 639,265 |
| Mode M9 | |||
|---|---|---|---|
| Quadrant | BADHDUFLAG | Total packets | Discarded packets |
| A | 0 | 5 | 0 |
| B | 0 | 5 | 0 |
| C | 0 | 5 | 0 |
| D | 0 | 5 | 0 |
| Mode M0 | |||
|---|---|---|---|
| Quadrant | BADHDUFLAG | Total packets | Discarded packets |
| A | 0 | 18032 | 0 |
| B | 0 | 17980 | 0 |
| C | 0 | 17125 | 0 |
| D | 0 | 22409 | 0 |
| Quadrant | Total seconds | Saturated seconds | Saturation percentage |
|---|---|---|---|
| A | 8142 | 240 | 2.947679% |
| B | 8143 | 253 | 3.106963% |
| C | 8143 | 239 | 2.935036% |
| D | 8143 | 575 | 7.061280% |
Noise dominated data is calculated using 1-second bins in cleaned event files. If a bin has >2000 counts, and if more than 50% of those come from <1% of pixels, then it is considered to be noise-dominated and hence unusable.
| Quadrant | # 1 sec bins | Bins with >0 counts | Bins with >2000 counts | High rate bins dominated by noise | Noise dominated (total time) | Noise dominated (detector-on time) | Marked lightcurve |
|---|---|---|---|---|---|---|---|
| A | 8707 | 8144 | 55 | 55 | 0.63% | 0.68% | 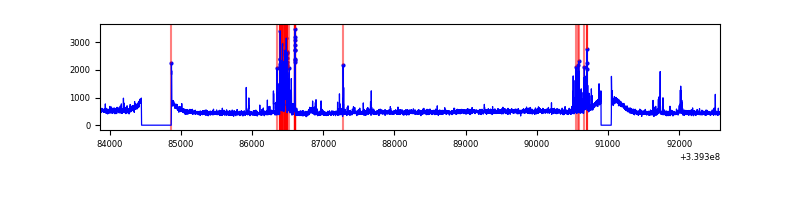 |
| B | 8708 | 8145 | 3 | 3 | 0.03% | 0.04% | 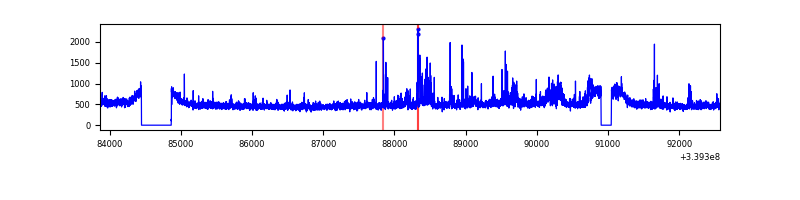 |
| C | 8708 | 8145 | 5 | 5 | 0.06% | 0.06% | 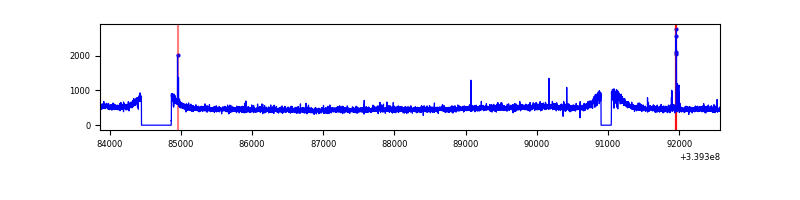 |
| D | 8708 | 8145 | 430 | 430 | 4.94% | 5.28% | 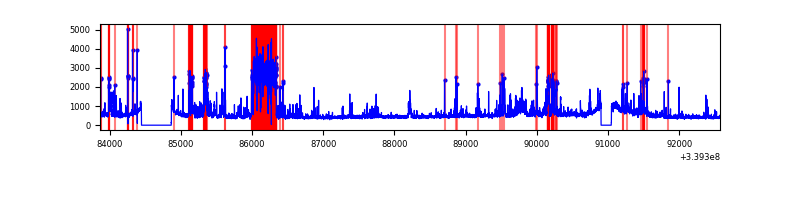 |
Top three noisy pixels from each quadrant. If the there are fewer than three noisy pixels in the level2.evt file, extra rows are filled as -1
| Pixel properties | Quadrant properties | ||||||
|---|---|---|---|---|---|---|---|
| Quadrant | DetID | PixID | Counts | Sigma | Mean | Median | Sigma |
| A | 14 | 235 | 396806 | 1948.71 | 1007 | 980 | 203.1 |
| A | 8 | 192 | 13812 | 63.17 | 1007 | 980 | 203.1 |
| A | 13 | 254 | 12381 | 56.13 | 1007 | 980 | 203.1 |
| B | 10 | 246 | 104457 | 532.19 | 1009 | 982 | 194.4 |
| B | 0 | 189 | 93536 | 476.02 | 1009 | 982 | 194.4 |
| B | 3 | 112 | 83536 | 424.59 | 1009 | 982 | 194.4 |
| C | 14 | 238 | 156319 | 667.02 | 983 | 987 | 232.9 |
| C | 15 | 208 | 40899 | 171.39 | 983 | 987 | 232.9 |
| C | 13 | 61 | 6739 | 24.7 | 983 | 987 | 232.9 |
| D | 1 | 52 | 1275960 | 5139.48 | 948 | 926 | 248.1 |
| D | 7 | 38 | 563451 | 2267.46 | 948 | 926 | 248.1 |
| D | 2 | 250 | 145081 | 581.07 | 948 | 926 | 248.1 |
Histogram calculated using DETX and DETY for each event in the final _common_clean file
| Quadrant A | 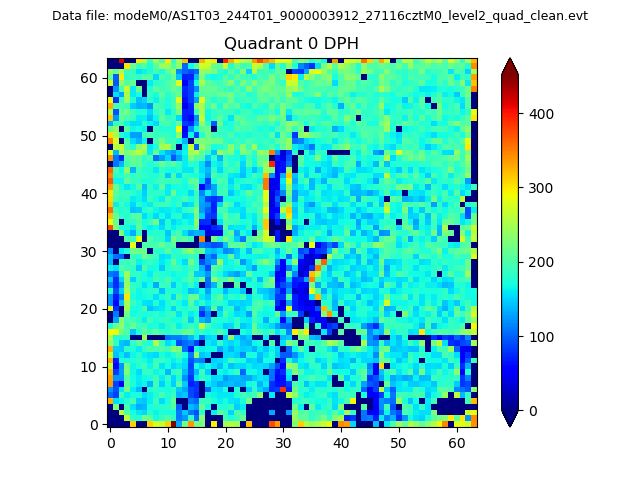 |
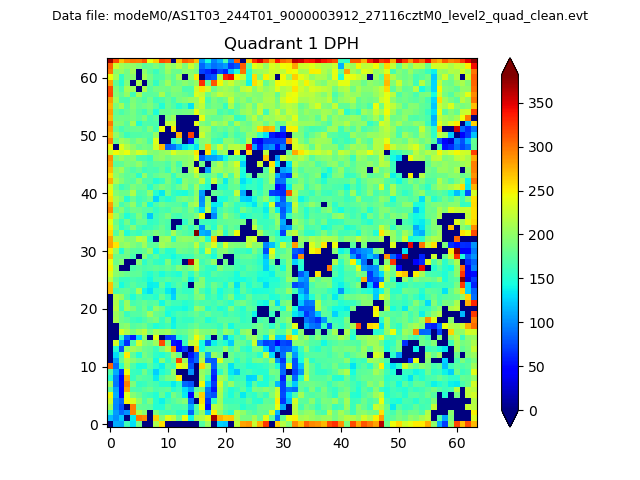 |
Quadrant B |
|---|---|---|---|
| Quadrant D | 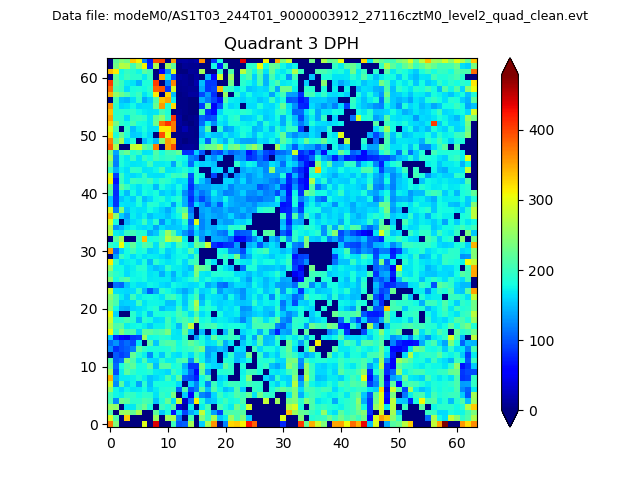 |
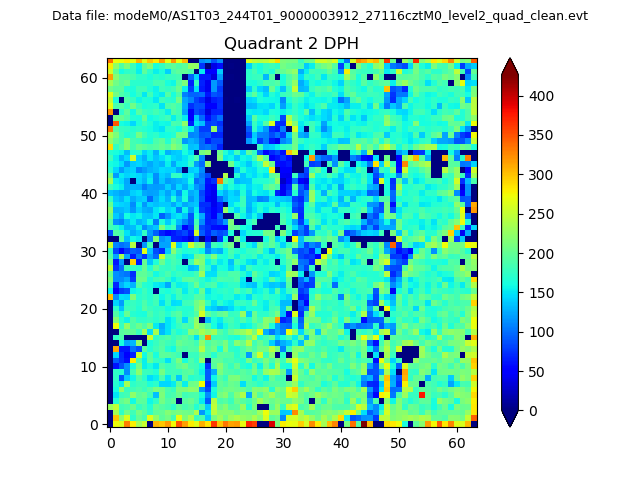 |
Quadrant C |
| Plot type | Count rate plots | Images |
|---|---|---|
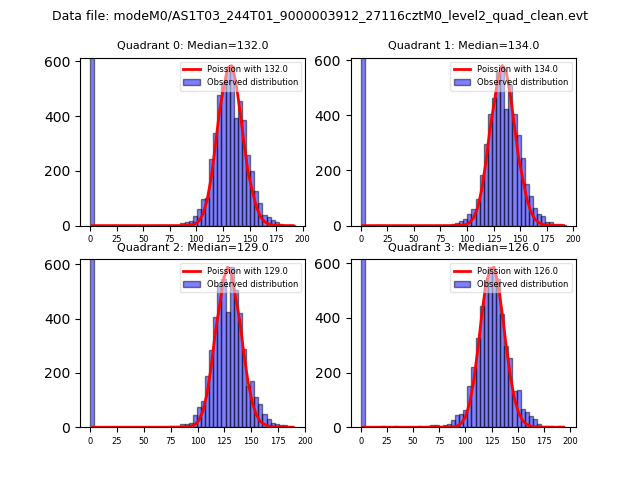
| Comparison with Poisson distribution Blue bars denote a histogram of data divided into 1 sec bins. Red curve is a Poisson curve with rate = median count rate of data. |
 |
 |
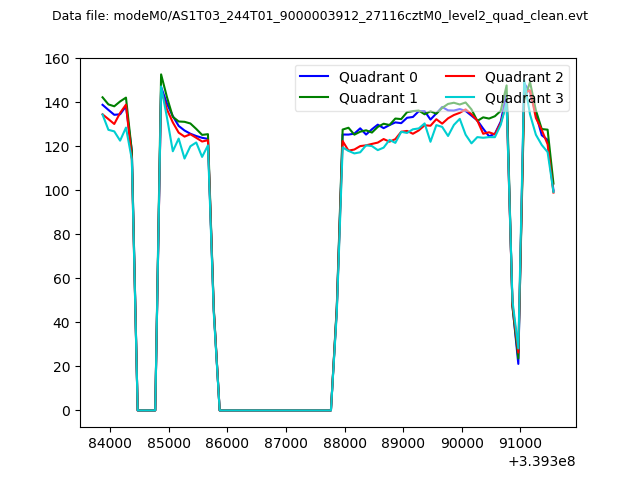
| Quadrant-wise count rates Data is divided into 100 sec bins |
 |
|
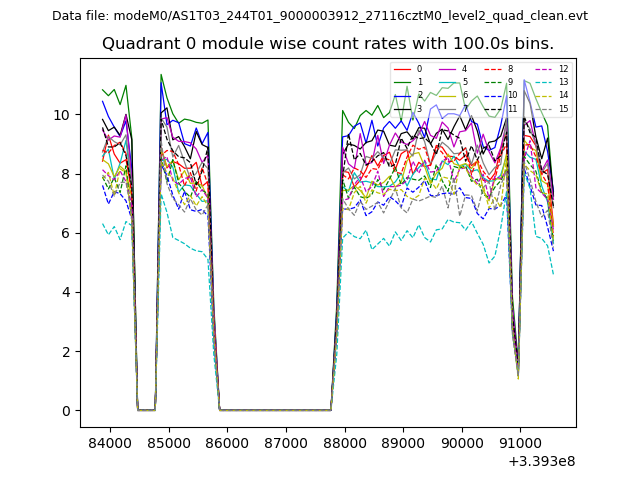
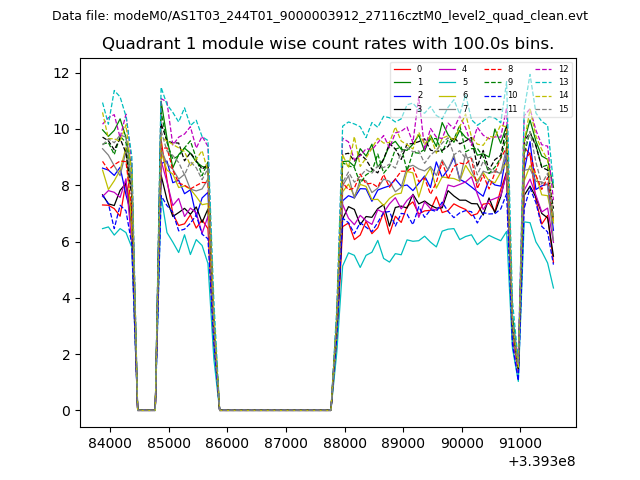
| Module-wise count rates for Quadrant A Data is divided into 100 sec bins |
 |
 |
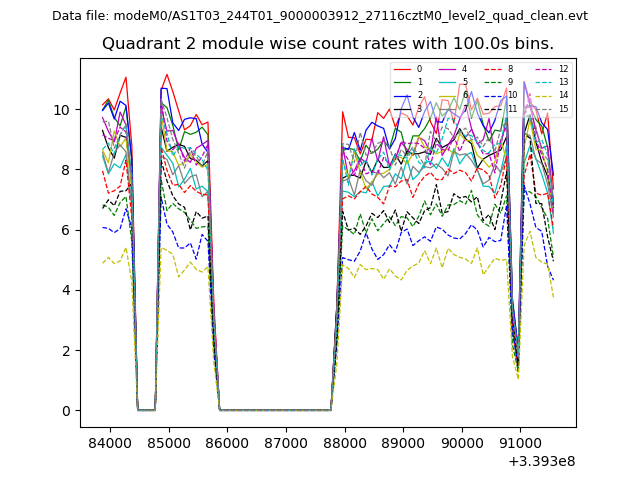
| Module-wise count rates for Quadrant B Data is divided into 100 sec bins |
 |
 |
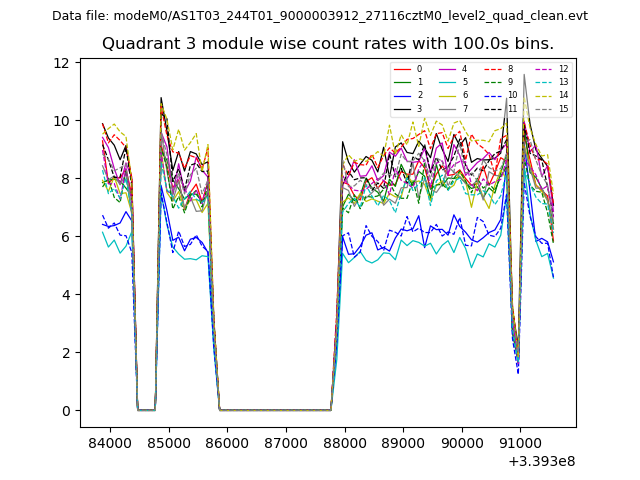
| Module-wise count rates for Quadrant C Data is divided into 100 sec bins |
 |
 |
| Module-wise count rates for Quadrant D Data is divided into 100 sec bins |
 |
 |
| Parameter | Plot |
|---|---|
| CZT HV Monitor | 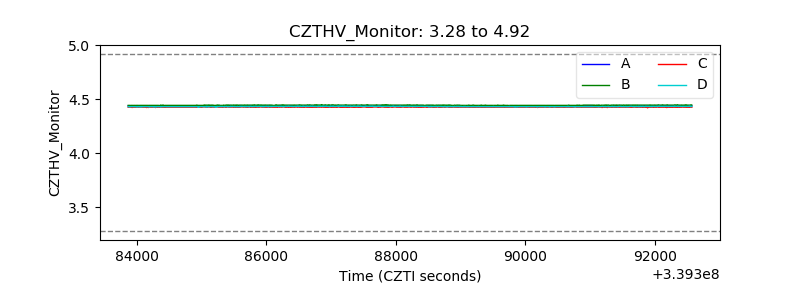 |
| D_VDD | 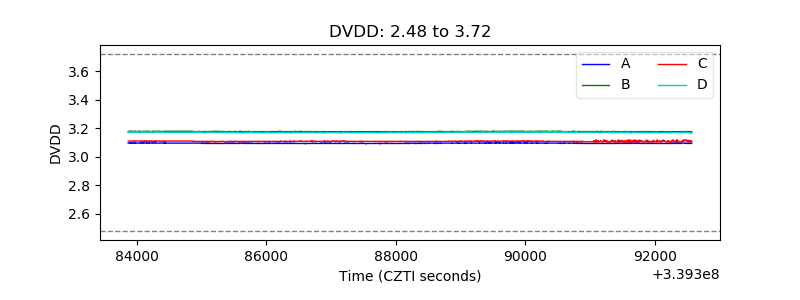 |
| Temperature 1 | 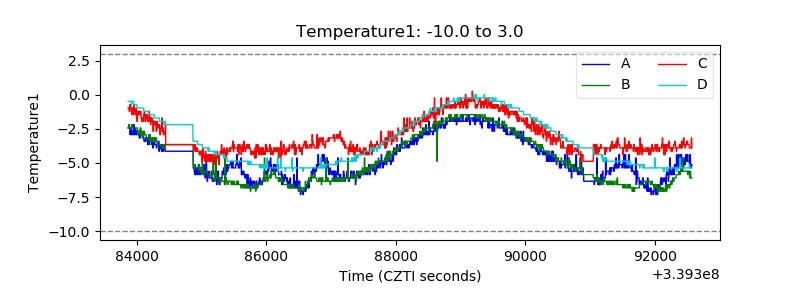 |
| Veto HV Monitor | 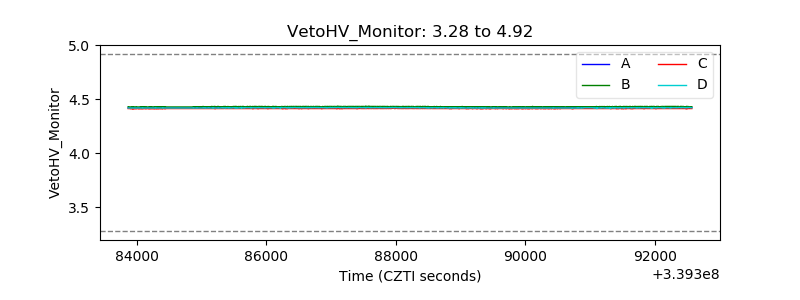 |
| Veto LLD | 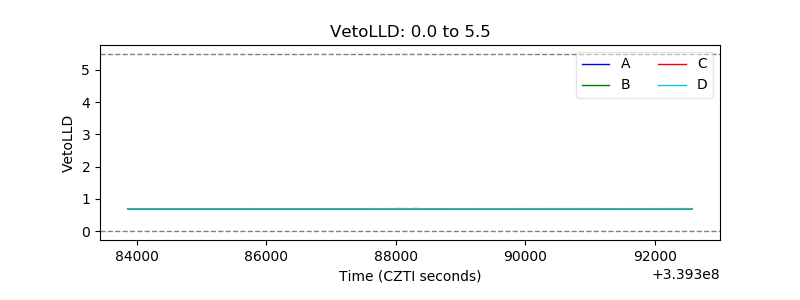 |
| Alpha Counter | 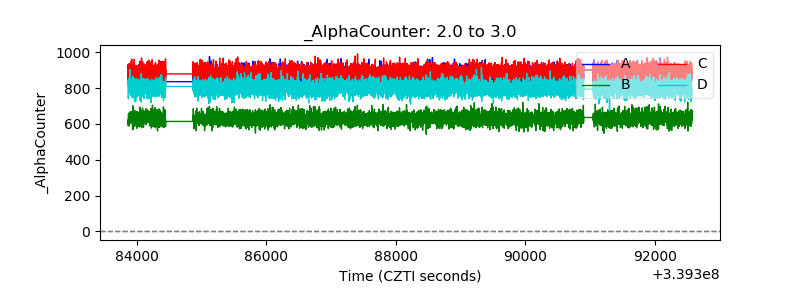 |
| _CPM_Rate | 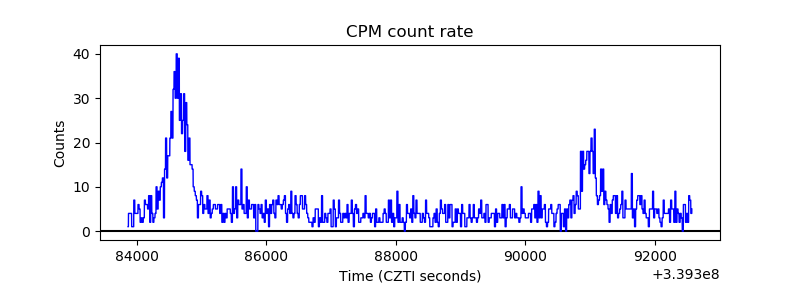 |
| CZT Counter | 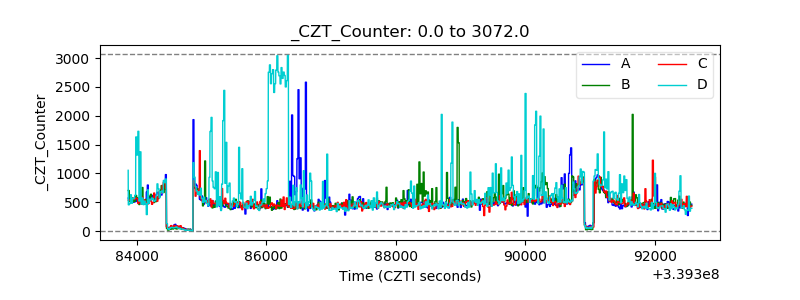 |
| +2.5 Volts monitor |  |
| +5 Volts monitor | 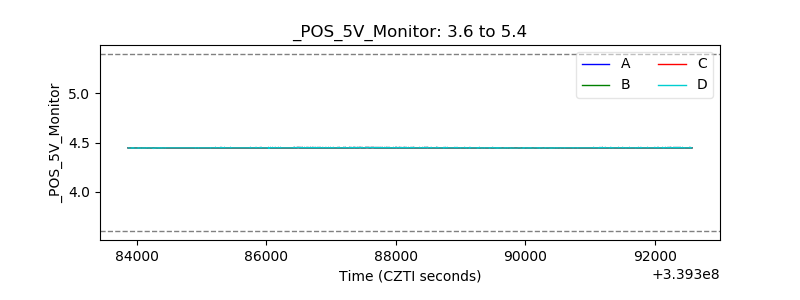 |
| _ROLL_ROT | 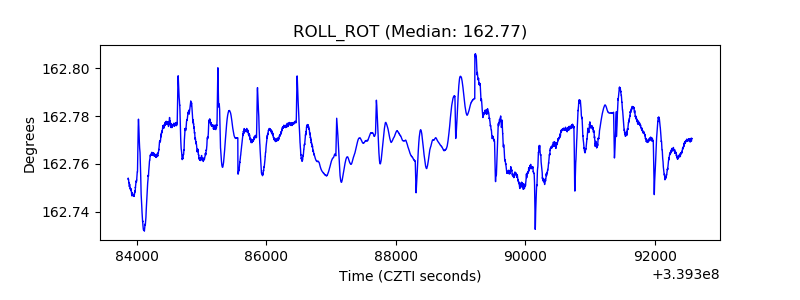 |
| _Roll_DEC | 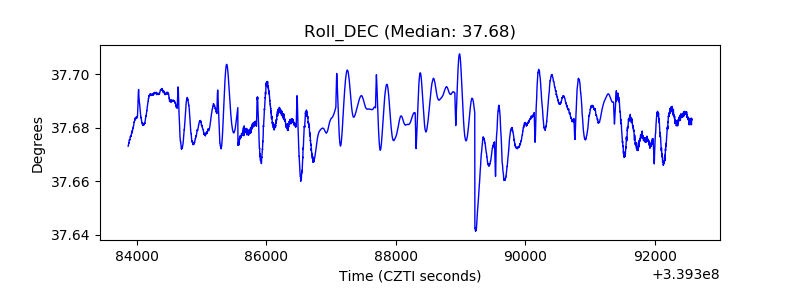 |
| _Roll_RA |  |
| Veto Counter | 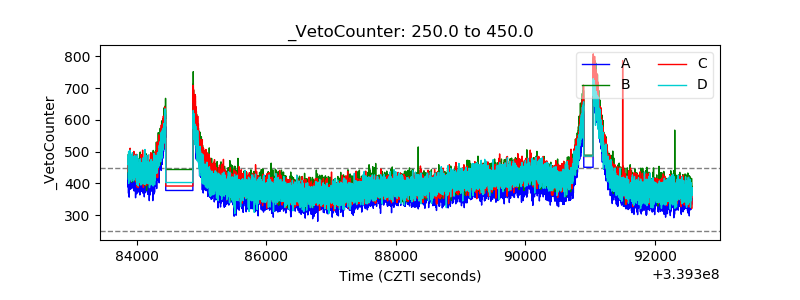 |