| Param | Original file | Final file |
|---|---|---|
| Filename | modeM0/AS1T03_244T01_9000003912_27117cztM0_level2.evt | modeM0/AS1T03_244T01_9000003912_27117cztM0_level2_quad_clean.evt |
| Size (bytes) | 598,809,600 | 84,219,840 |
| Size | 571.1 MB | 80.3 MB |
| Events in quadrant A | 4,000,984 | 512,227 |
| Events in quadrant B | 5,230,666 | 505,012 |
| Events in quadrant C | 3,807,226 | 503,723 |
| Events in quadrant D | 4,567,919 | 487,256 |
| Mode M9 | |||
|---|---|---|---|
| Quadrant | BADHDUFLAG | Total packets | Discarded packets |
| A | 0 | 4 | 0 |
| B | 0 | 4 | 0 |
| C | 0 | 4 | 0 |
| D | 0 | 4 | 0 |
| Mode M0 | |||
|---|---|---|---|
| Quadrant | BADHDUFLAG | Total packets | Discarded packets |
| A | 0 | 17006 | 0 |
| B | 0 | 20513 | 0 |
| C | 0 | 16230 | 0 |
| D | 0 | 19044 | 0 |
| Quadrant | Total seconds | Saturated seconds | Saturation percentage |
|---|---|---|---|
| A | 7788 | 211 | 2.709296% |
| B | 7787 | 646 | 8.295878% |
| C | 7787 | 215 | 2.761012% |
| D | 7787 | 257 | 3.300372% |
Noise dominated data is calculated using 1-second bins in cleaned event files. If a bin has >2000 counts, and if more than 50% of those come from <1% of pixels, then it is considered to be noise-dominated and hence unusable.
| Quadrant | # 1 sec bins | Bins with >0 counts | Bins with >2000 counts | High rate bins dominated by noise | Noise dominated (total time) | Noise dominated (detector-on time) | Marked lightcurve |
|---|---|---|---|---|---|---|---|
| A | 8293 | 7790 | 17 | 17 | 0.20% | 0.22% | 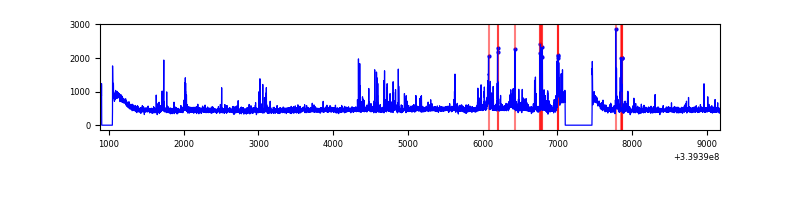 |
| B | 8292 | 7789 | 282 | 282 | 3.40% | 3.62% | 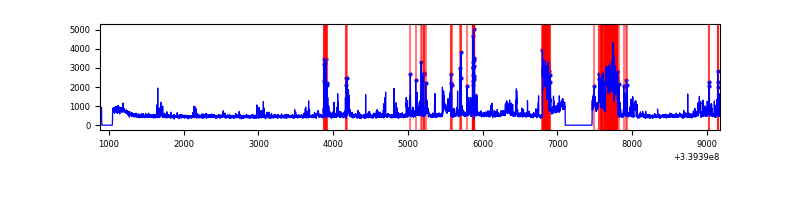 |
| C | 8292 | 7789 | 5 | 5 | 0.06% | 0.06% | 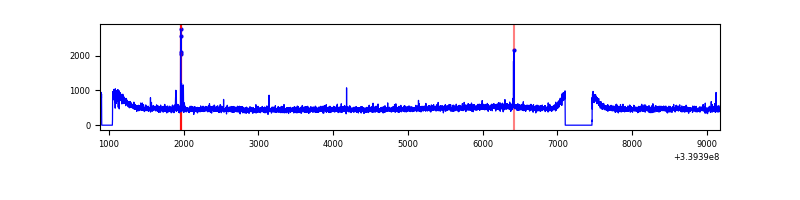 |
| D | 8292 | 7789 | 121 | 121 | 1.46% | 1.55% | 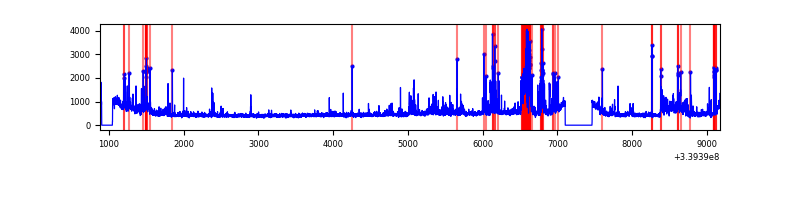 |
Top three noisy pixels from each quadrant. If the there are fewer than three noisy pixels in the level2.evt file, extra rows are filled as -1
| Pixel properties | Quadrant properties | ||||||
|---|---|---|---|---|---|---|---|
| Quadrant | DetID | PixID | Counts | Sigma | Mean | Median | Sigma |
| A | 14 | 235 | 292181 | 1504.69 | 950 | 925 | 193.6 |
| A | 11 | 29 | 25723 | 128.11 | 950 | 925 | 193.6 |
| A | 8 | 192 | 13216 | 63.5 | 950 | 925 | 193.6 |
| B | 10 | 245 | 1253549 | 6942.37 | 925 | 899 | 180.4 |
| B | 0 | 189 | 195459 | 1078.28 | 925 | 899 | 180.4 |
| B | 3 | 112 | 72683 | 397.84 | 925 | 899 | 180.4 |
| C | 14 | 238 | 147512 | 668.5 | 924 | 929 | 219.3 |
| C | 15 | 208 | 39397 | 175.44 | 924 | 929 | 219.3 |
| C | 8 | 128 | 12793 | 54.11 | 924 | 929 | 219.3 |
| D | 1 | 52 | 435047 | 1868.63 | 916 | 891 | 232.3 |
| D | 7 | 38 | 363898 | 1562.4 | 916 | 891 | 232.3 |
| D | 2 | 250 | 236751 | 1015.15 | 916 | 891 | 232.3 |
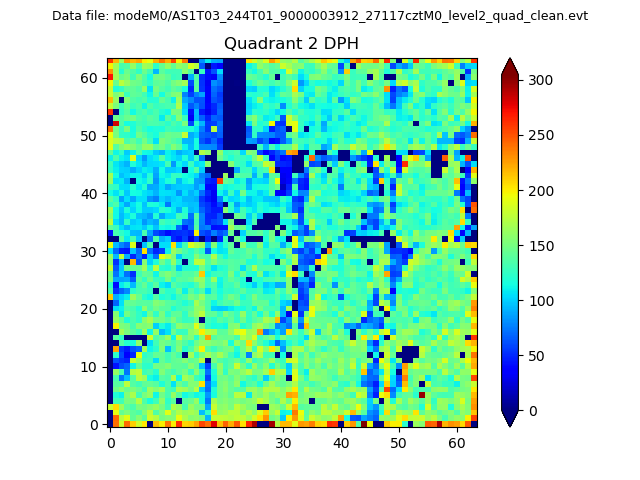
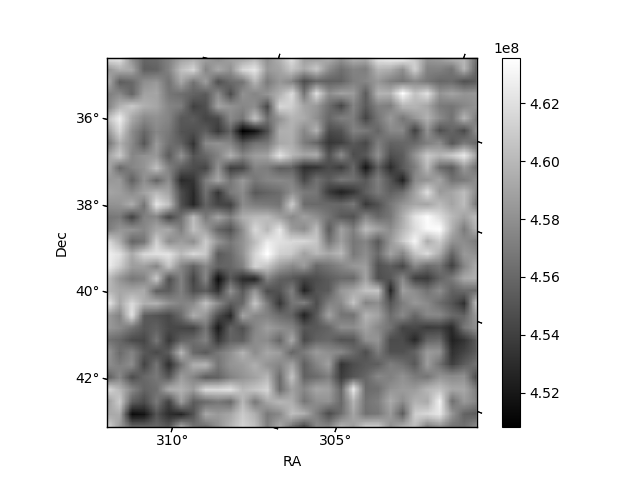
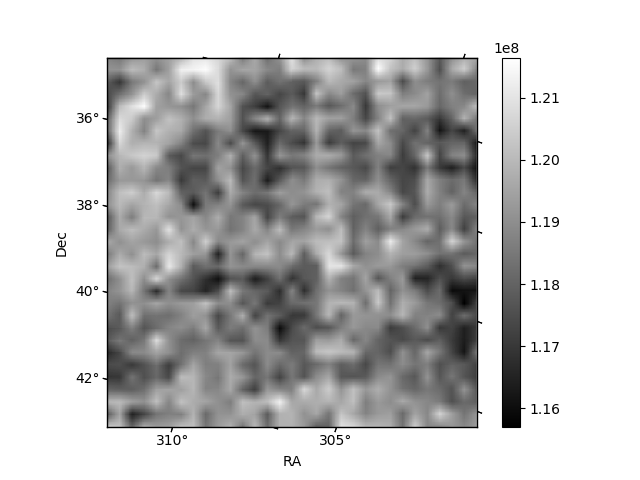
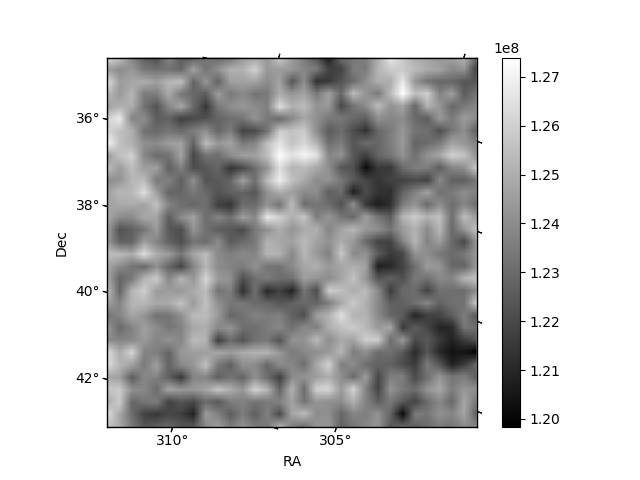
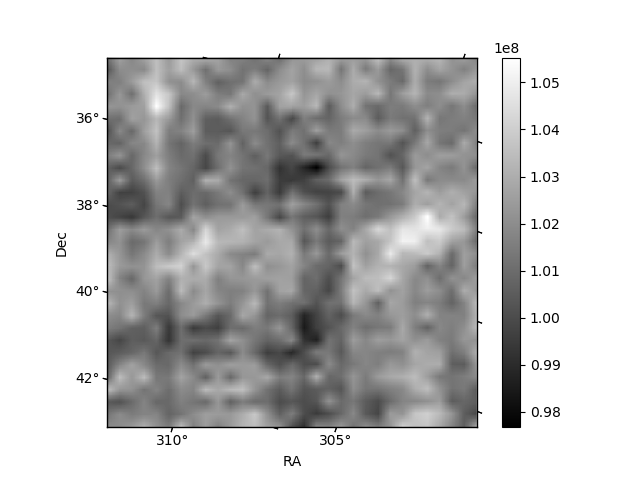
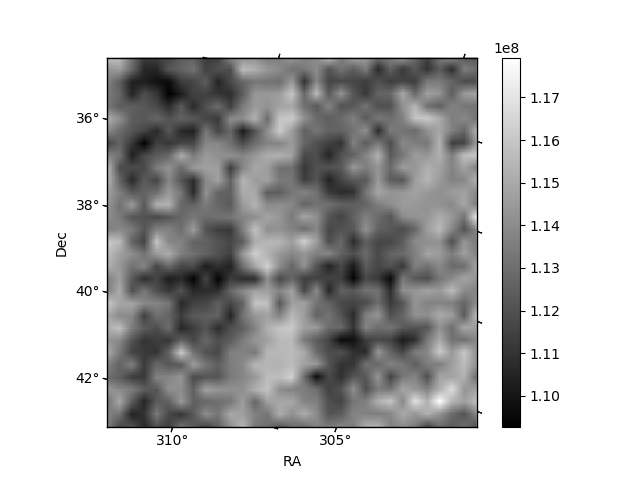
Histogram calculated using DETX and DETY for each event in the final _common_clean file
| Quadrant A | 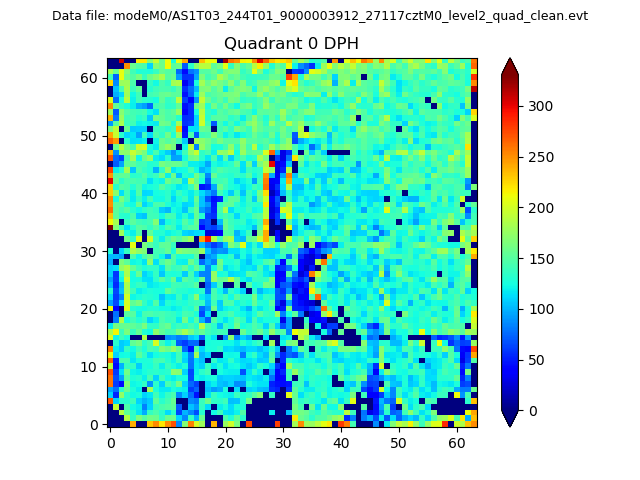 |
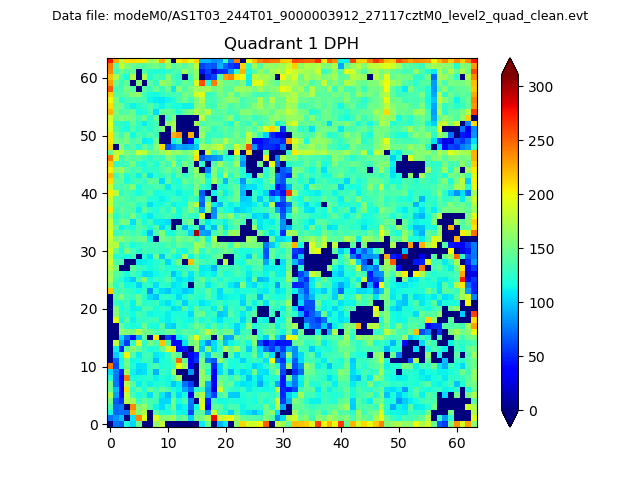 |
Quadrant B |
|---|---|---|---|
| Quadrant D | 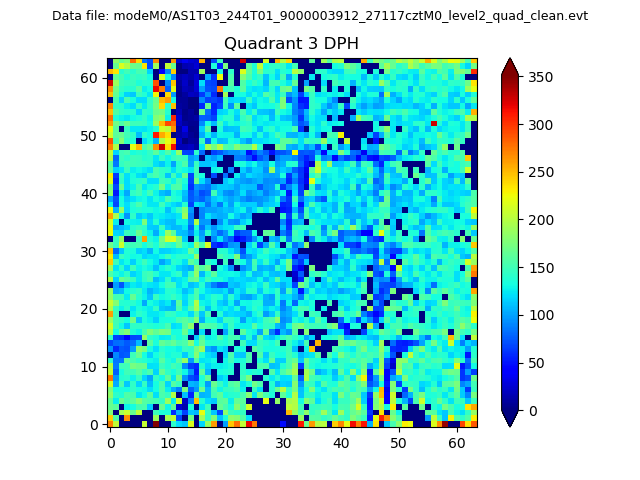 |
 |
Quadrant C |
| Plot type | Count rate plots | Images |
|---|---|---|
| Comparison with Poisson distribution Blue bars denote a histogram of data divided into 1 sec bins. Red curve is a Poisson curve with rate = median count rate of data. |
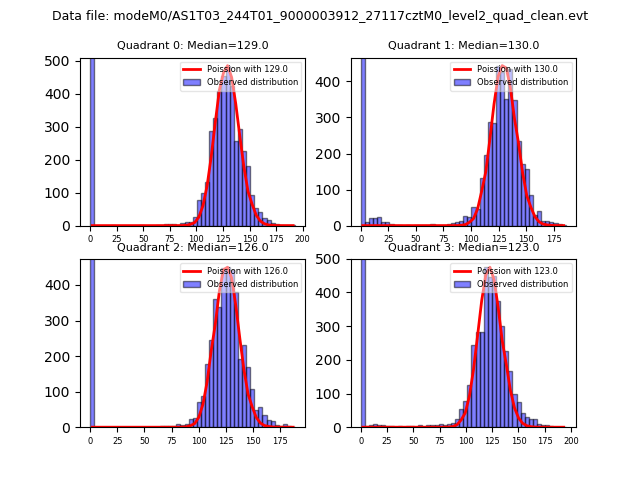 |
 |
| Quadrant-wise count rates Data is divided into 100 sec bins |
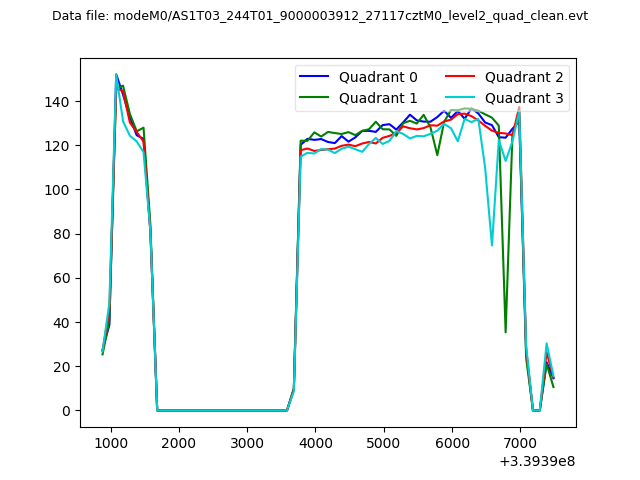 |
|
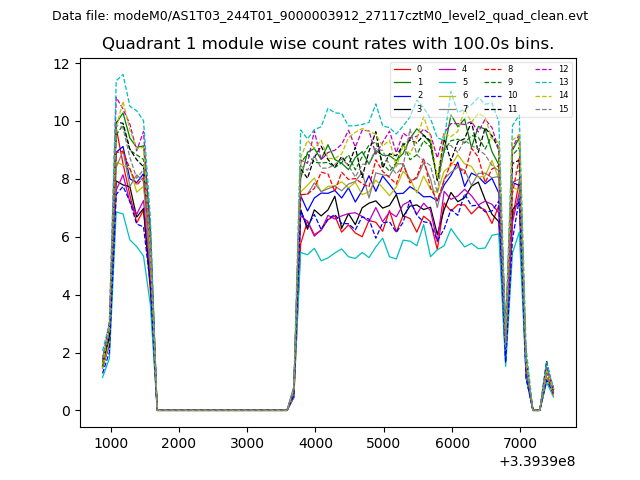
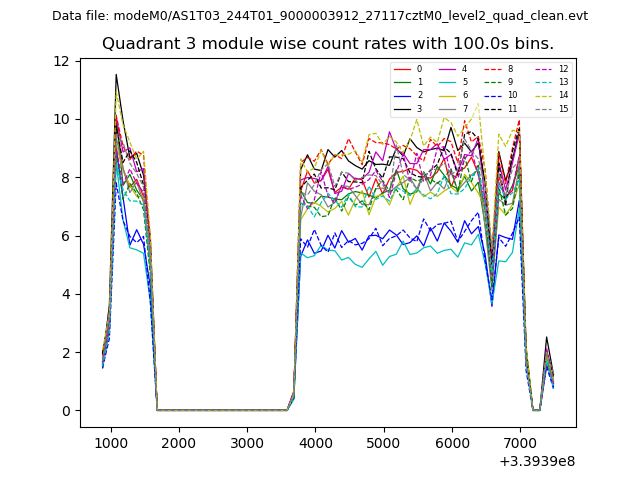
| Module-wise count rates for Quadrant A Data is divided into 100 sec bins |
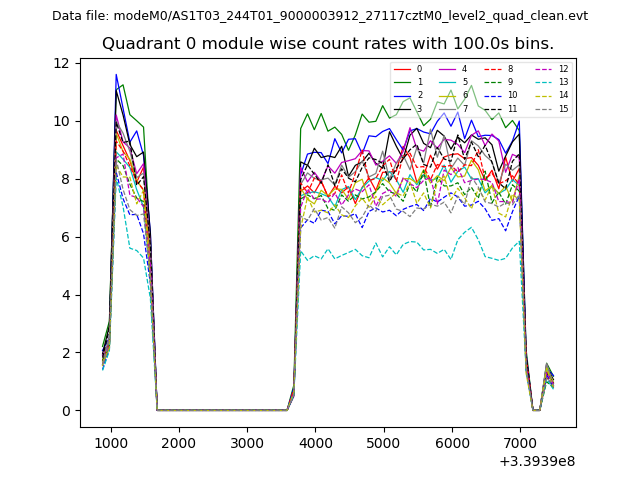 |
 |
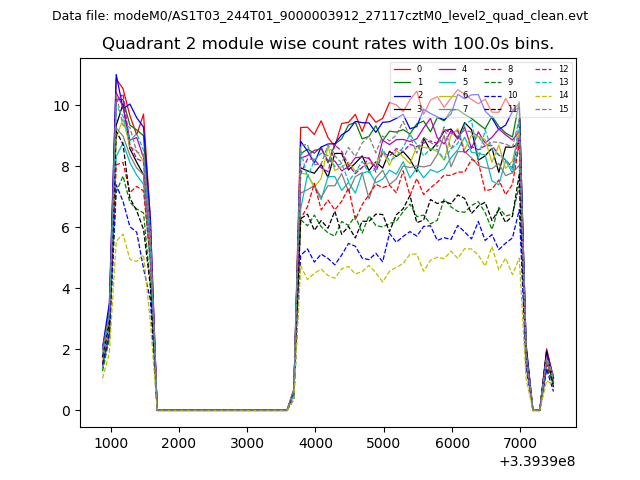
| Module-wise count rates for Quadrant B Data is divided into 100 sec bins |
 |
 |
| Module-wise count rates for Quadrant C Data is divided into 100 sec bins |
 |
 |
| Module-wise count rates for Quadrant D Data is divided into 100 sec bins |
 |
 |
| Parameter | Plot |
|---|---|
| CZT HV Monitor | 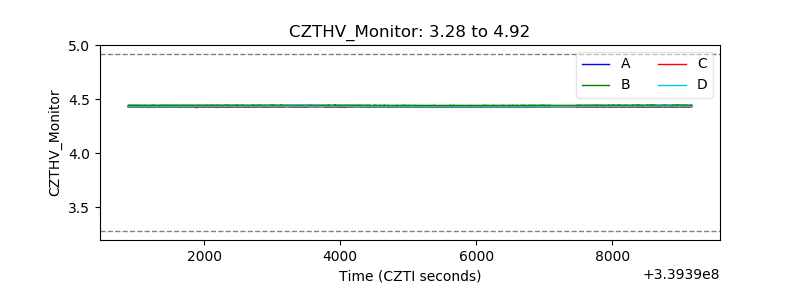 |
| D_VDD | 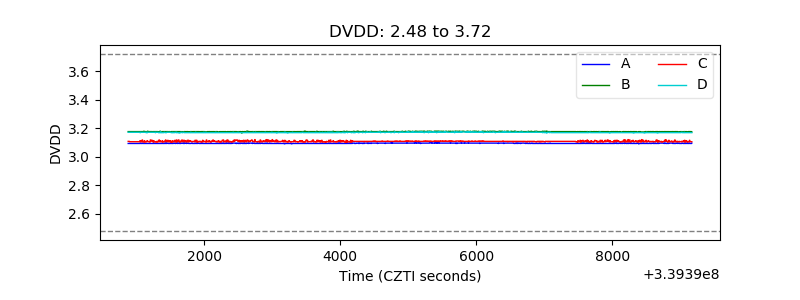 |
| Temperature 1 | 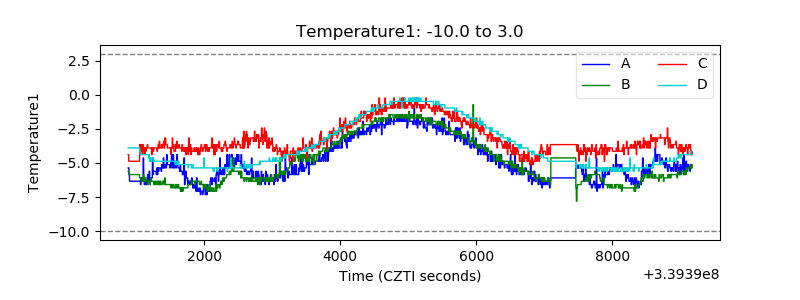 |
| Veto HV Monitor | 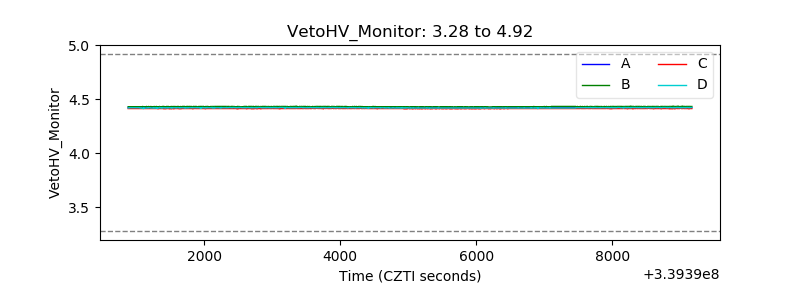 |
| Veto LLD | 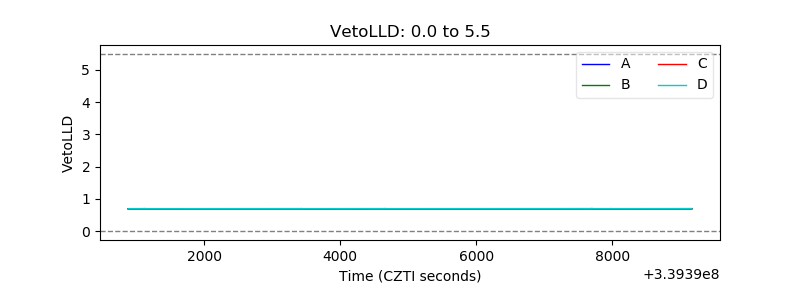 |
| Alpha Counter | 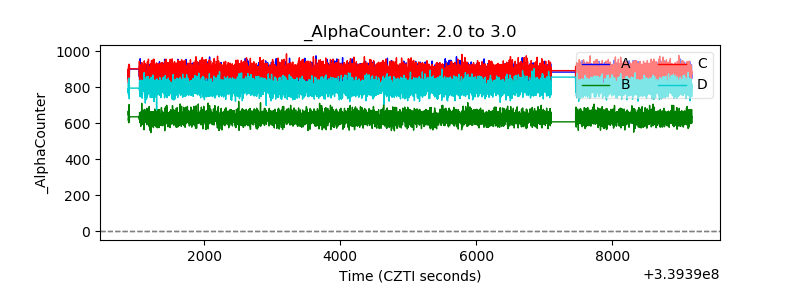 |
| _CPM_Rate | 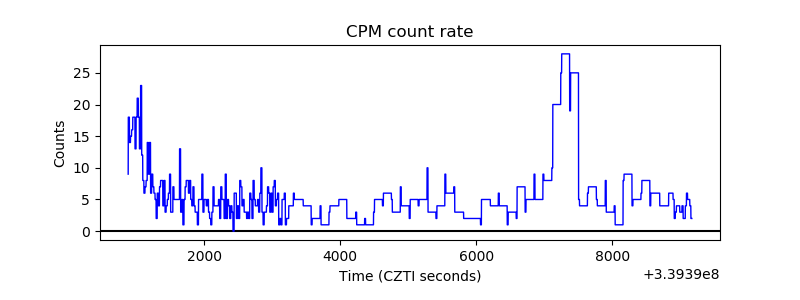 |
| CZT Counter | 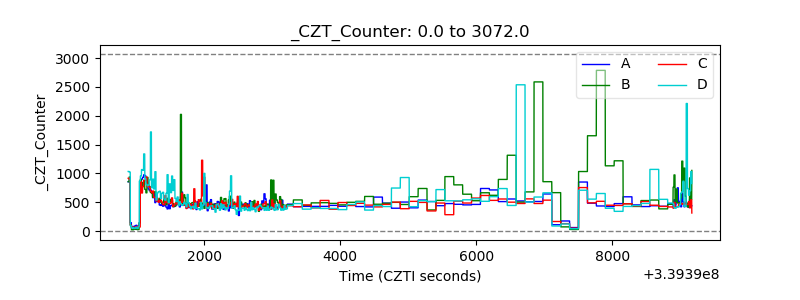 |
| +2.5 Volts monitor |  |
| +5 Volts monitor |  |
| _ROLL_ROT | 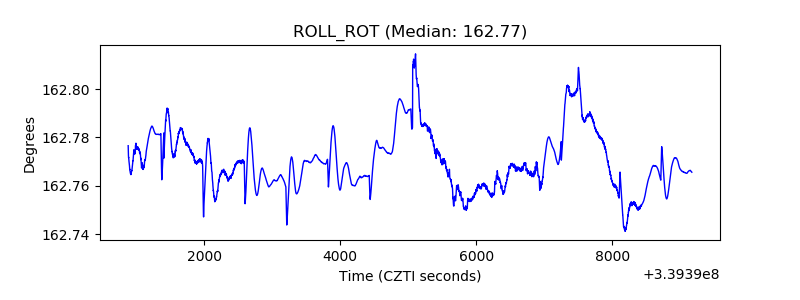 |
| _Roll_DEC | 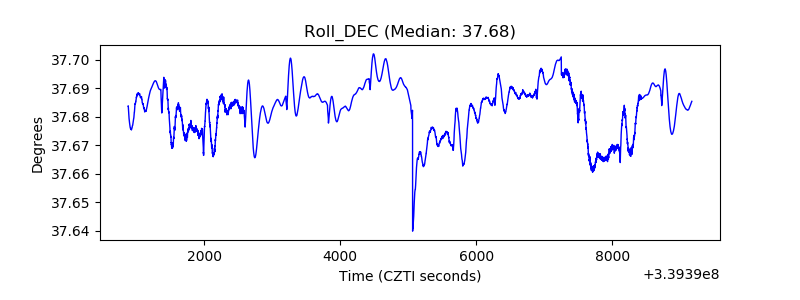 |
| _Roll_RA | 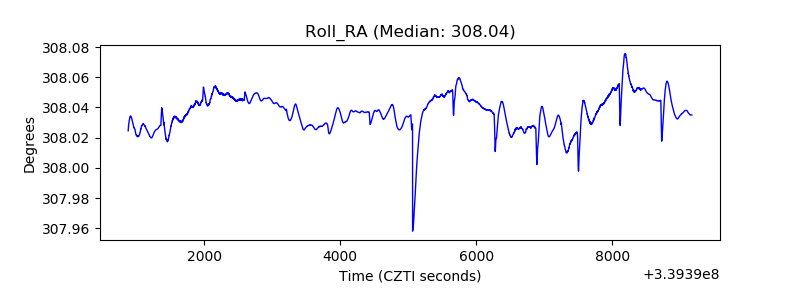 |
| Veto Counter | 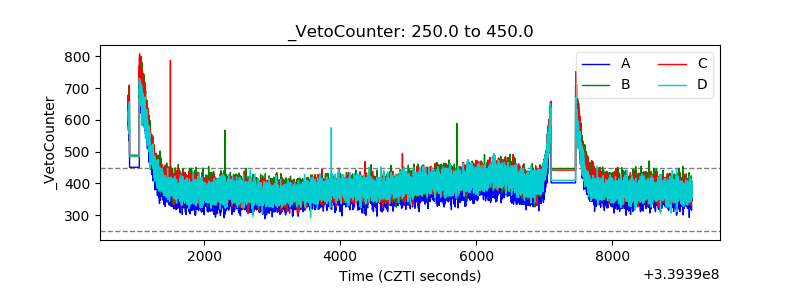 |