| Param | Original file | Final file |
|---|---|---|
| Filename | modeM0/AS1T03_244T01_9000003912_27120cztM0_level2.evt | modeM0/AS1T03_244T01_9000003912_27120cztM0_level2_quad_clean.evt |
| Size (bytes) | 550,463,040 | 88,159,680 |
| Size | 525.0 MB | 84.1 MB |
| Events in quadrant A | 3,591,530 | 565,661 |
| Events in quadrant B | 3,839,776 | 563,569 |
| Events in quadrant C | 3,398,742 | 550,755 |
| Events in quadrant D | 5,370,795 | 506,878 |
| Mode M9 | |||
|---|---|---|---|
| Quadrant | BADHDUFLAG | Total packets | Discarded packets |
| A | 0 | 10 | 0 |
| B | 0 | 11 | 0 |
| C | 0 | 11 | 0 |
| D | 0 | 11 | 0 |
| Mode M0 | |||
|---|---|---|---|
| Quadrant | BADHDUFLAG | Total packets | Discarded packets |
| A | 0 | 14984 | 0 |
| B | 0 | 15630 | 0 |
| C | 0 | 14352 | 0 |
| D | 0 | 20599 | 0 |
| Quadrant | Total seconds | Saturated seconds | Saturation percentage |
|---|---|---|---|
| A | 6930 | 104 | 1.500722% |
| B | 6930 | 217 | 3.131313% |
| C | 6930 | 115 | 1.659452% |
| D | 6930 | 559 | 8.066378% |
Noise dominated data is calculated using 1-second bins in cleaned event files. If a bin has >2000 counts, and if more than 50% of those come from <1% of pixels, then it is considered to be noise-dominated and hence unusable.
| Quadrant | # 1 sec bins | Bins with >0 counts | Bins with >2000 counts | High rate bins dominated by noise | Noise dominated (total time) | Noise dominated (detector-on time) | Marked lightcurve |
|---|---|---|---|---|---|---|---|
| A | 7795 | 6931 | 8 | 8 | 0.10% | 0.12% | 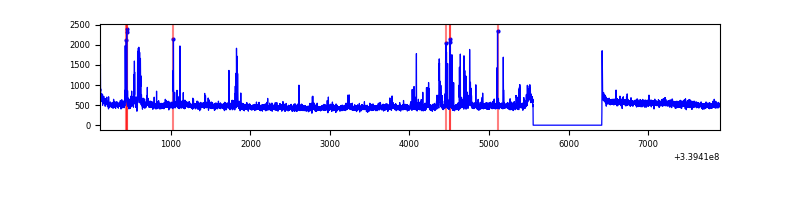 |
| B | 7795 | 6931 | 125 | 125 | 1.60% | 1.80% | 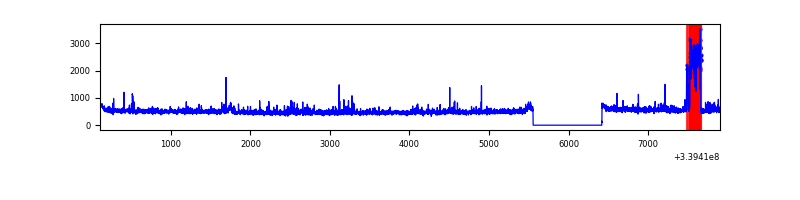 |
| C | 7795 | 6931 | 10 | 10 | 0.13% | 0.14% | 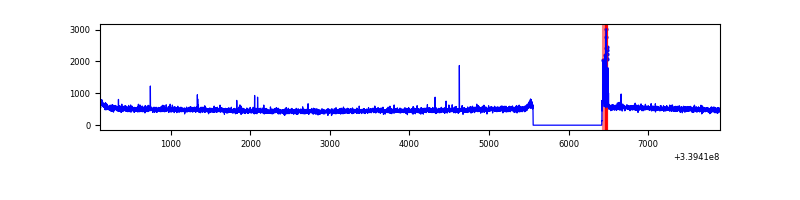 |
| D | 7795 | 6931 | 435 | 435 | 5.58% | 6.28% | 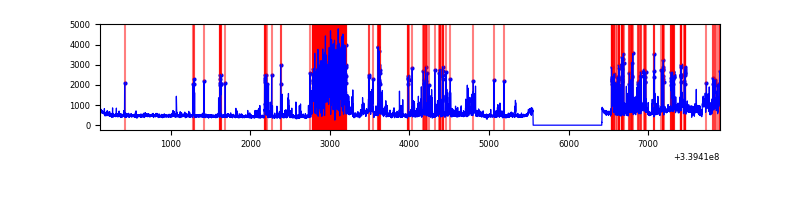 |
Top three noisy pixels from each quadrant. If the there are fewer than three noisy pixels in the level2.evt file, extra rows are filled as -1
| Pixel properties | Quadrant properties | ||||||
|---|---|---|---|---|---|---|---|
| Quadrant | DetID | PixID | Counts | Sigma | Mean | Median | Sigma |
| A | 14 | 235 | 215161 | 1232.83 | 859 | 840 | 173.8 |
| A | 6 | 16 | 40860 | 230.21 | 859 | 840 | 173.8 |
| A | 8 | 192 | 16054 | 87.52 | 859 | 840 | 173.8 |
| B | 10 | 245 | 373002 | 2269.24 | 846 | 822 | 164.0 |
| B | 3 | 64 | 82761 | 499.59 | 846 | 822 | 164.0 |
| B | 3 | 112 | 44467 | 266.11 | 846 | 822 | 164.0 |
| C | 14 | 238 | 132414 | 678.32 | 821 | 825 | 194.0 |
| C | 15 | 208 | 56308 | 286.01 | 821 | 825 | 194.0 |
| C | 2 | 16 | 7825 | 36.08 | 821 | 825 | 194.0 |
| D | 1 | 52 | 974068 | 4766.11 | 799 | 781 | 204.2 |
| D | 12 | 1 | 850923 | 4163.08 | 799 | 781 | 204.2 |
| D | 2 | 250 | 255419 | 1246.94 | 799 | 781 | 204.2 |
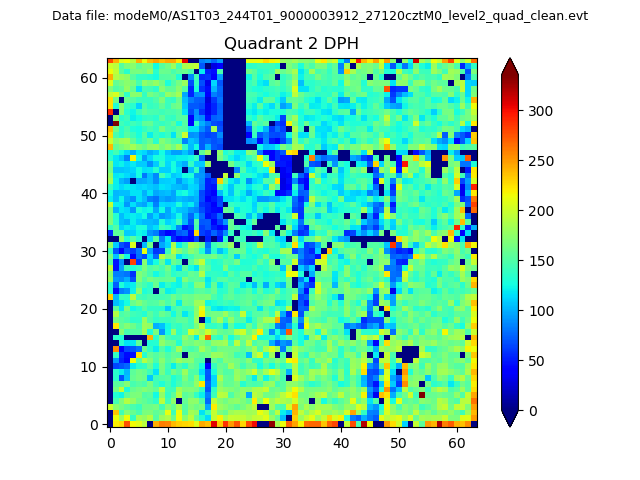
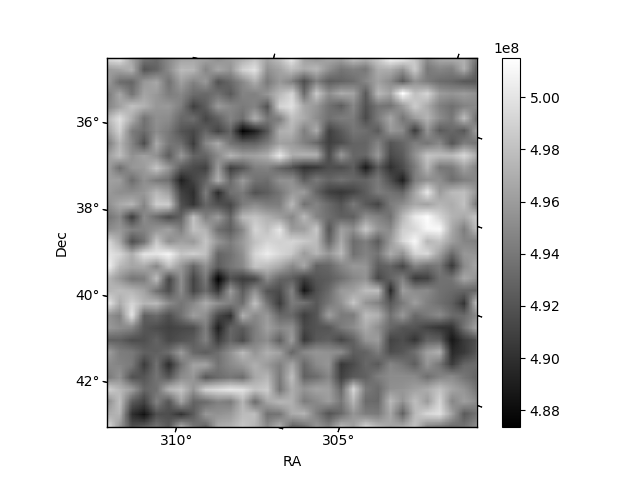
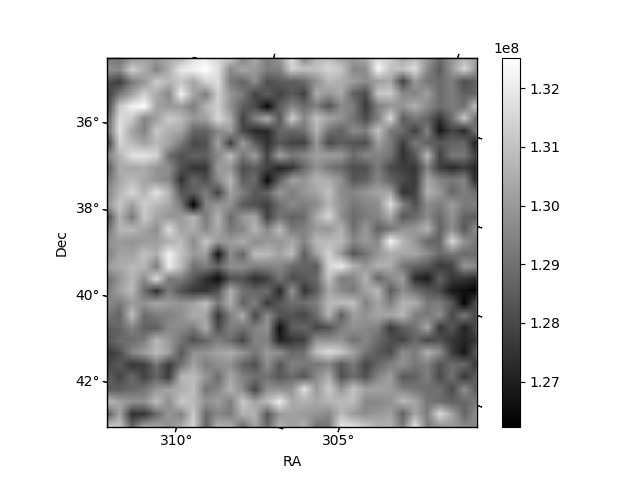
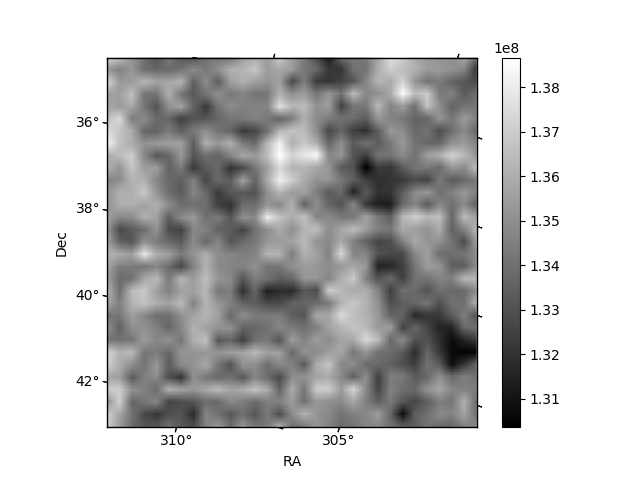
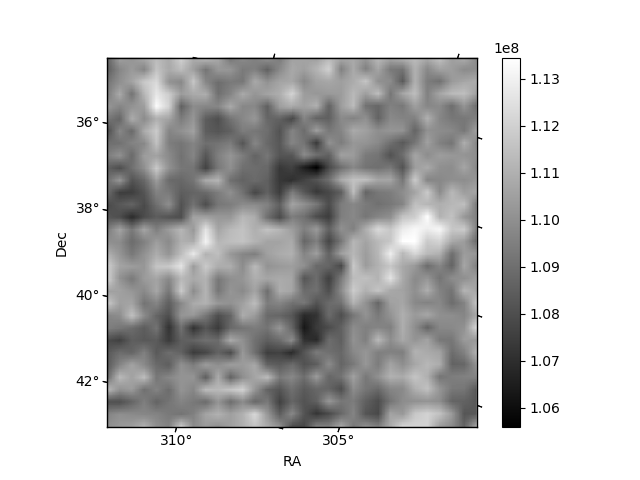
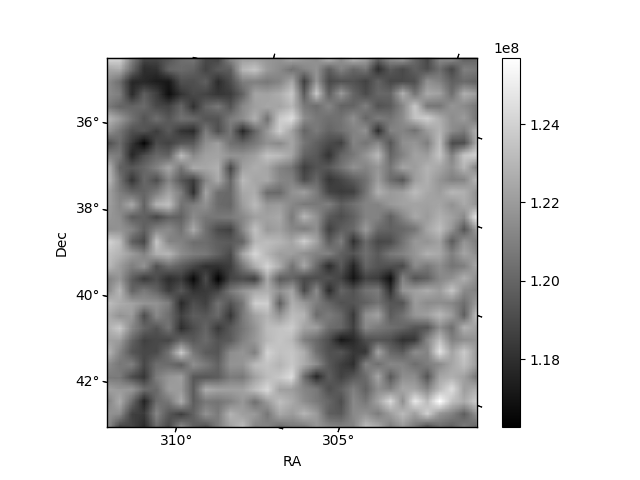
Histogram calculated using DETX and DETY for each event in the final _common_clean file
| Quadrant A | 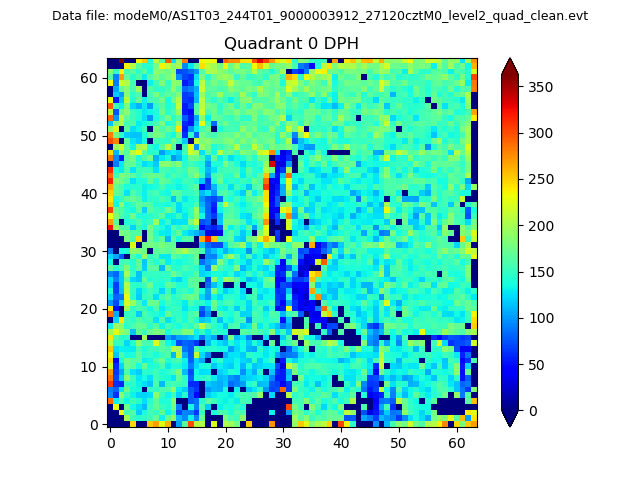 |
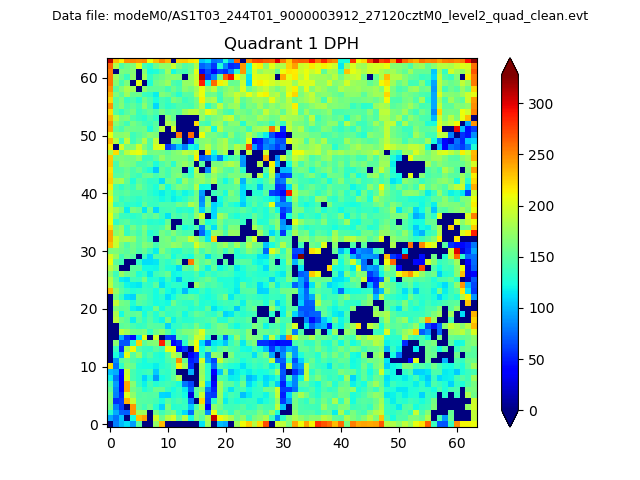 |
Quadrant B |
|---|---|---|---|
| Quadrant D | 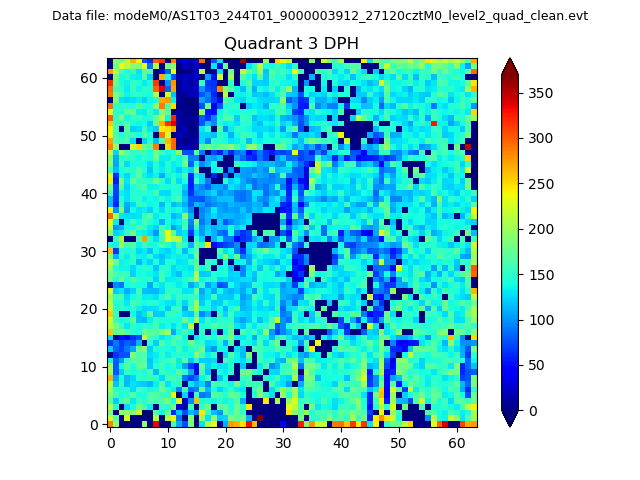 |
 |
Quadrant C |
| Plot type | Count rate plots | Images |
|---|---|---|
| Comparison with Poisson distribution Blue bars denote a histogram of data divided into 1 sec bins. Red curve is a Poisson curve with rate = median count rate of data. |
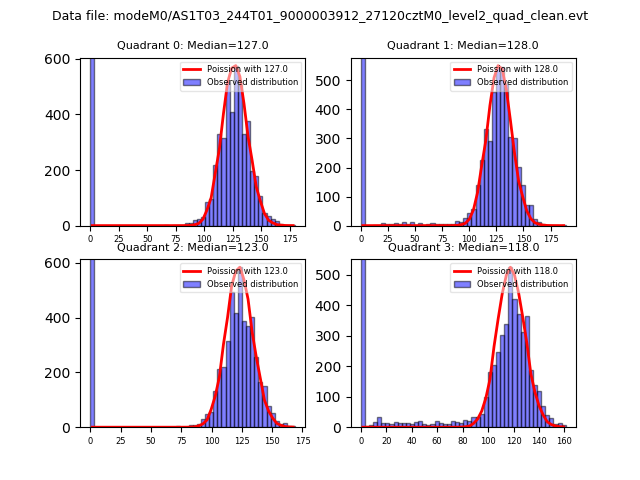 |
 |
| Quadrant-wise count rates Data is divided into 100 sec bins |
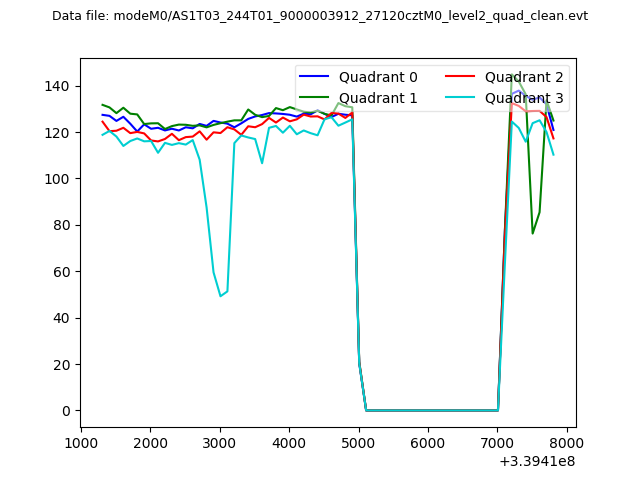 |
|
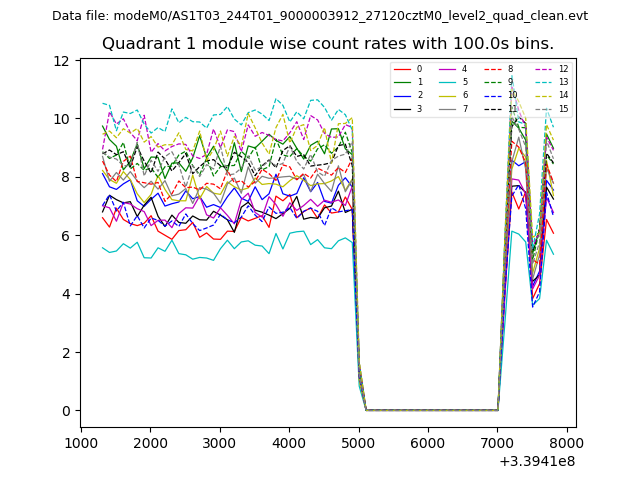
| Module-wise count rates for Quadrant A Data is divided into 100 sec bins |
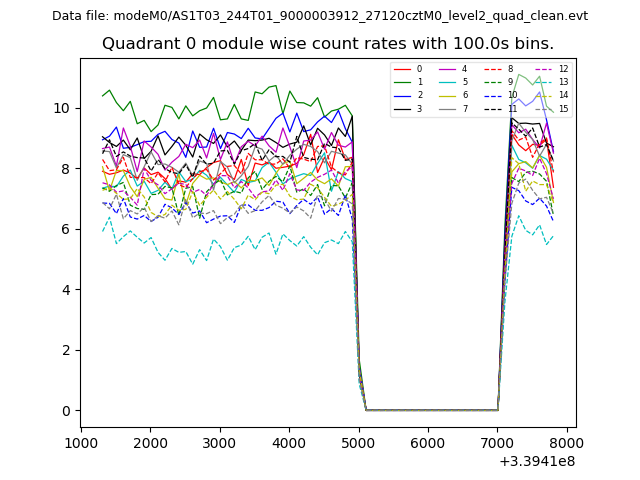 |
 |
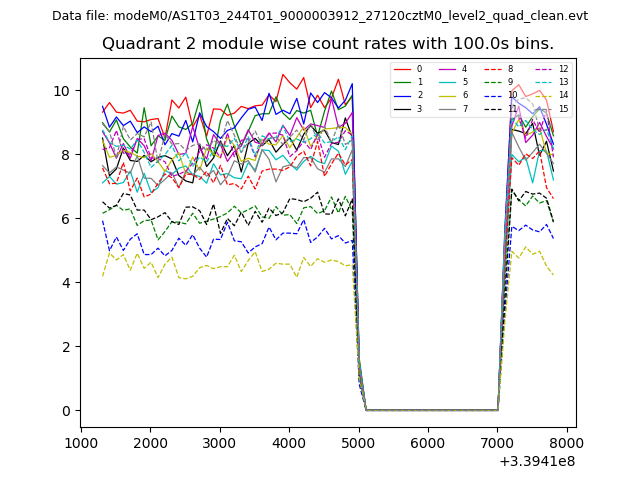
| Module-wise count rates for Quadrant B Data is divided into 100 sec bins |
 |
 |
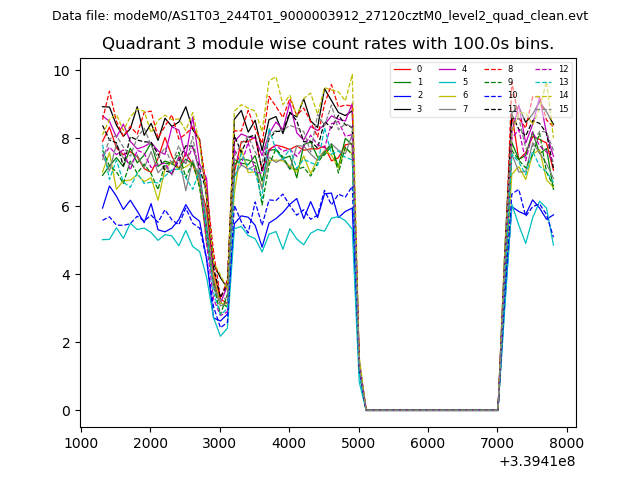
| Module-wise count rates for Quadrant C Data is divided into 100 sec bins |
 |
 |
| Module-wise count rates for Quadrant D Data is divided into 100 sec bins |
 |
 |
| Parameter | Plot |
|---|---|
| CZT HV Monitor | 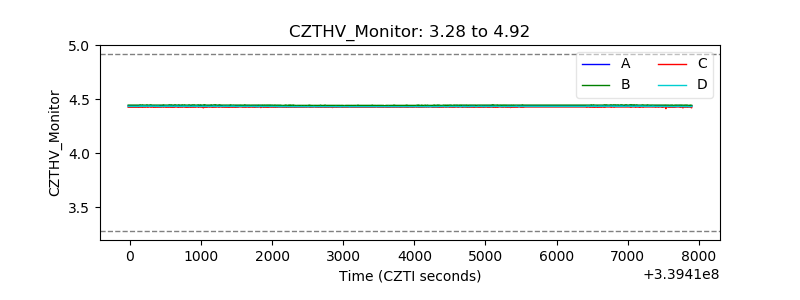 |
| D_VDD | 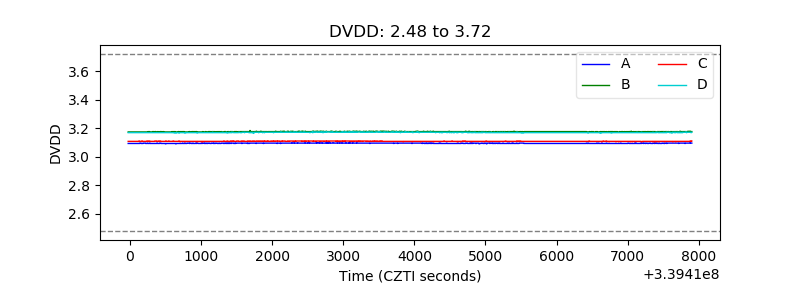 |
| Temperature 1 | 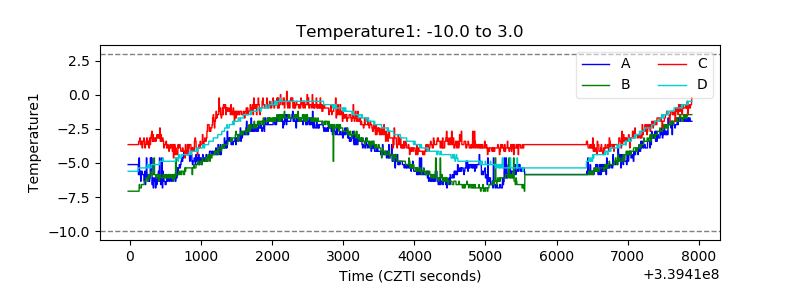 |
| Veto HV Monitor | 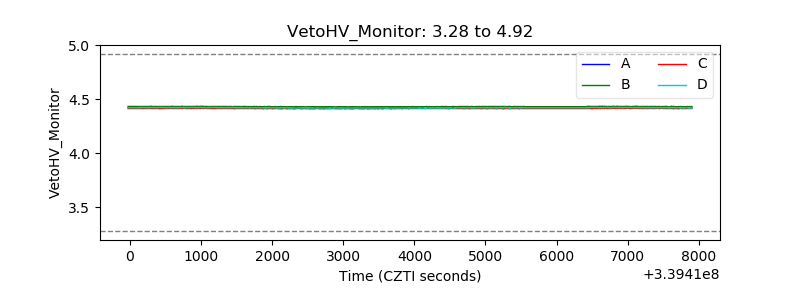 |
| Veto LLD | 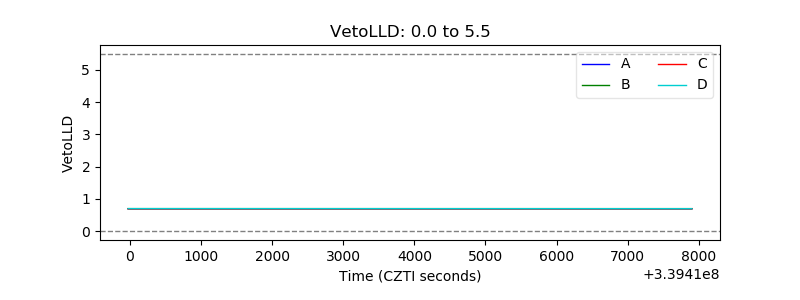 |
| Alpha Counter | 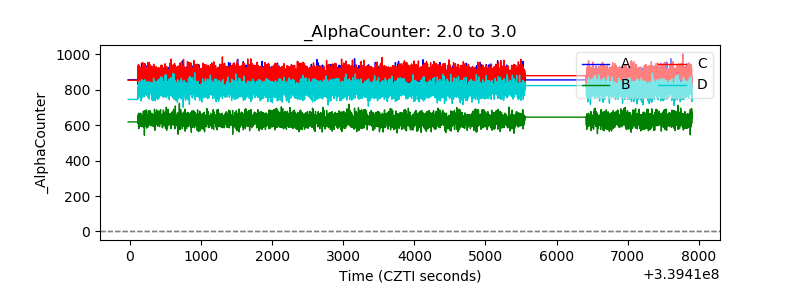 |
| _CPM_Rate | 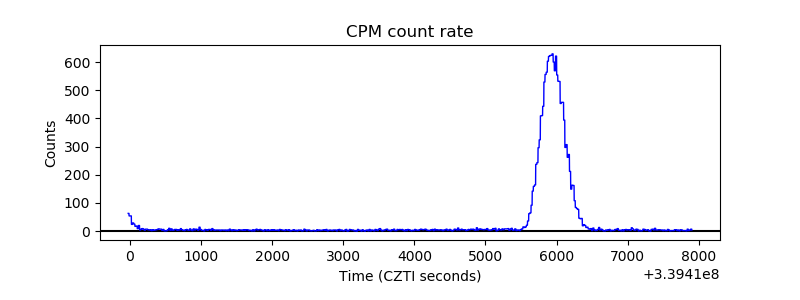 |
| CZT Counter | 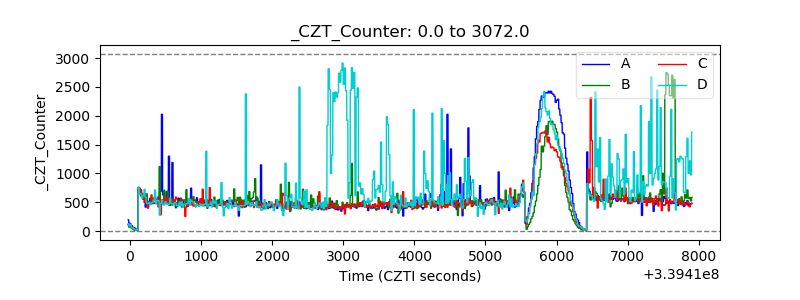 |
| +2.5 Volts monitor | 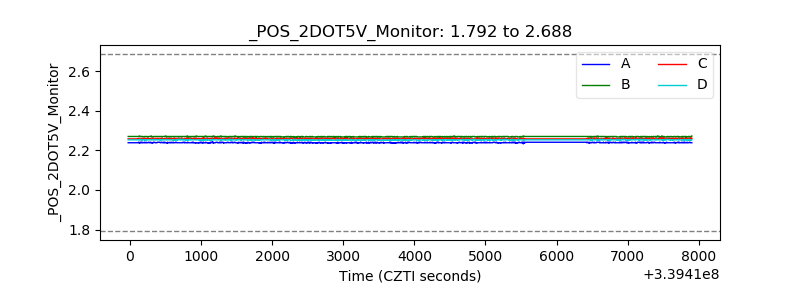 |
| +5 Volts monitor |  |
| _ROLL_ROT | 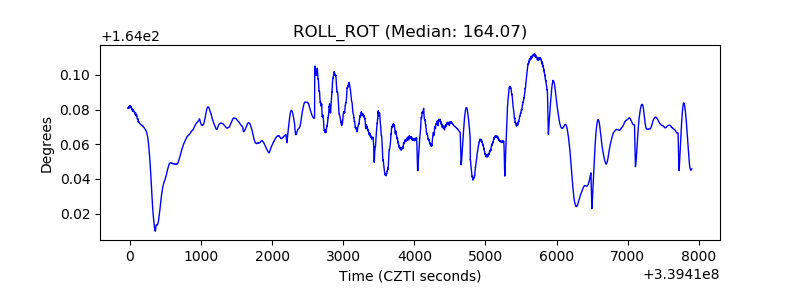 |
| _Roll_DEC | 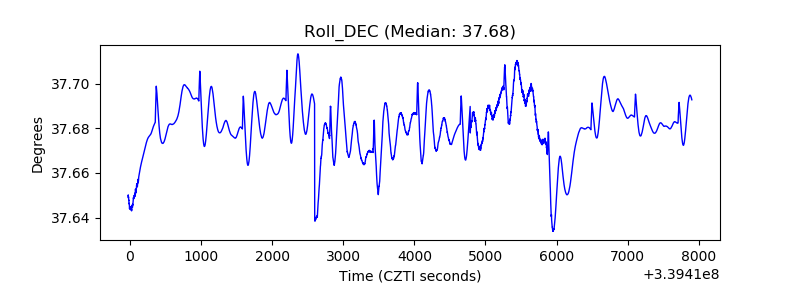 |
| _Roll_RA | 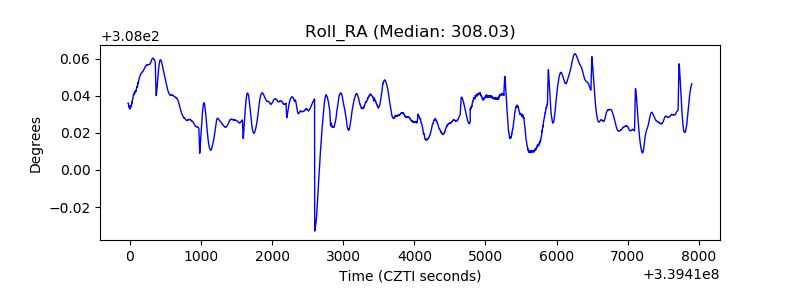 |
| Veto Counter | 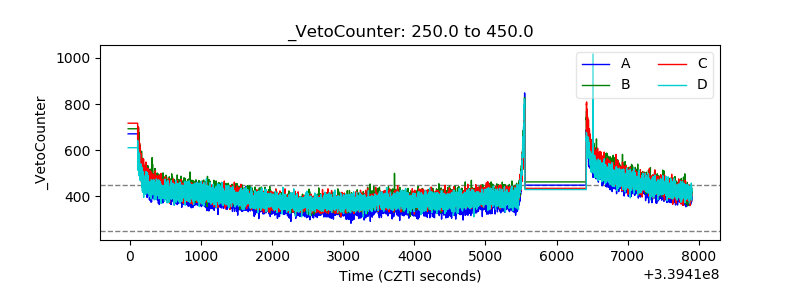 |