| Param | Original file | Final file |
|---|---|---|
| Filename | modeM0/AS1T03_244T01_9000003912_27121cztM0_level2.evt | modeM0/AS1T03_244T01_9000003912_27121cztM0_level2_quad_clean.evt |
| Size (bytes) | 569,476,800 | 97,266,240 |
| Size | 543.1 MB | 92.8 MB |
| Events in quadrant A | 3,230,484 | 662,279 |
| Events in quadrant B | 5,645,239 | 613,836 |
| Events in quadrant C | 2,984,765 | 636,324 |
| Events in quadrant D | 4,974,833 | 608,690 |
| Mode M9 | |||
|---|---|---|---|
| Quadrant | BADHDUFLAG | Total packets | Discarded packets |
| A | 0 | 10 | 0 |
| B | 0 | 10 | 0 |
| C | 0 | 10 | 0 |
| D | 0 | 10 | 0 |
| Mode M0 | |||
|---|---|---|---|
| Quadrant | BADHDUFLAG | Total packets | Discarded packets |
| A | 0 | 13520 | 0 |
| B | 0 | 20810 | 0 |
| C | 0 | 12724 | 0 |
| D | 0 | 18979 | 0 |
| Quadrant | Total seconds | Saturated seconds | Saturation percentage |
|---|---|---|---|
| A | 6073 | 70 | 1.152643% |
| B | 6073 | 887 | 14.605631% |
| C | 6073 | 106 | 1.745431% |
| D | 6073 | 285 | 4.692903% |
Noise dominated data is calculated using 1-second bins in cleaned event files. If a bin has >2000 counts, and if more than 50% of those come from <1% of pixels, then it is considered to be noise-dominated and hence unusable.
| Quadrant | # 1 sec bins | Bins with >0 counts | Bins with >2000 counts | High rate bins dominated by noise | Noise dominated (total time) | Noise dominated (detector-on time) | Marked lightcurve |
|---|---|---|---|---|---|---|---|
| A | 7068 | 6074 | 5 | 5 | 0.07% | 0.08% | 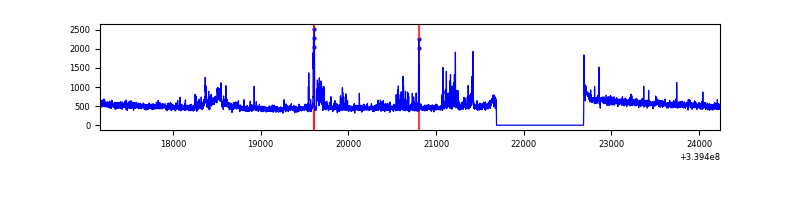 |
| B | 7068 | 6074 | 729 | 729 | 10.31% | 12.00% | 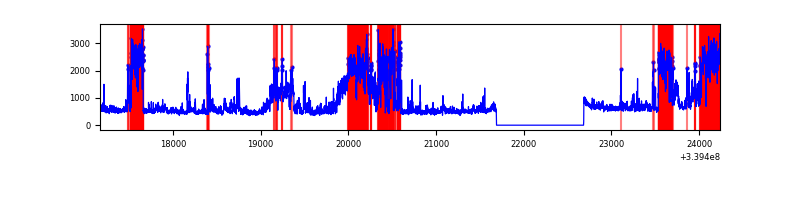 |
| C | 7068 | 6074 | 3 | 3 | 0.04% | 0.05% | 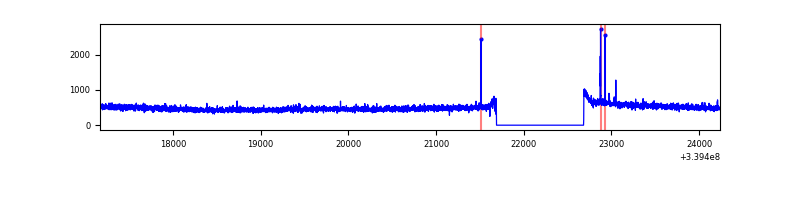 |
| D | 7068 | 6074 | 221 | 221 | 3.13% | 3.64% | 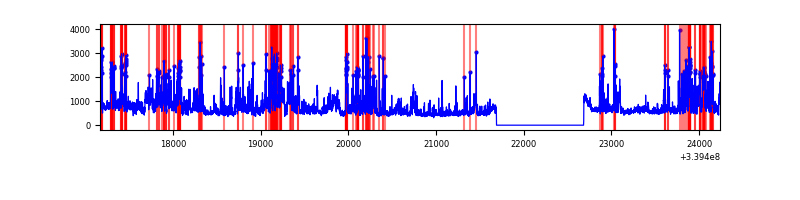 |
Top three noisy pixels from each quadrant. If the there are fewer than three noisy pixels in the level2.evt file, extra rows are filled as -1
| Pixel properties | Quadrant properties | ||||||
|---|---|---|---|---|---|---|---|
| Quadrant | DetID | PixID | Counts | Sigma | Mean | Median | Sigma |
| A | 13 | 170 | 100150 | 648.51 | 766 | 750 | 153.3 |
| A | 14 | 235 | 73059 | 471.76 | 766 | 750 | 153.3 |
| A | 12 | 189 | 56330 | 362.62 | 766 | 750 | 153.3 |
| B | 10 | 245 | 1965291 | 14239.18 | 716 | 697 | 138.0 |
| B | 0 | 189 | 692344 | 5012.99 | 716 | 697 | 138.0 |
| B | 3 | 64 | 78802 | 566.1 | 716 | 697 | 138.0 |
| C | 14 | 238 | 117228 | 680.92 | 727 | 733 | 171.1 |
| C | 15 | 208 | 16663 | 93.11 | 727 | 733 | 171.1 |
| C | 14 | 225 | 12844 | 70.79 | 727 | 733 | 171.1 |
| D | 1 | 52 | 1438225 | 7500.37 | 722 | 709 | 191.7 |
| D | 7 | 38 | 359791 | 1873.54 | 722 | 709 | 191.7 |
| D | 2 | 250 | 251735 | 1309.75 | 722 | 709 | 191.7 |
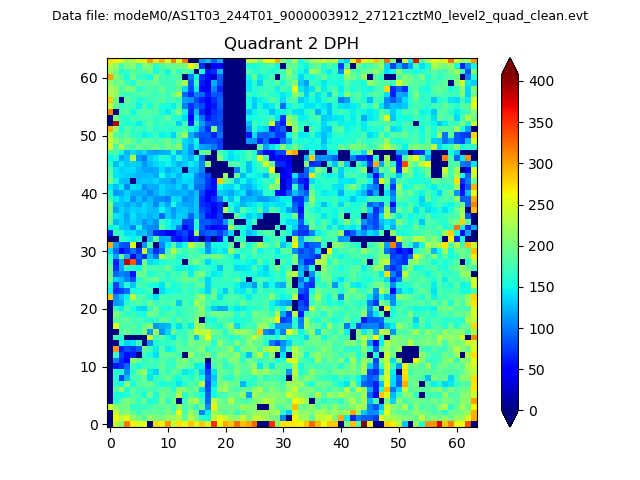
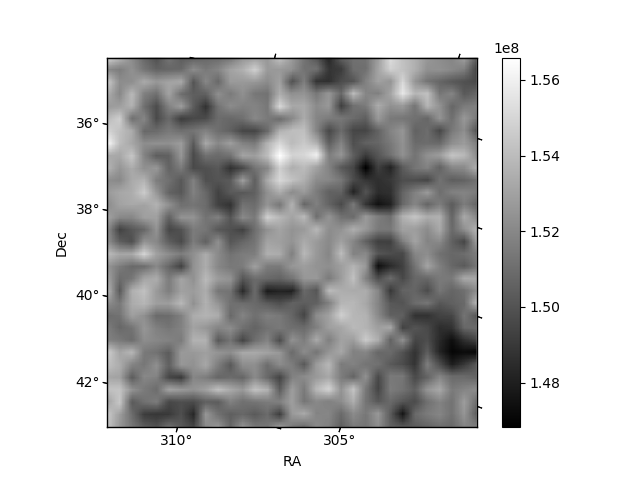
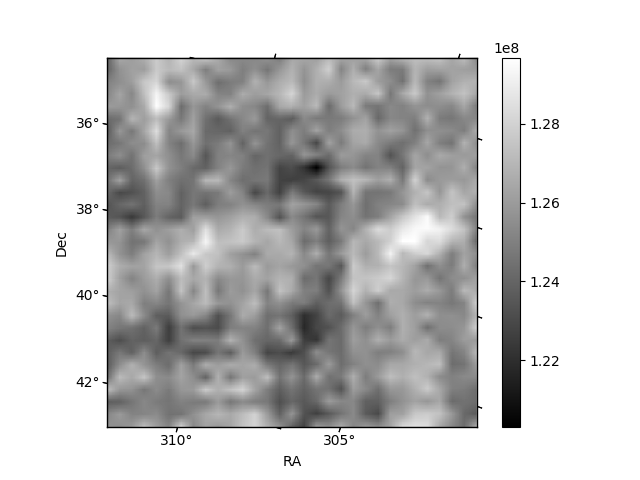
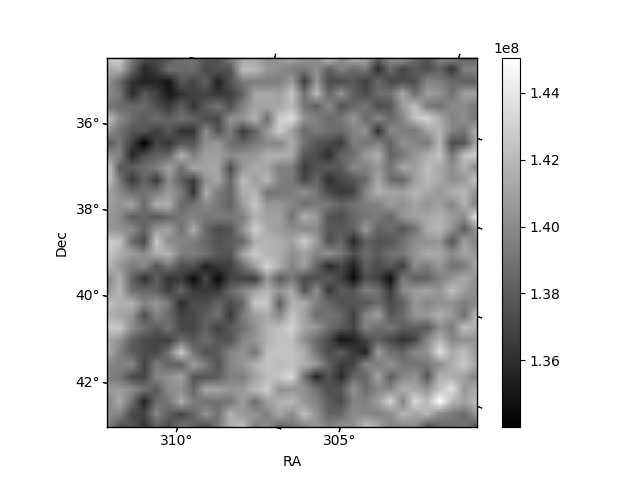
Histogram calculated using DETX and DETY for each event in the final _common_clean file
| Quadrant A | 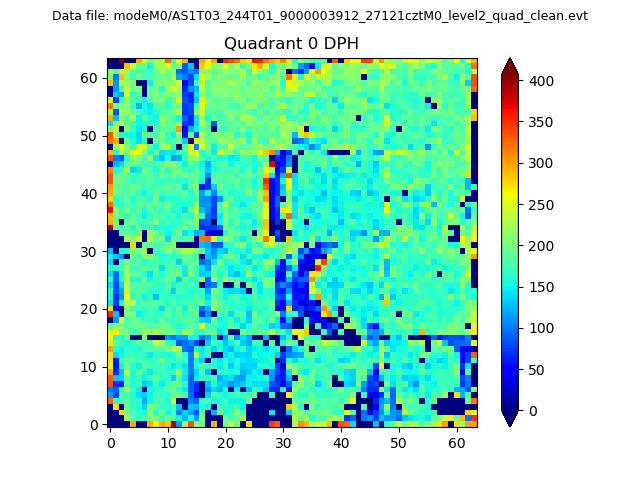 |
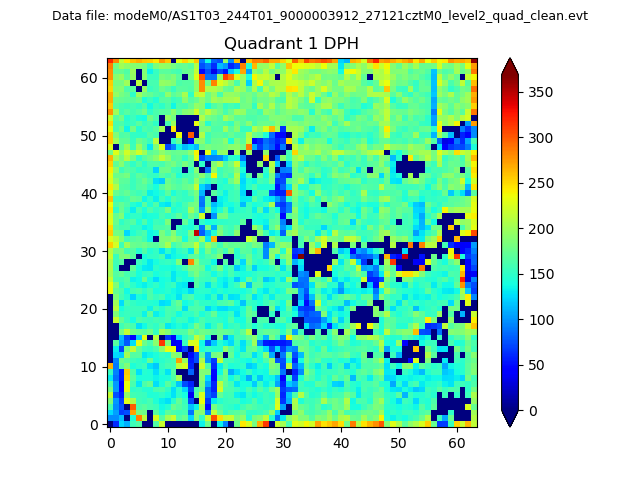 |
Quadrant B |
|---|---|---|---|
| Quadrant D | 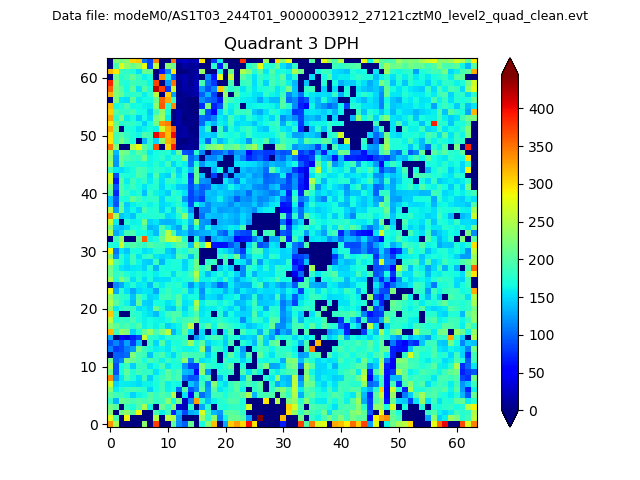 |
 |
Quadrant C |
| Plot type | Count rate plots | Images |
|---|---|---|
| Comparison with Poisson distribution Blue bars denote a histogram of data divided into 1 sec bins. Red curve is a Poisson curve with rate = median count rate of data. |
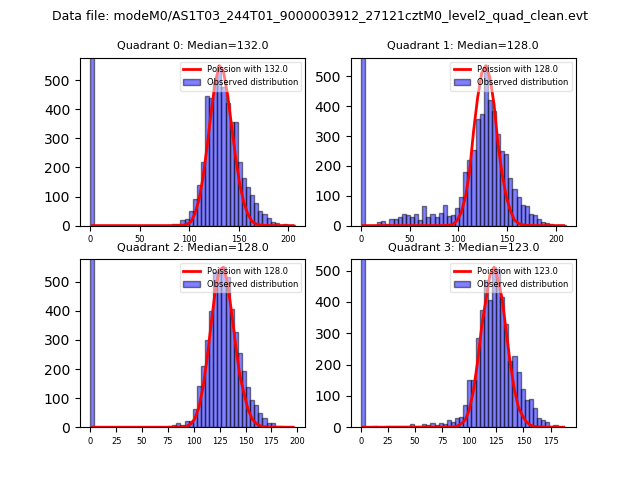 |
 |
| Quadrant-wise count rates Data is divided into 100 sec bins |
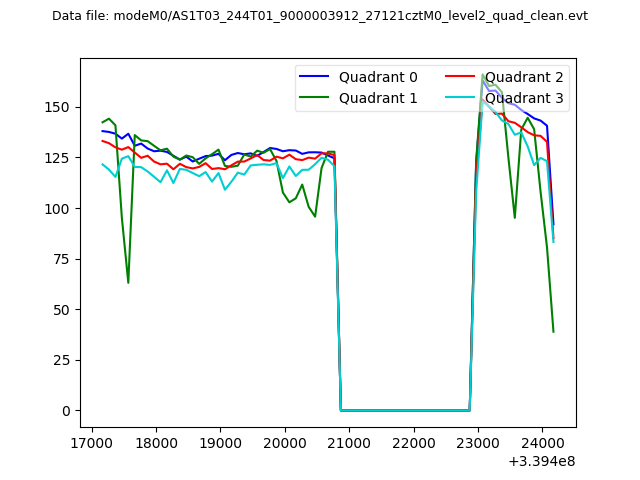 |
|
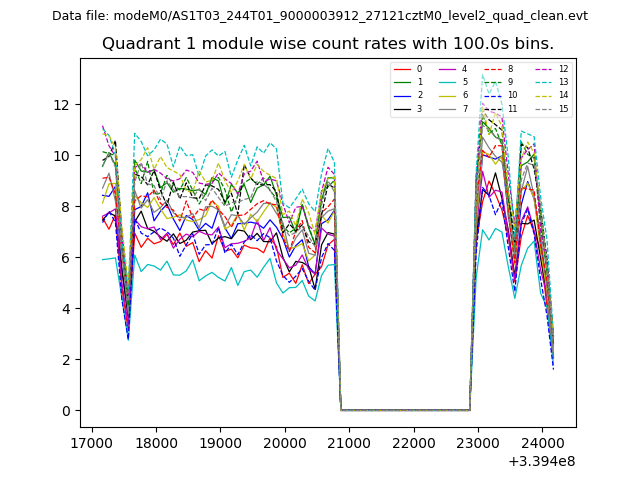
| Module-wise count rates for Quadrant A Data is divided into 100 sec bins |
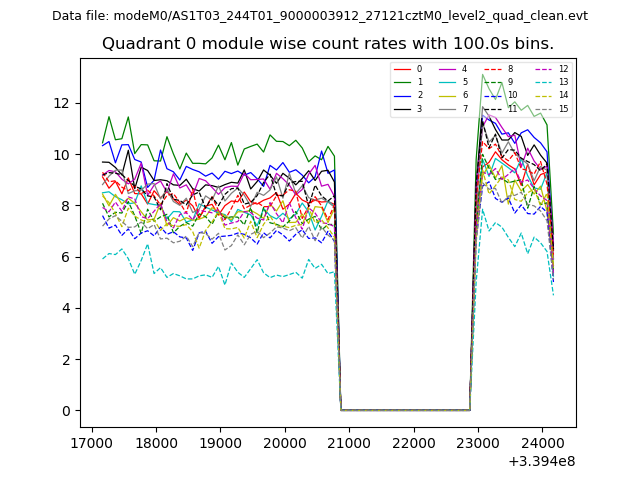 |
 |
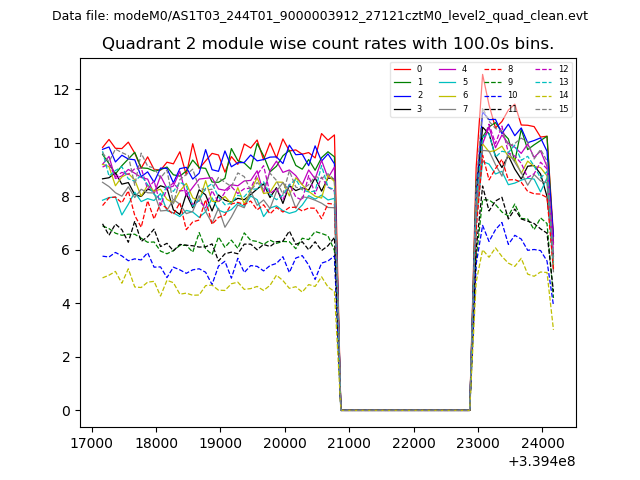
| Module-wise count rates for Quadrant B Data is divided into 100 sec bins |
 |
 |
| Module-wise count rates for Quadrant C Data is divided into 100 sec bins |
 |
 |
| Module-wise count rates for Quadrant D Data is divided into 100 sec bins |
 |
 |
| Parameter | Plot |
|---|---|
| CZT HV Monitor | 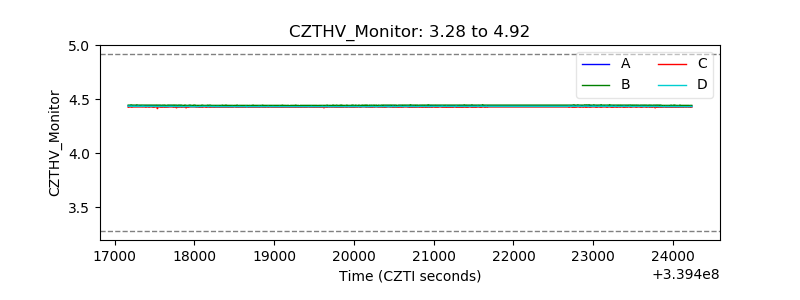 |
| D_VDD | 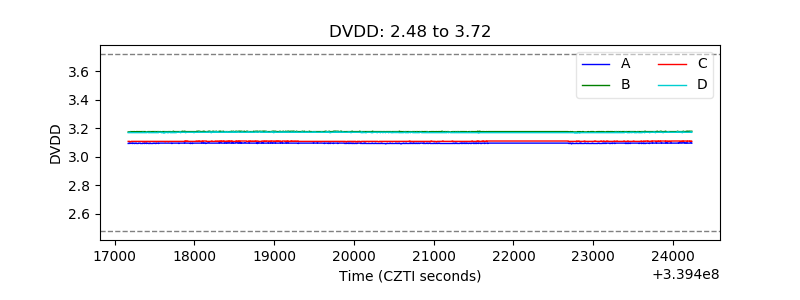 |
| Temperature 1 | 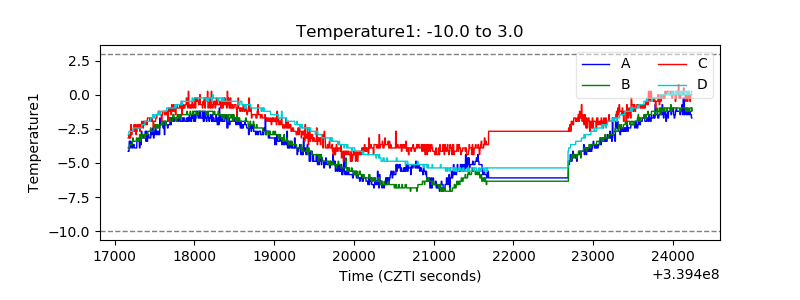 |
| Veto HV Monitor | 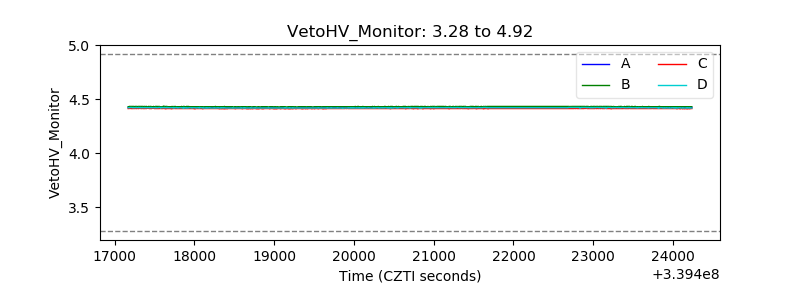 |
| Veto LLD | 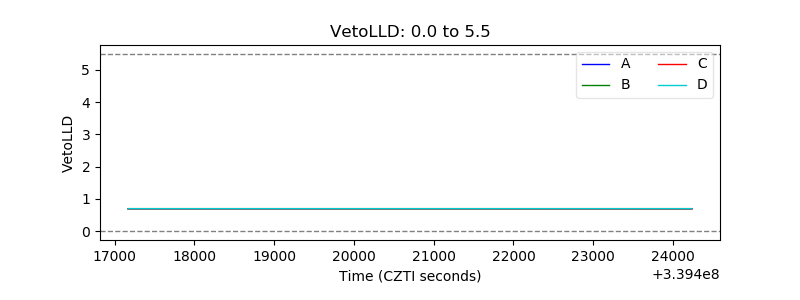 |
| Alpha Counter | 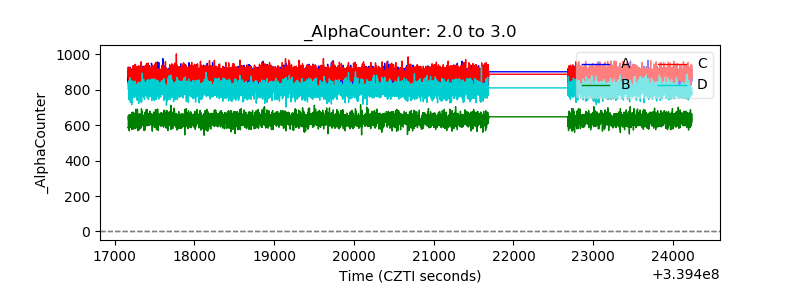 |
| _CPM_Rate | 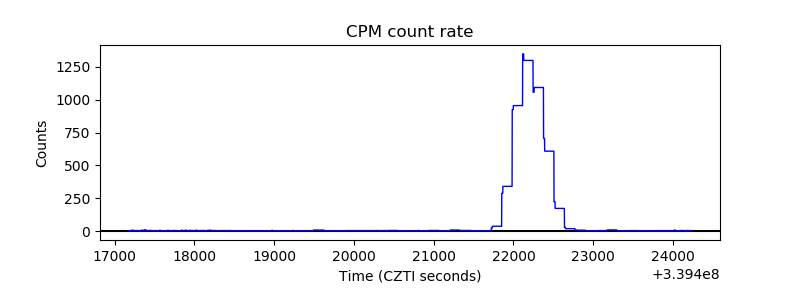 |
| CZT Counter |  |
| +2.5 Volts monitor |  |
| +5 Volts monitor |  |
| _ROLL_ROT |  |
| _Roll_DEC | 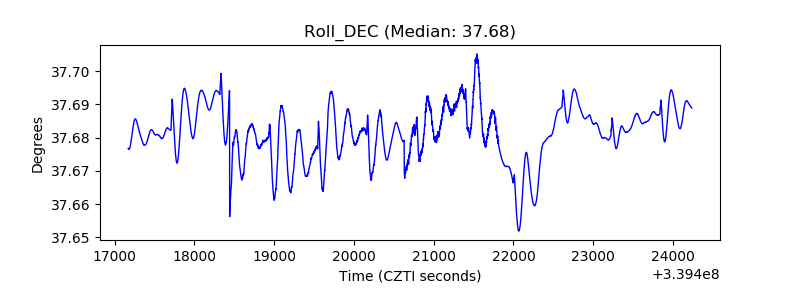 |
| _Roll_RA | 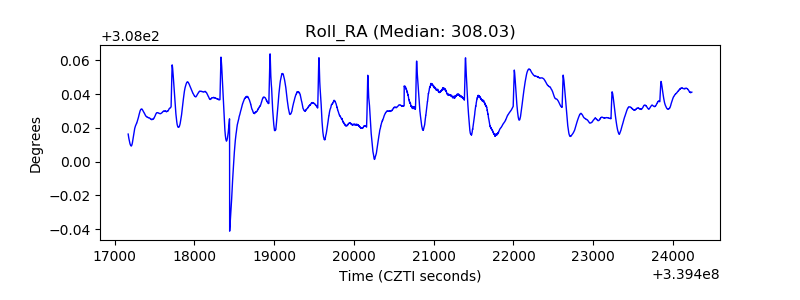 |
| Veto Counter | 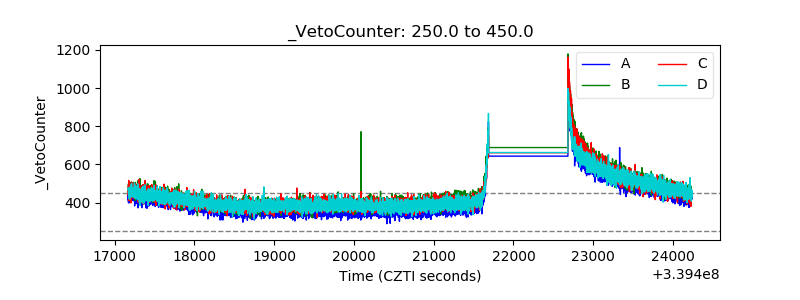 |