| Param | Original file | Final file |
|---|---|---|
| Filename | modeM0/AS1T03_244T01_9000003912_27124cztM0_level2.evt | modeM0/AS1T03_244T01_9000003912_27124cztM0_level2_quad_clean.evt |
| Size (bytes) | 583,329,600 | 118,293,120 |
| Size | 556.3 MB | 112.8 MB |
| Events in quadrant A | 5,384,731 | 795,250 |
| Events in quadrant B | 3,853,546 | 815,694 |
| Events in quadrant C | 3,449,594 | 771,174 |
| Events in quadrant D | 4,539,846 | 748,712 |
| Mode M9 | |||
|---|---|---|---|
| Quadrant | BADHDUFLAG | Total packets | Discarded packets |
| A | 0 | 12 | 0 |
| B | 0 | 12 | 0 |
| C | 0 | 12 | 0 |
| D | 0 | 12 | 0 |
| Mode M0 | |||
|---|---|---|---|
| Quadrant | BADHDUFLAG | Total packets | Discarded packets |
| A | 0 | 20583 | 0 |
| B | 0 | 15618 | 0 |
| C | 0 | 14338 | 0 |
| D | 0 | 17917 | 0 |
| Quadrant | Total seconds | Saturated seconds | Saturation percentage |
|---|---|---|---|
| A | 6469 | 329 | 5.085794% |
| B | 6470 | 116 | 1.792890% |
| C | 6470 | 120 | 1.854714% |
| D | 6470 | 196 | 3.029366% |
Noise dominated data is calculated using 1-second bins in cleaned event files. If a bin has >2000 counts, and if more than 50% of those come from <1% of pixels, then it is considered to be noise-dominated and hence unusable.
| Quadrant | # 1 sec bins | Bins with >0 counts | Bins with >2000 counts | High rate bins dominated by noise | Noise dominated (total time) | Noise dominated (detector-on time) | Marked lightcurve |
|---|---|---|---|---|---|---|---|
| A | 7714 | 6470 | 213 | 213 | 2.76% | 3.29% | 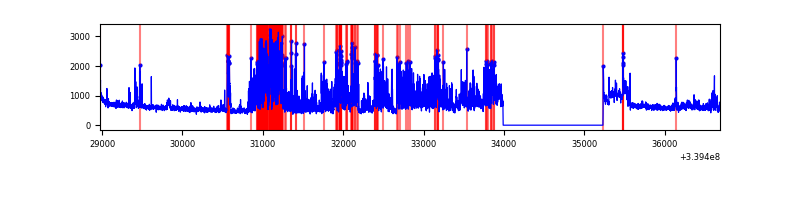 |
| B | 7714 | 6470 | 26 | 26 | 0.34% | 0.40% | 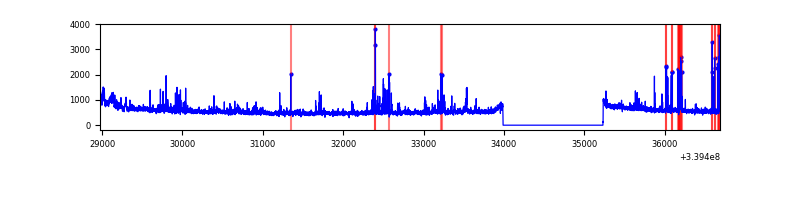 |
| C | 7714 | 6470 | 0 | 0 | 0.00% | 0.00% | 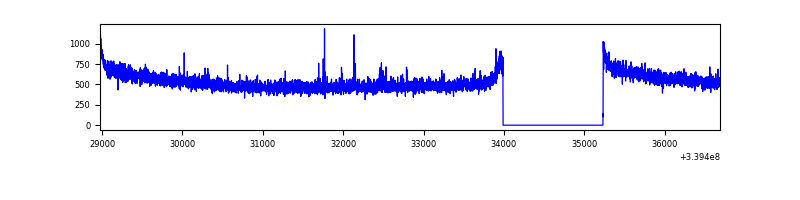 |
| D | 7714 | 6470 | 124 | 124 | 1.61% | 1.92% | 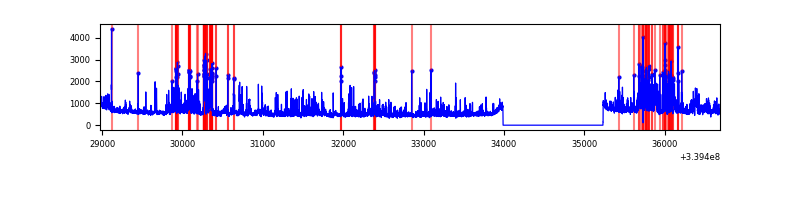 |
Top three noisy pixels from each quadrant. If the there are fewer than three noisy pixels in the level2.evt file, extra rows are filled as -1
| Pixel properties | Quadrant properties | ||||||
|---|---|---|---|---|---|---|---|
| Quadrant | DetID | PixID | Counts | Sigma | Mean | Median | Sigma |
| A | 6 | 16 | 1536864 | 8930.38 | 876 | 862 | 172.0 |
| A | 14 | 235 | 337609 | 1957.86 | 876 | 862 | 172.0 |
| A | 11 | 29 | 85763 | 493.62 | 876 | 862 | 172.0 |
| B | 10 | 245 | 110505 | 684.07 | 869 | 851 | 160.3 |
| B | 0 | 189 | 96351 | 595.77 | 869 | 851 | 160.3 |
| B | 7 | 205 | 80775 | 498.6 | 869 | 851 | 160.3 |
| C | 14 | 238 | 134796 | 686.65 | 843 | 849 | 195.1 |
| C | 3 | 233 | 15868 | 76.99 | 843 | 849 | 195.1 |
| C | 2 | 16 | 8048 | 36.9 | 843 | 849 | 195.1 |
| D | 1 | 52 | 555345 | 2515.24 | 846 | 833 | 220.5 |
| D | 7 | 38 | 420618 | 1904.12 | 846 | 833 | 220.5 |
| D | 12 | 233 | 223503 | 1010.02 | 846 | 833 | 220.5 |
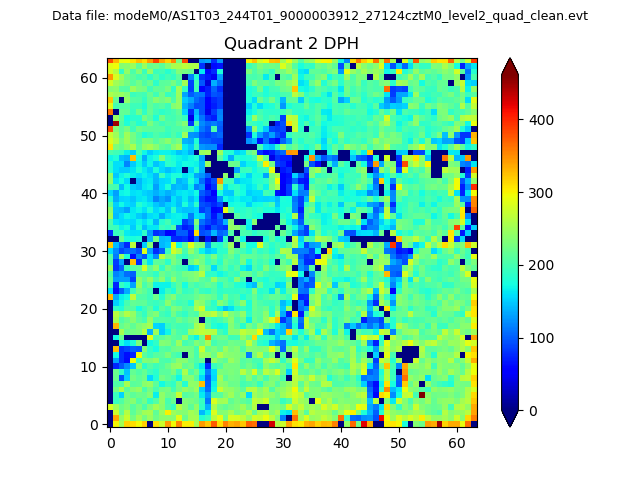
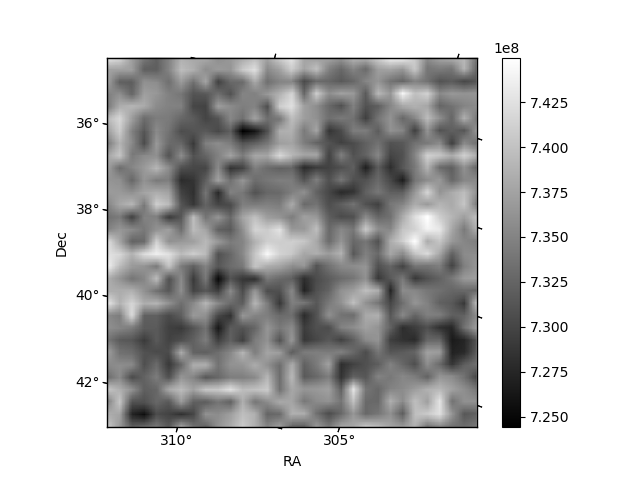
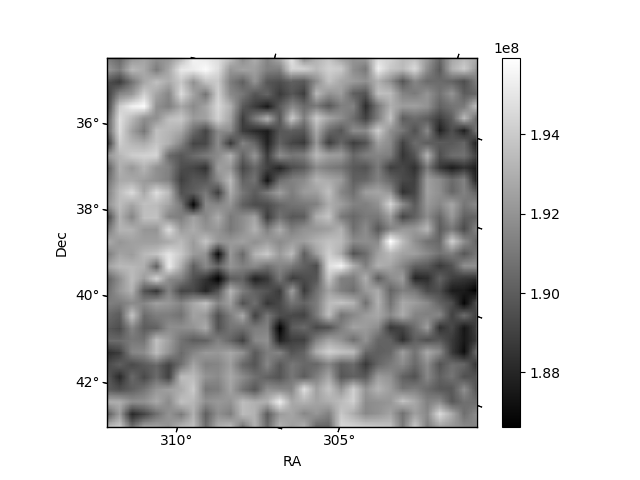
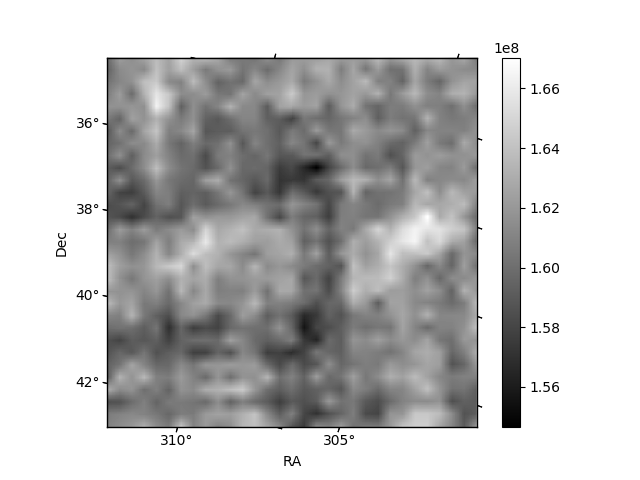
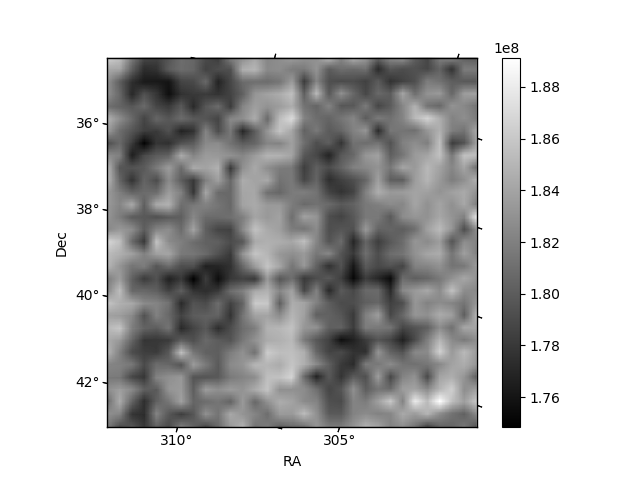
Histogram calculated using DETX and DETY for each event in the final _common_clean file
| Quadrant A | 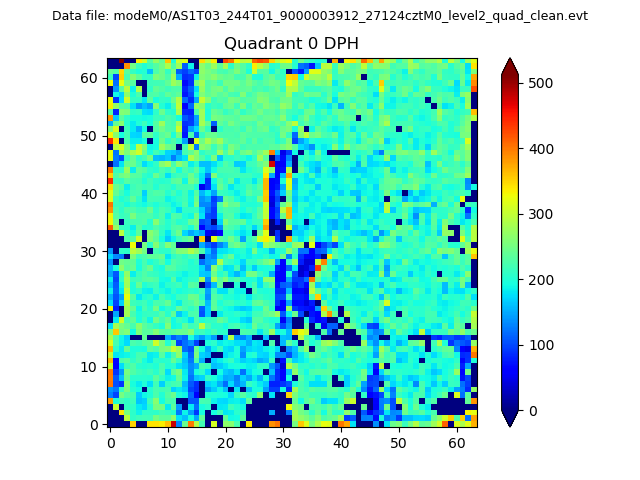 |
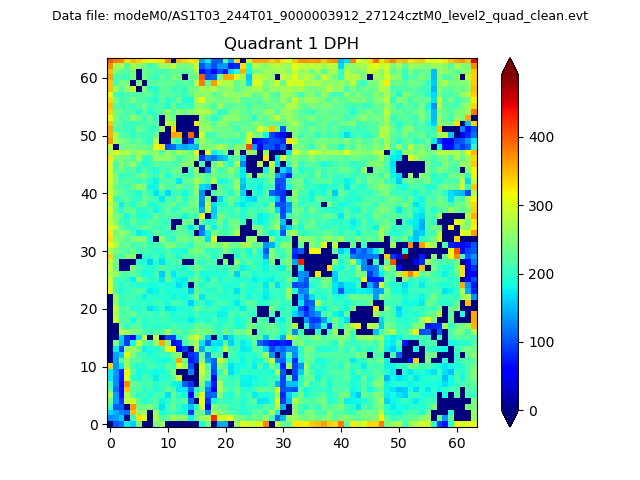 |
Quadrant B |
|---|---|---|---|
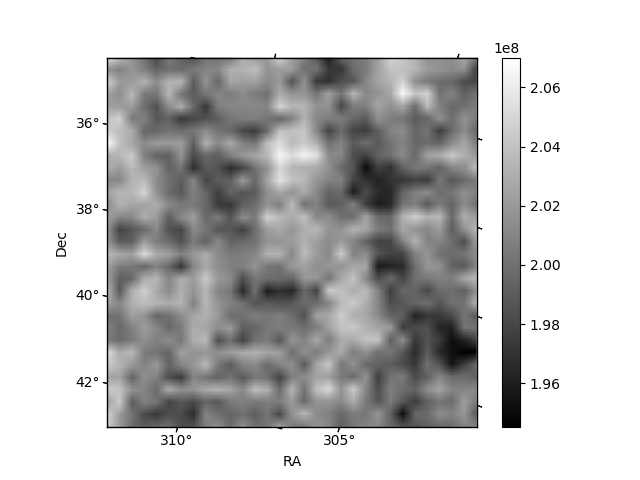
| Quadrant D | 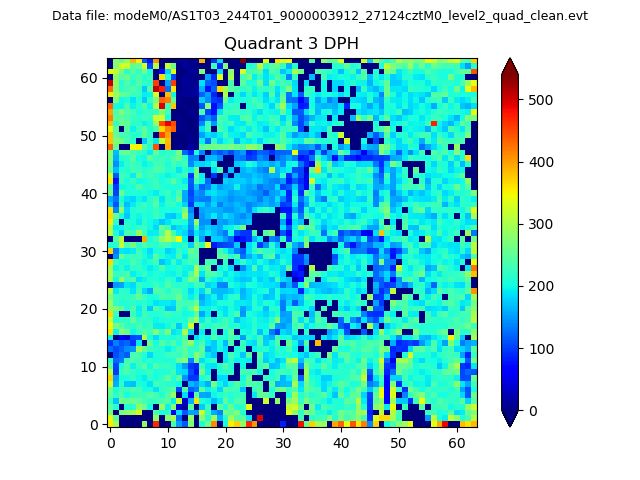 |
 |
Quadrant C |
| Plot type | Count rate plots | Images |
|---|---|---|
| Comparison with Poisson distribution Blue bars denote a histogram of data divided into 1 sec bins. Red curve is a Poisson curve with rate = median count rate of data. |
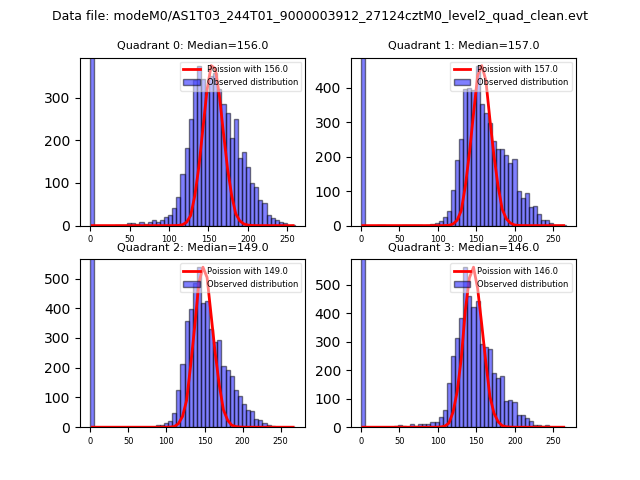 |
 |
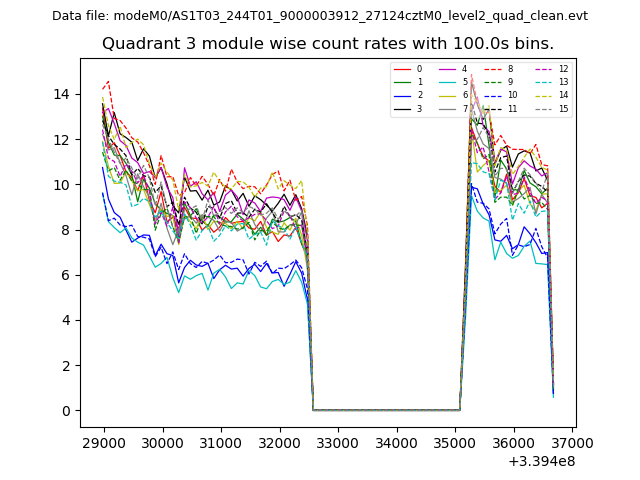
| Quadrant-wise count rates Data is divided into 100 sec bins |
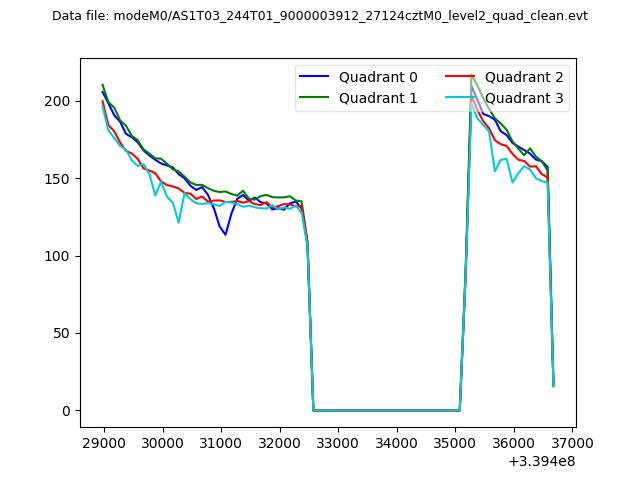 |
|
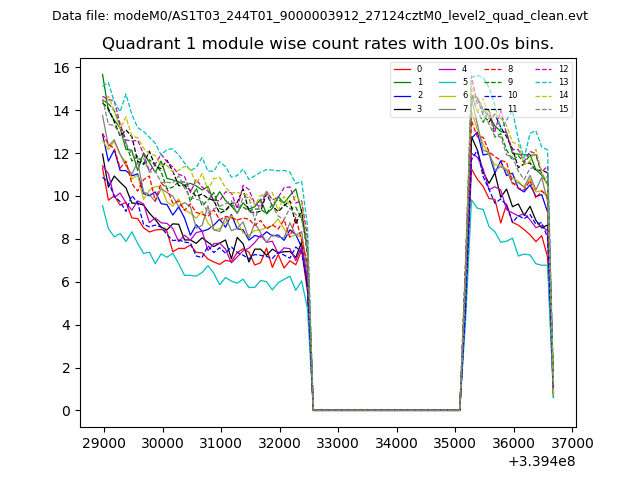
| Module-wise count rates for Quadrant A Data is divided into 100 sec bins |
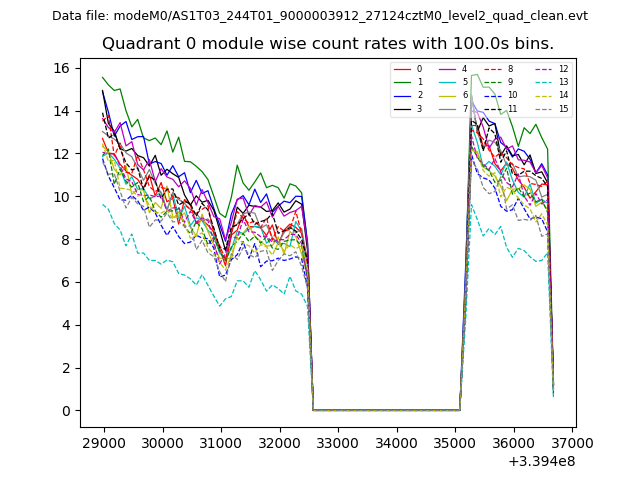 |
 |
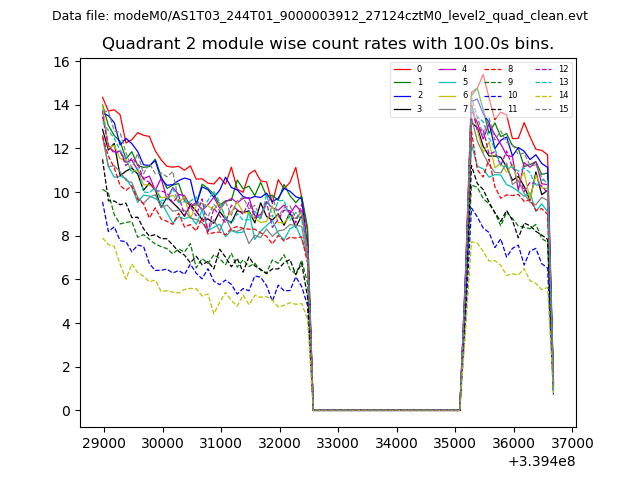
| Module-wise count rates for Quadrant B Data is divided into 100 sec bins |
 |
 |
| Module-wise count rates for Quadrant C Data is divided into 100 sec bins |
 |
 |
| Module-wise count rates for Quadrant D Data is divided into 100 sec bins |
 |
 |
| Parameter | Plot |
|---|---|
| CZT HV Monitor | 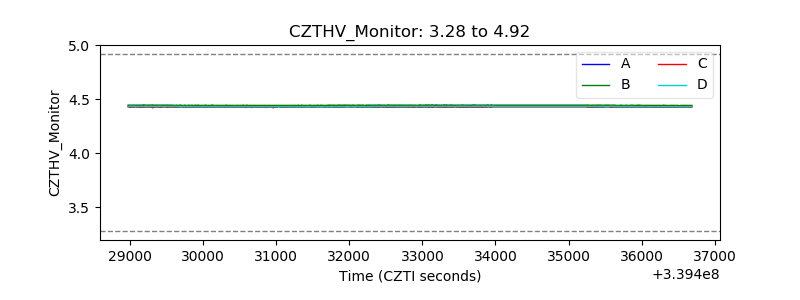 |
| D_VDD | 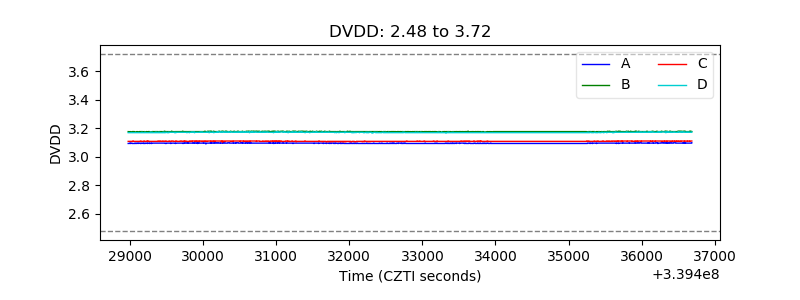 |
| Temperature 1 | 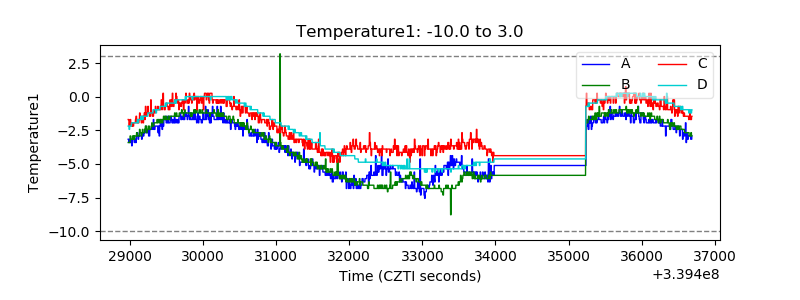 |
| Veto HV Monitor | 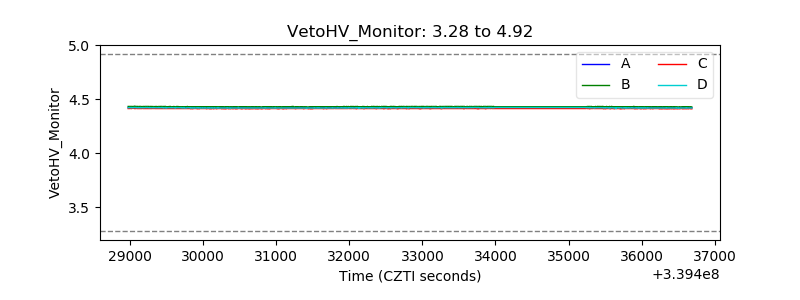 |
| Veto LLD | 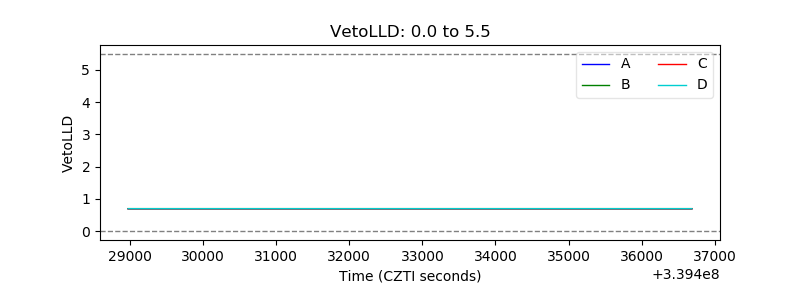 |
| Alpha Counter | 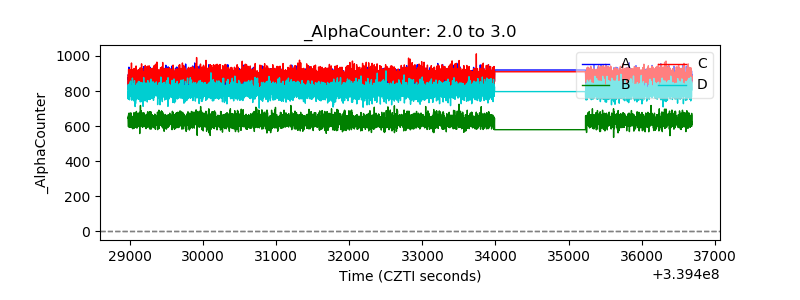 |
| _CPM_Rate | 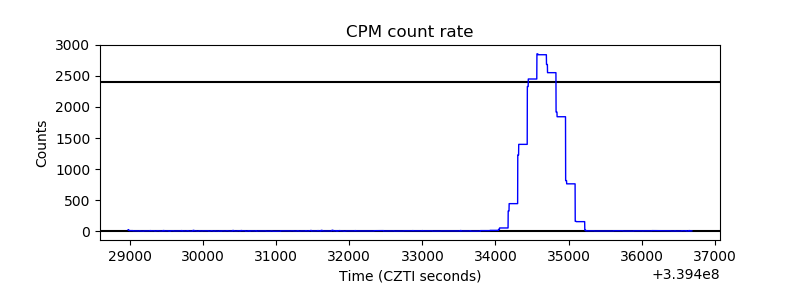 |
| CZT Counter | 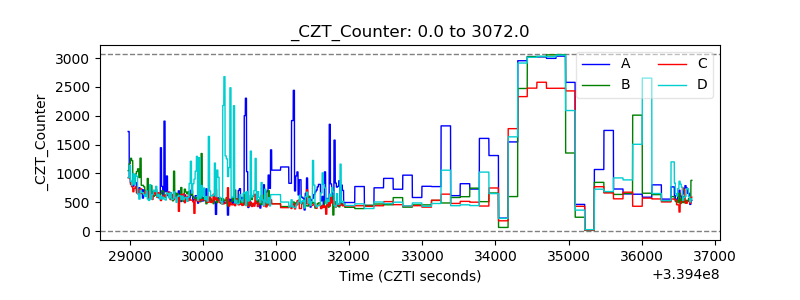 |
| +2.5 Volts monitor |  |
| +5 Volts monitor |  |
| _ROLL_ROT | 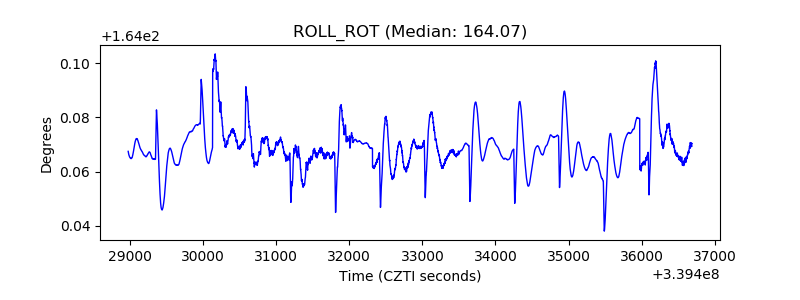 |
| _Roll_DEC |  |
| _Roll_RA | 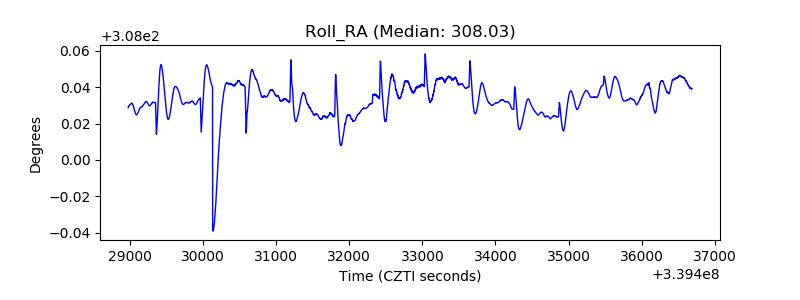 |
| Veto Counter | 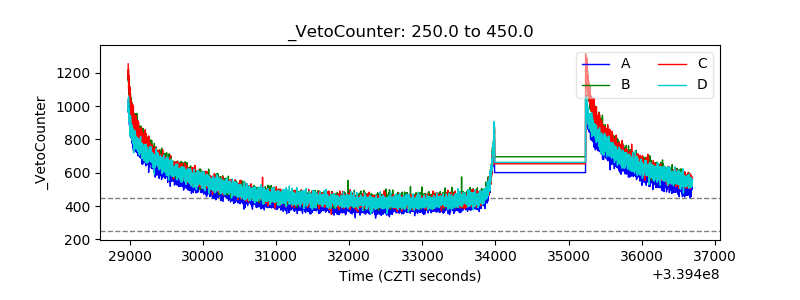 |