| Param | Original file | Final file |
|---|---|---|
| Filename | modeM0/AS1T03_244T01_9000003912_27125cztM0_level2.evt | modeM0/AS1T03_244T01_9000003912_27125cztM0_level2_quad_clean.evt |
| Size (bytes) | 507,873,600 | 97,125,120 |
| Size | 484.3 MB | 92.6 MB |
| Events in quadrant A | 3,702,890 | 652,719 |
| Events in quadrant B | 3,409,252 | 662,671 |
| Events in quadrant C | 3,090,255 | 632,208 |
| Events in quadrant D | 4,783,863 | 586,537 |
| Mode M9 | |||
|---|---|---|---|
| Quadrant | BADHDUFLAG | Total packets | Discarded packets |
| A | 0 | 13 | 0 |
| B | 0 | 13 | 0 |
| C | 0 | 13 | 0 |
| D | 0 | 13 | 0 |
| Mode M0 | |||
|---|---|---|---|
| Quadrant | BADHDUFLAG | Total packets | Discarded packets |
| A | 0 | 14849 | 0 |
| B | 0 | 13701 | 0 |
| C | 0 | 12711 | 0 |
| D | 0 | 18203 | 0 |
| Quadrant | Total seconds | Saturated seconds | Saturation percentage |
|---|---|---|---|
| A | 5819 | 105 | 1.804434% |
| B | 5819 | 121 | 2.079395% |
| C | 5819 | 96 | 1.649768% |
| D | 5820 | 417 | 7.164948% |
Noise dominated data is calculated using 1-second bins in cleaned event files. If a bin has >2000 counts, and if more than 50% of those come from <1% of pixels, then it is considered to be noise-dominated and hence unusable.
| Quadrant | # 1 sec bins | Bins with >0 counts | Bins with >2000 counts | High rate bins dominated by noise | Noise dominated (total time) | Noise dominated (detector-on time) | Marked lightcurve |
|---|---|---|---|---|---|---|---|
| A | 7129 | 5820 | 26 | 26 | 0.36% | 0.45% |  |
| B | 7129 | 5820 | 35 | 35 | 0.49% | 0.60% |  |
| C | 7129 | 5820 | 1 | 1 | 0.01% | 0.02% |  |
| D | 7130 | 5821 | 309 | 309 | 4.33% | 5.31% |  |
Top three noisy pixels from each quadrant. If the there are fewer than three noisy pixels in the level2.evt file, extra rows are filled as -1
| Pixel properties | Quadrant properties | ||||||
|---|---|---|---|---|---|---|---|
| Quadrant | DetID | PixID | Counts | Sigma | Mean | Median | Sigma |
| A | 6 | 16 | 510864 | 3296.51 | 784 | 771 | 154.7 |
| A | 14 | 235 | 141242 | 907.8 | 784 | 771 | 154.7 |
| A | 12 | 189 | 20354 | 126.56 | 784 | 771 | 154.7 |
| B | 7 | 205 | 187230 | 1305.57 | 776 | 760 | 142.8 |
| B | 10 | 245 | 70261 | 486.61 | 776 | 760 | 142.8 |
| B | 3 | 112 | 51502 | 355.27 | 776 | 760 | 142.8 |
| C | 14 | 238 | 121189 | 691.54 | 756 | 763 | 174.1 |
| C | 2 | 16 | 10926 | 58.36 | 756 | 763 | 174.1 |
| C | 3 | 233 | 7237 | 37.18 | 756 | 763 | 174.1 |
| D | 1 | 52 | 1087945 | 5972.71 | 744 | 727 | 182.0 |
| D | 7 | 38 | 494413 | 2712.1 | 744 | 727 | 182.0 |
| D | 2 | 250 | 164108 | 897.55 | 744 | 727 | 182.0 |
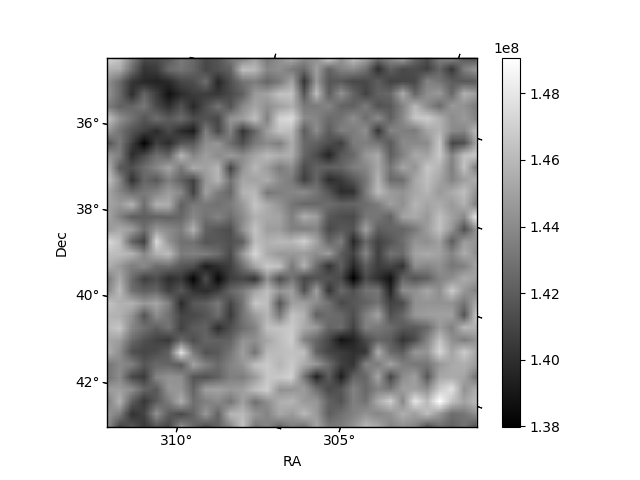
Histogram calculated using DETX and DETY for each event in the final _common_clean file
| Quadrant A | 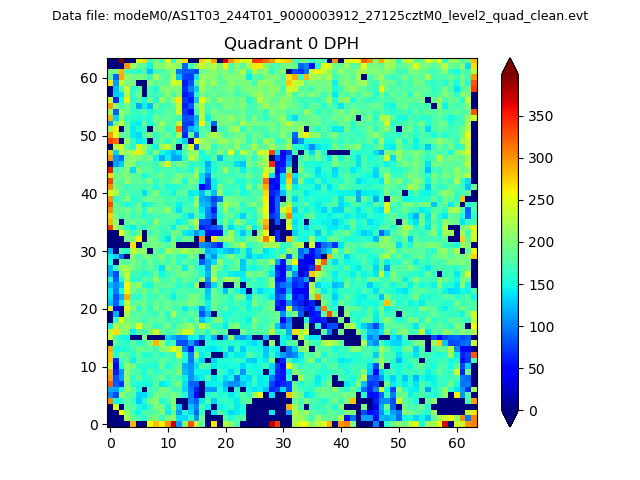 |
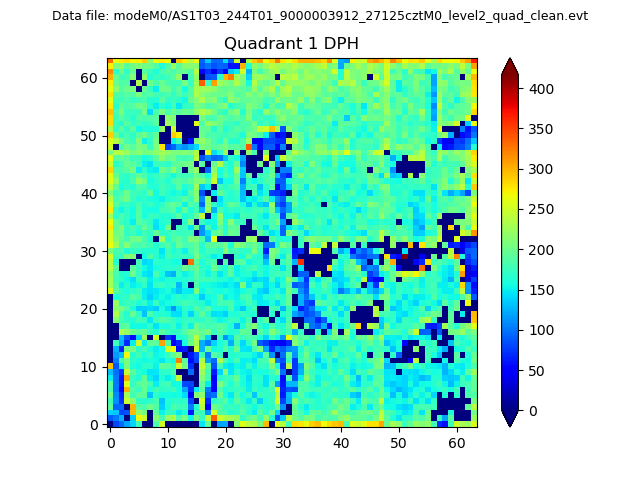 |
Quadrant B |
|---|---|---|---|
| Quadrant D | 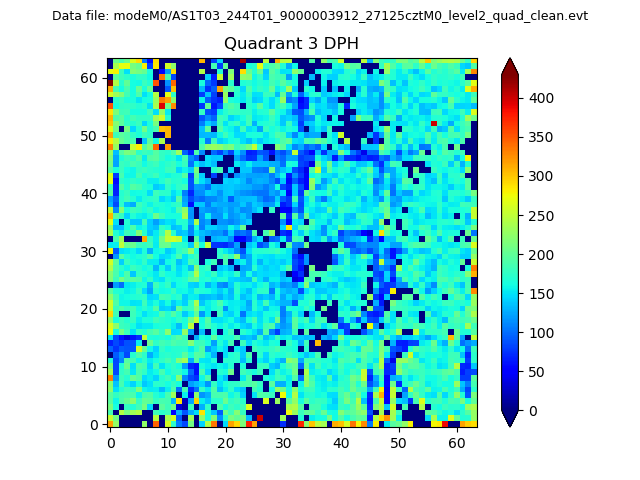 |
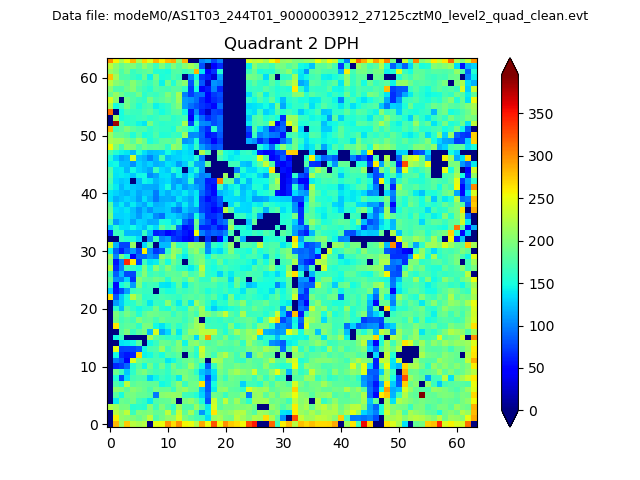 |
Quadrant C |
| Plot type | Count rate plots | Images |
|---|---|---|
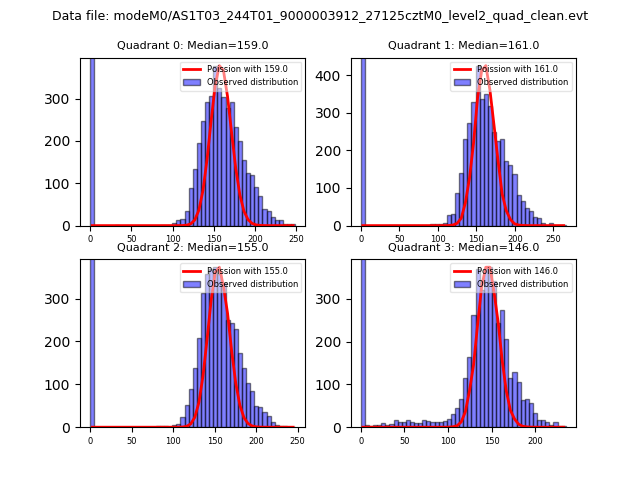
| Comparison with Poisson distribution Blue bars denote a histogram of data divided into 1 sec bins. Red curve is a Poisson curve with rate = median count rate of data. |
 |
 |
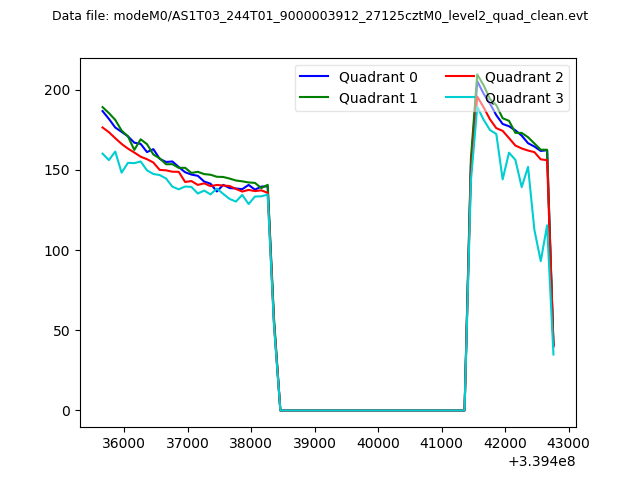
| Quadrant-wise count rates Data is divided into 100 sec bins |
 |
|
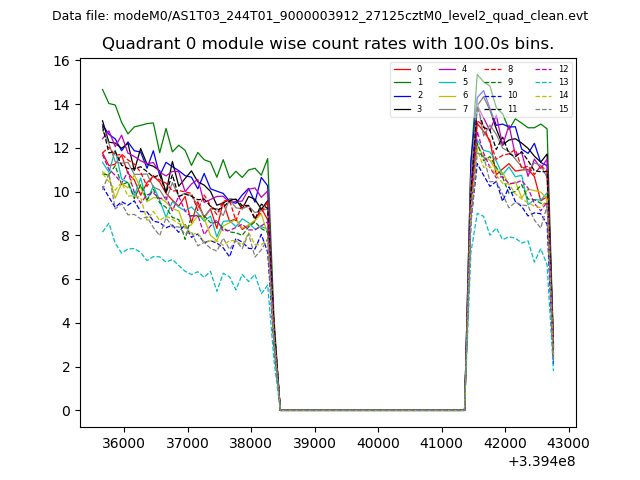
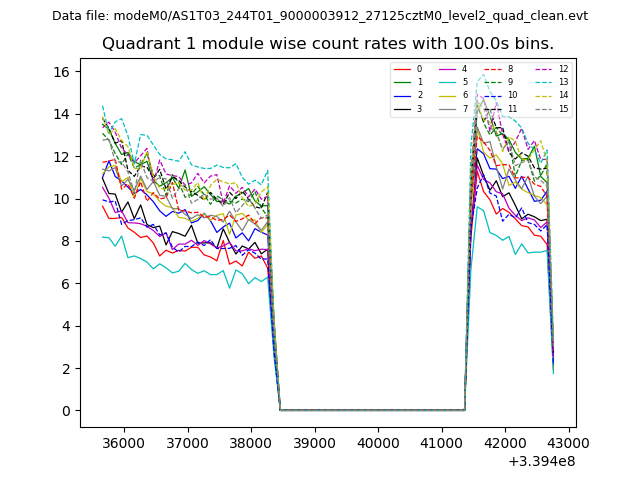
| Module-wise count rates for Quadrant A Data is divided into 100 sec bins |
 |
 |
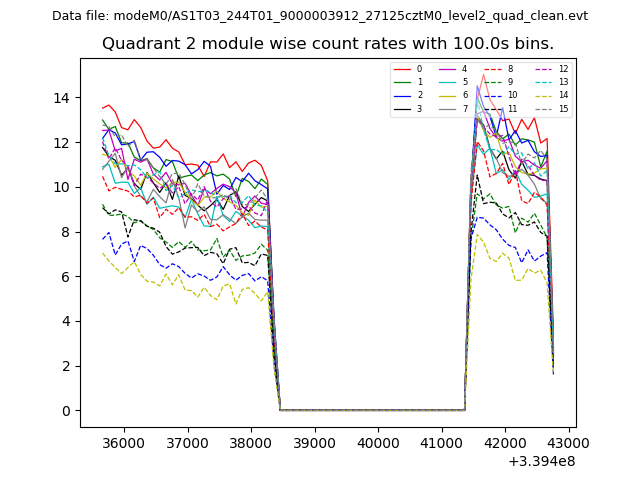
| Module-wise count rates for Quadrant B Data is divided into 100 sec bins |
 |
 |
| Module-wise count rates for Quadrant C Data is divided into 100 sec bins |
 |
 |
| Module-wise count rates for Quadrant D Data is divided into 100 sec bins |
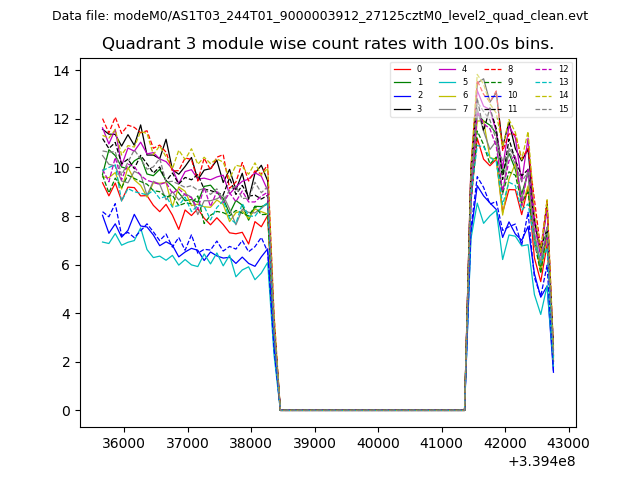 |
 |
| Parameter | Plot |
|---|---|
| CZT HV Monitor | 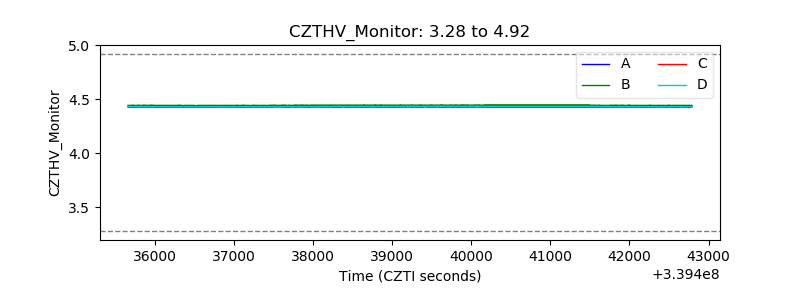 |
| D_VDD | 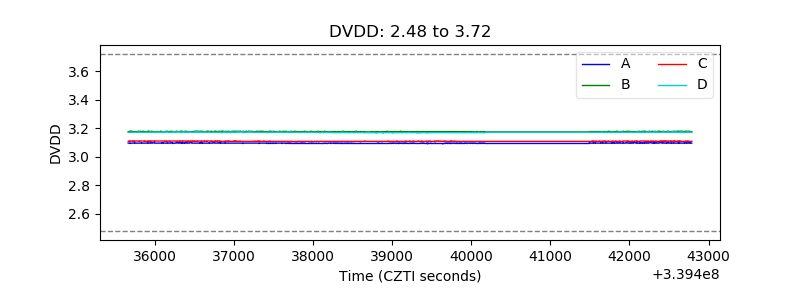 |
| Temperature 1 | 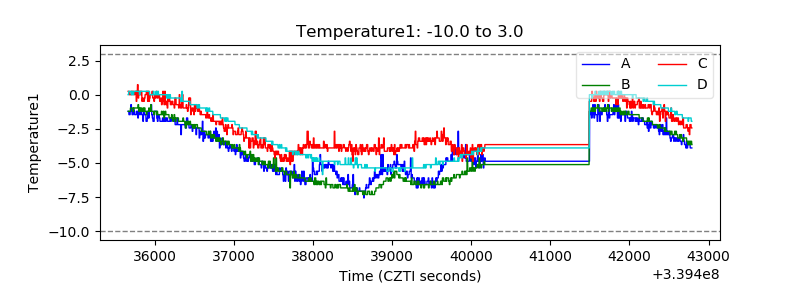 |
| Veto HV Monitor | 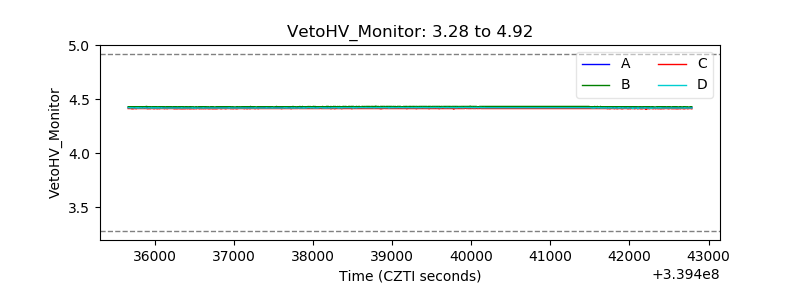 |
| Veto LLD | 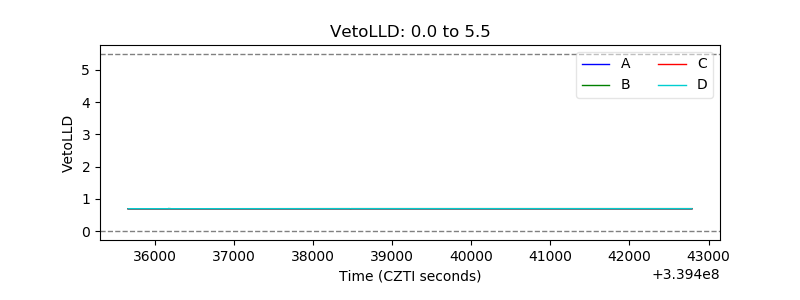 |
| Alpha Counter | 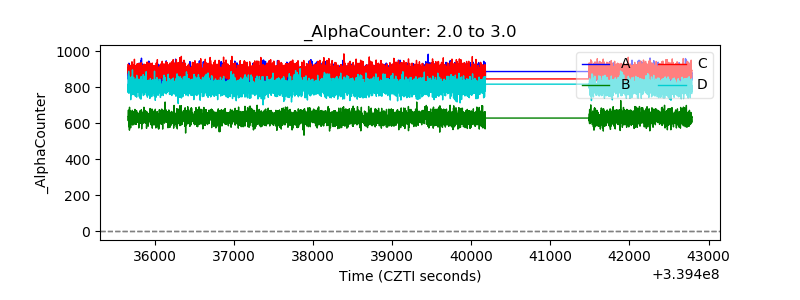 |
| _CPM_Rate |  |
| CZT Counter | 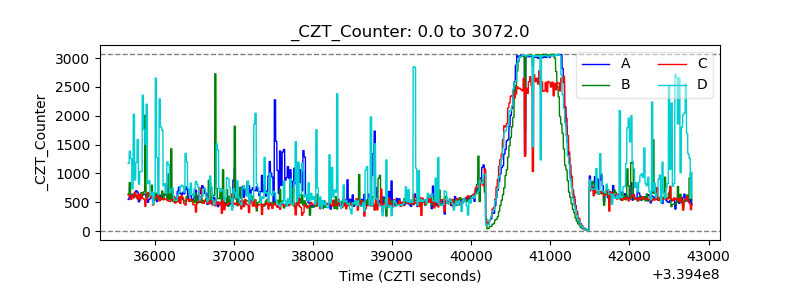 |
| +2.5 Volts monitor |  |
| +5 Volts monitor | 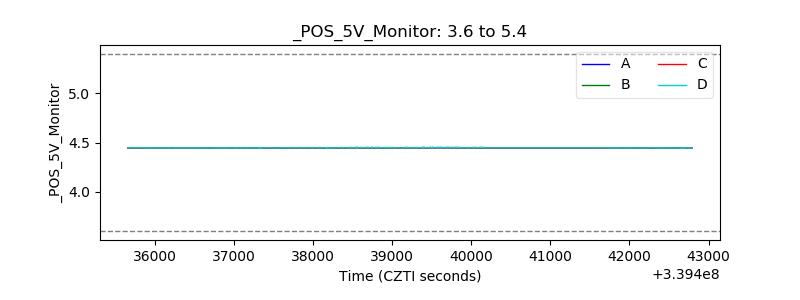 |
| _ROLL_ROT | 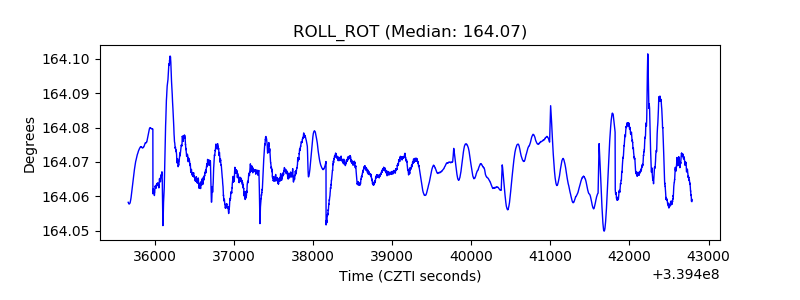 |
| _Roll_DEC | 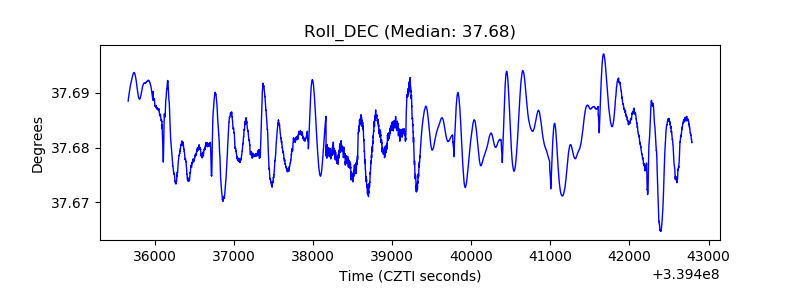 |
| _Roll_RA | 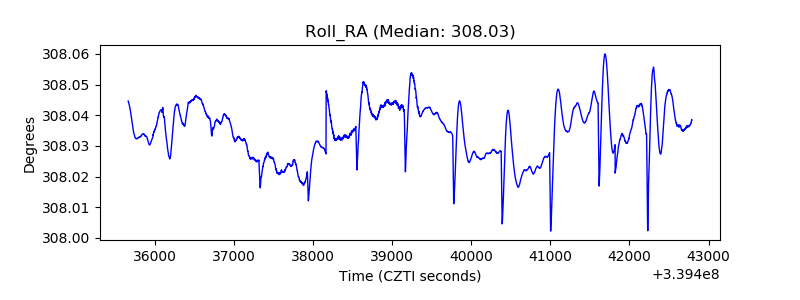 |
| Veto Counter | 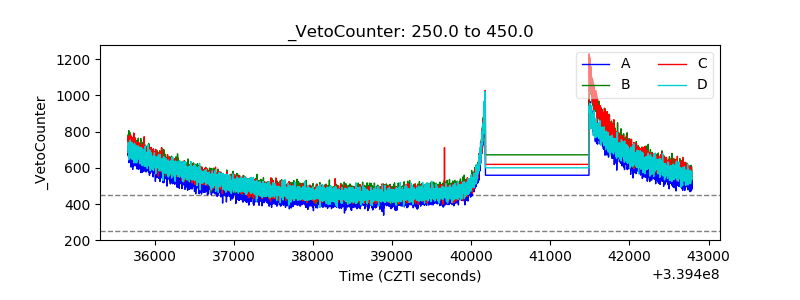 |