| Param | Original file | Final file |
|---|---|---|
| Filename | modeM0/AS1T03_244T01_9000003912_27126cztM0_level2.evt | modeM0/AS1T03_244T01_9000003912_27126cztM0_level2_quad_clean.evt |
| Size (bytes) | 586,961,280 | 98,242,560 |
| Size | 559.8 MB | 93.7 MB |
| Events in quadrant A | 4,199,622 | 658,616 |
| Events in quadrant B | 4,352,526 | 659,961 |
| Events in quadrant C | 3,298,632 | 639,560 |
| Events in quadrant D | 5,508,526 | 586,891 |
| Mode M9 | |||
|---|---|---|---|
| Quadrant | BADHDUFLAG | Total packets | Discarded packets |
| A | 0 | 20 | 0 |
| B | 0 | 21 | 0 |
| C | 0 | 21 | 0 |
| D | 0 | 21 | 0 |
| Mode M0 | |||
|---|---|---|---|
| Quadrant | BADHDUFLAG | Total packets | Discarded packets |
| A | 0 | 16696 | 0 |
| B | 0 | 16840 | 0 |
| C | 0 | 13531 | 0 |
| D | 0 | 20578 | 0 |
| Quadrant | Total seconds | Saturated seconds | Saturation percentage |
|---|---|---|---|
| A | 6165 | 145 | 2.351987% |
| B | 6165 | 350 | 5.677210% |
| C | 6165 | 95 | 1.540957% |
| D | 6164 | 637 | 10.334199% |
Noise dominated data is calculated using 1-second bins in cleaned event files. If a bin has >2000 counts, and if more than 50% of those come from <1% of pixels, then it is considered to be noise-dominated and hence unusable.
| Quadrant | # 1 sec bins | Bins with >0 counts | Bins with >2000 counts | High rate bins dominated by noise | Noise dominated (total time) | Noise dominated (detector-on time) | Marked lightcurve |
|---|---|---|---|---|---|---|---|
| A | 7525 | 6166 | 39 | 39 | 0.52% | 0.63% | 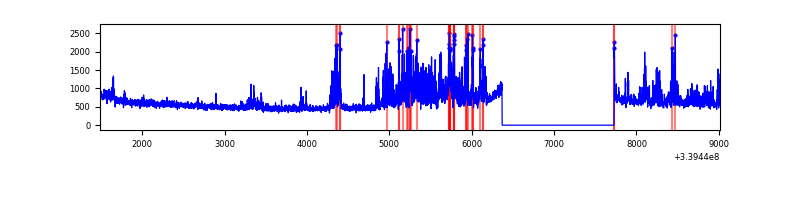 |
| B | 7525 | 6166 | 195 | 195 | 2.59% | 3.16% | 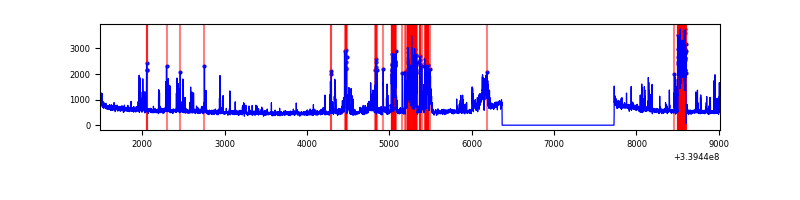 |
| C | 7525 | 6166 | 1 | 1 | 0.01% | 0.02% | 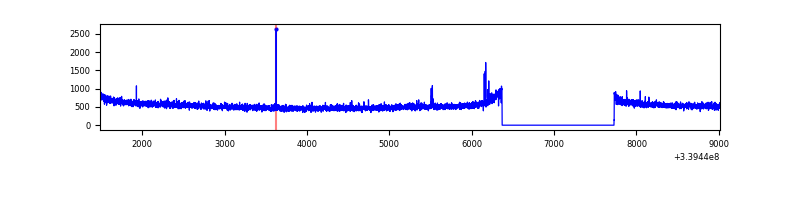 |
| D | 7524 | 6165 | 541 | 541 | 7.19% | 8.78% | 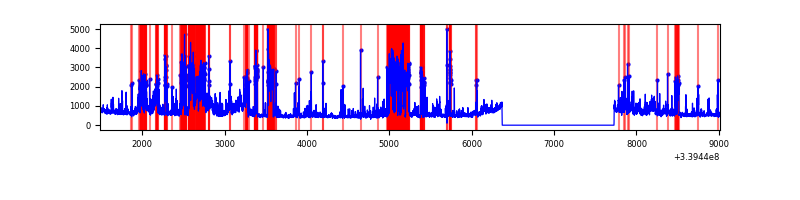 |
Top three noisy pixels from each quadrant. If the there are fewer than three noisy pixels in the level2.evt file, extra rows are filled as -1
| Pixel properties | Quadrant properties | ||||||
|---|---|---|---|---|---|---|---|
| Quadrant | DetID | PixID | Counts | Sigma | Mean | Median | Sigma |
| A | 6 | 16 | 673240 | 4142.11 | 830 | 814 | 162.3 |
| A | 14 | 235 | 269462 | 1654.86 | 830 | 814 | 162.3 |
| A | 13 | 248 | 24730 | 147.32 | 830 | 814 | 162.3 |
| B | 10 | 245 | 894590 | 5950.55 | 814 | 795 | 150.2 |
| B | 7 | 205 | 135570 | 897.28 | 814 | 795 | 150.2 |
| B | 0 | 189 | 42786 | 279.56 | 814 | 795 | 150.2 |
| C | 14 | 238 | 130180 | 696.31 | 806 | 814 | 185.8 |
| C | 15 | 208 | 20116 | 103.89 | 806 | 814 | 185.8 |
| C | 13 | 61 | 5428 | 24.83 | 806 | 814 | 185.8 |
| D | 1 | 52 | 1829463 | 9099.82 | 768 | 757 | 201.0 |
| D | 7 | 38 | 527240 | 2619.83 | 768 | 757 | 201.0 |
| D | 2 | 250 | 132254 | 654.34 | 768 | 757 | 201.0 |
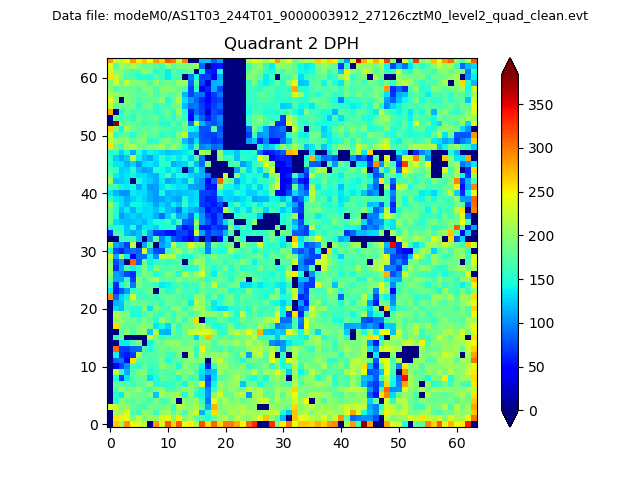
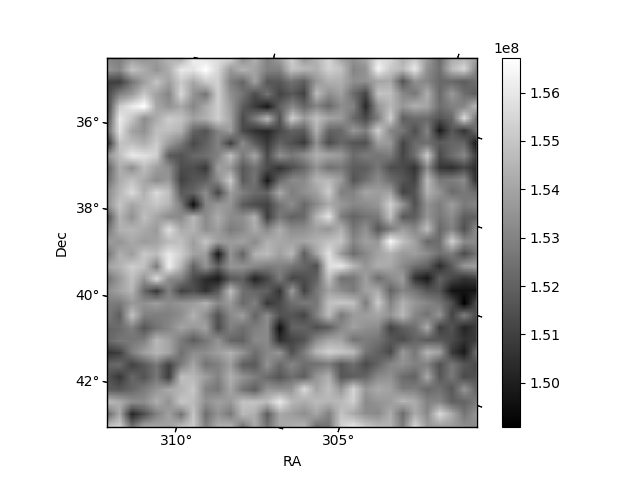
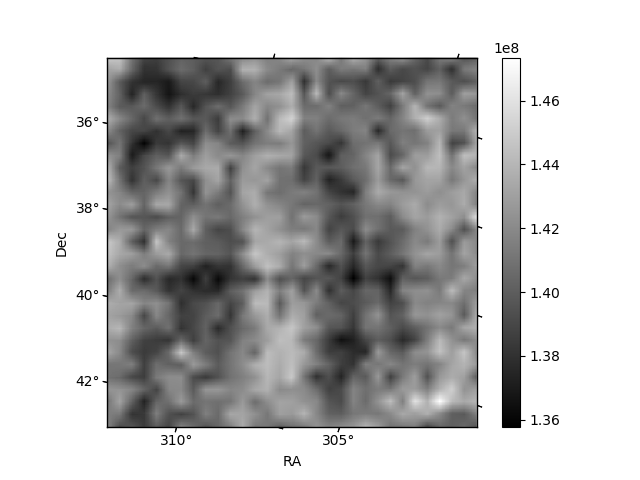
Histogram calculated using DETX and DETY for each event in the final _common_clean file
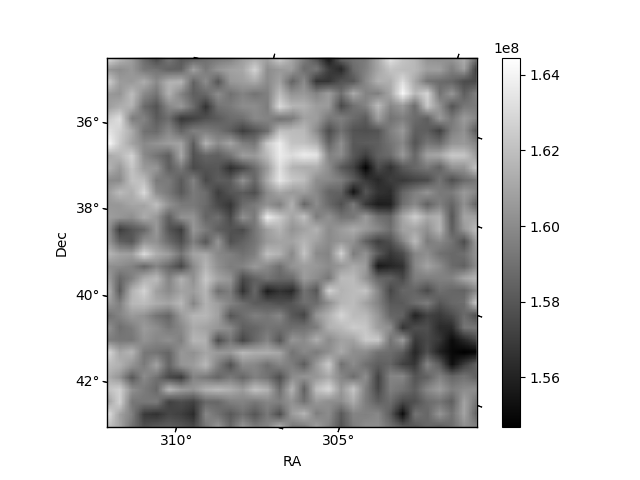
| Quadrant A | 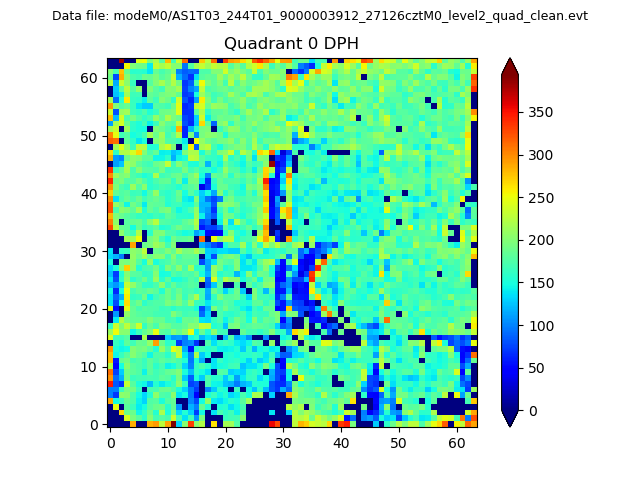 |
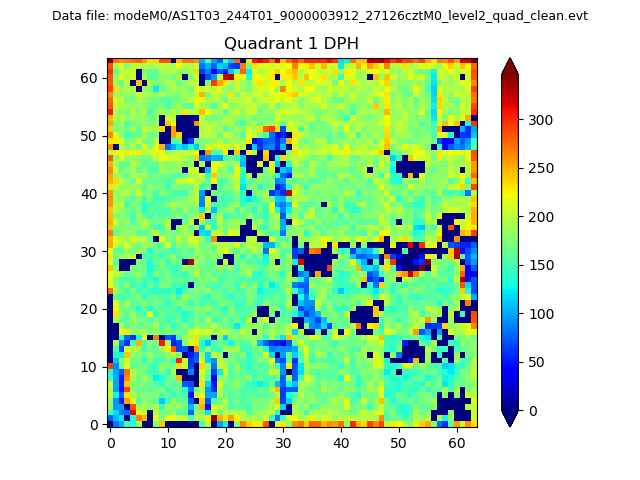 |
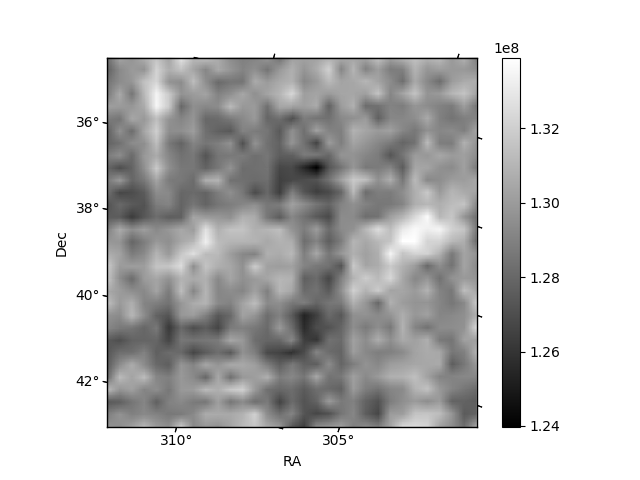
Quadrant B |
|---|---|---|---|
| Quadrant D | 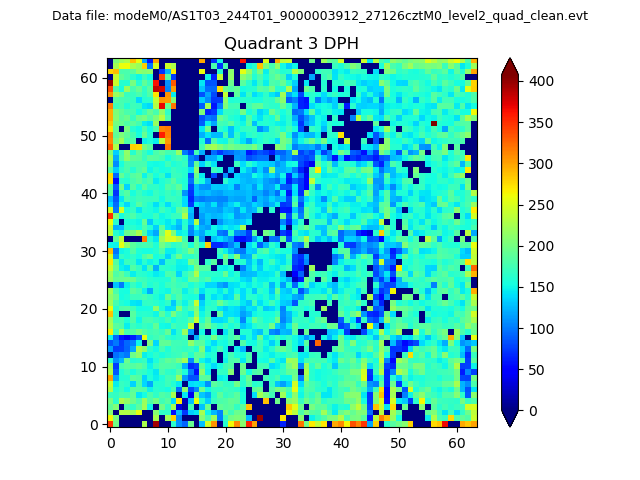 |
 |
Quadrant C |
| Plot type | Count rate plots | Images |
|---|---|---|
| Comparison with Poisson distribution Blue bars denote a histogram of data divided into 1 sec bins. Red curve is a Poisson curve with rate = median count rate of data. |
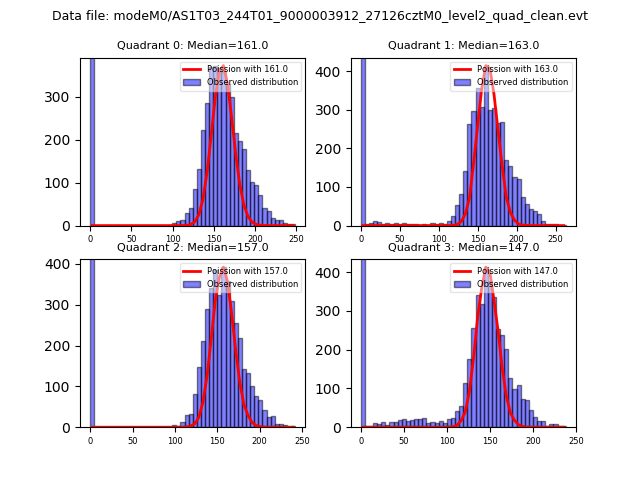 |
 |
| Quadrant-wise count rates Data is divided into 100 sec bins |
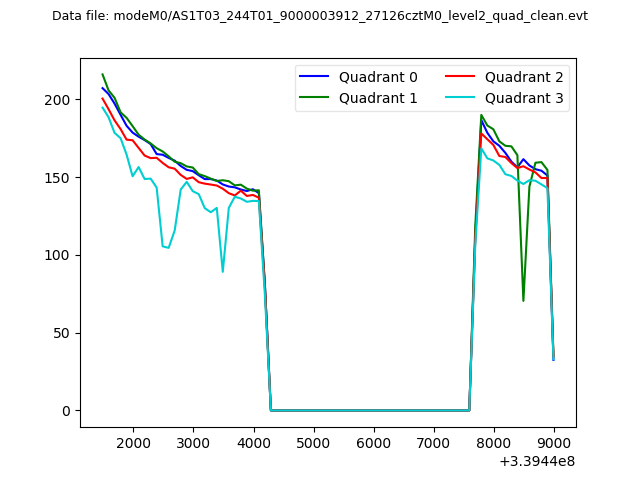 |
|
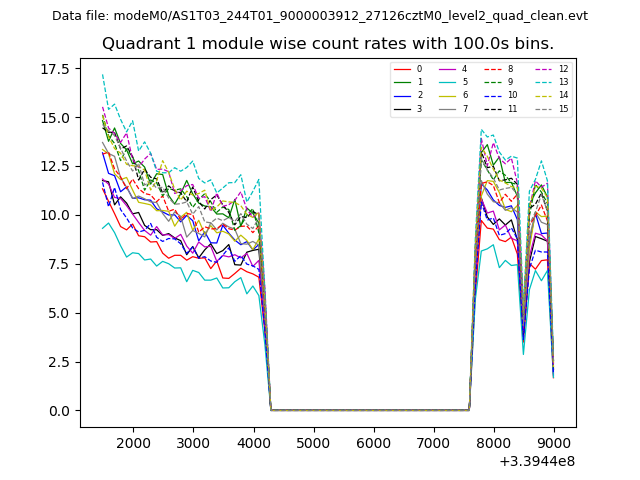
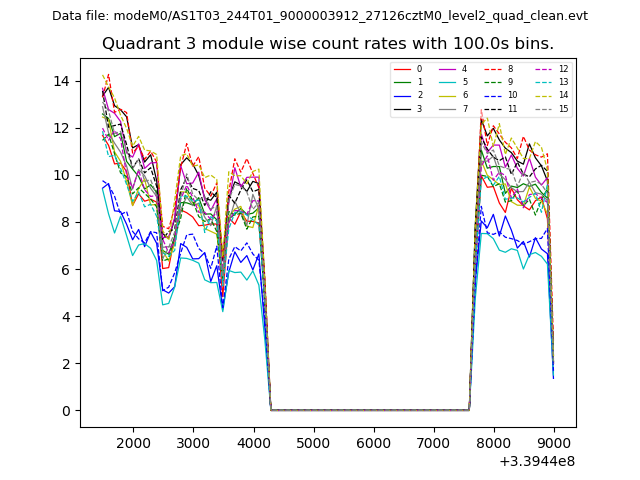
| Module-wise count rates for Quadrant A Data is divided into 100 sec bins |
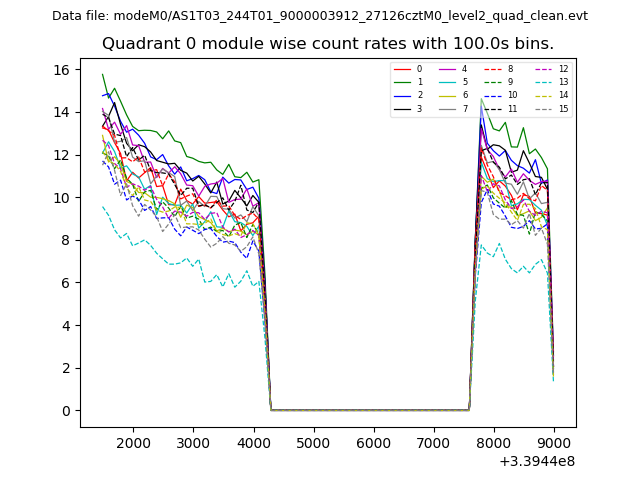 |
 |
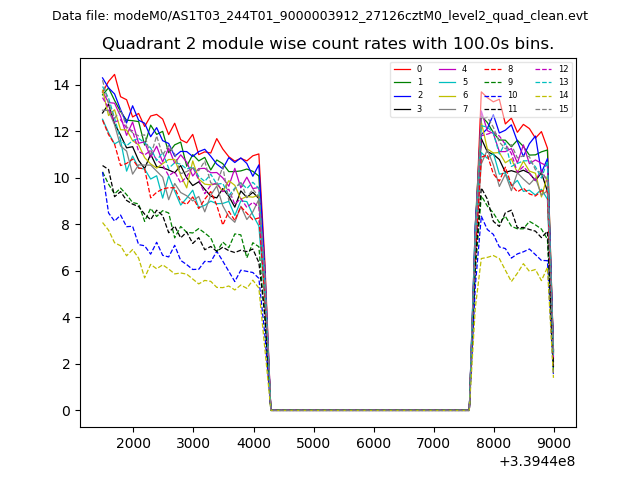
| Module-wise count rates for Quadrant B Data is divided into 100 sec bins |
 |
 |
| Module-wise count rates for Quadrant C Data is divided into 100 sec bins |
 |
 |
| Module-wise count rates for Quadrant D Data is divided into 100 sec bins |
 |
 |
| Parameter | Plot |
|---|---|
| CZT HV Monitor | 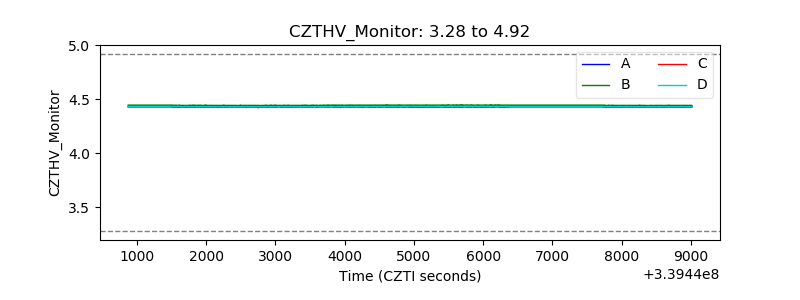 |
| D_VDD | 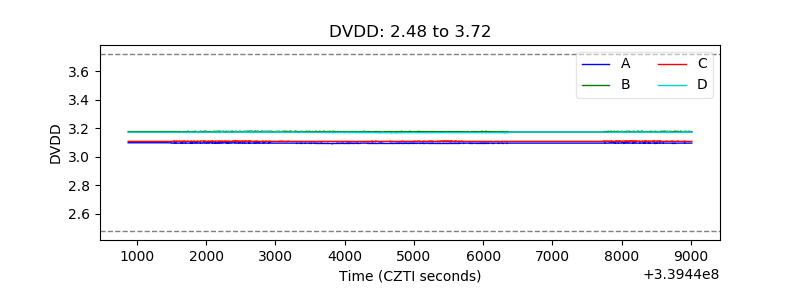 |
| Temperature 1 | 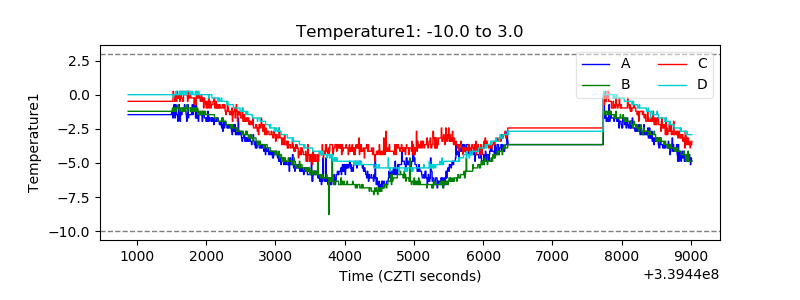 |
| Veto HV Monitor | 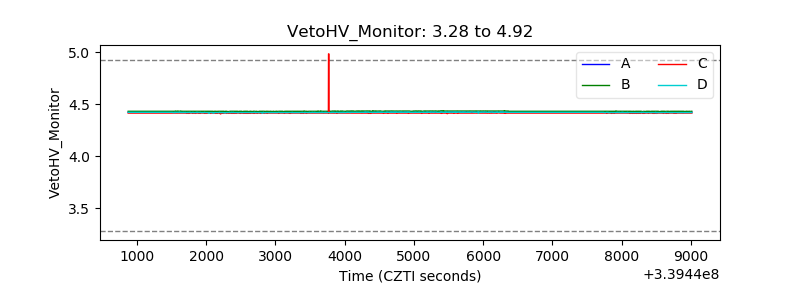 |
| Veto LLD | 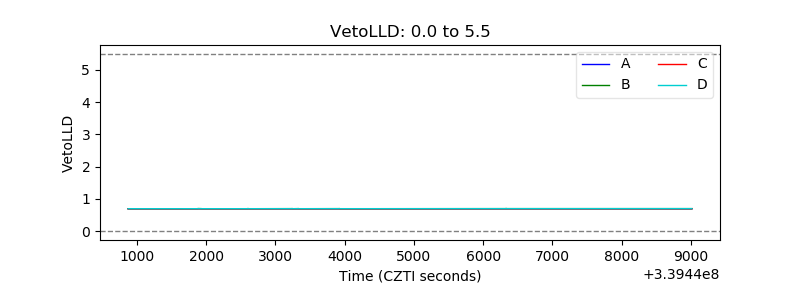 |
| Alpha Counter |  |
| _CPM_Rate | 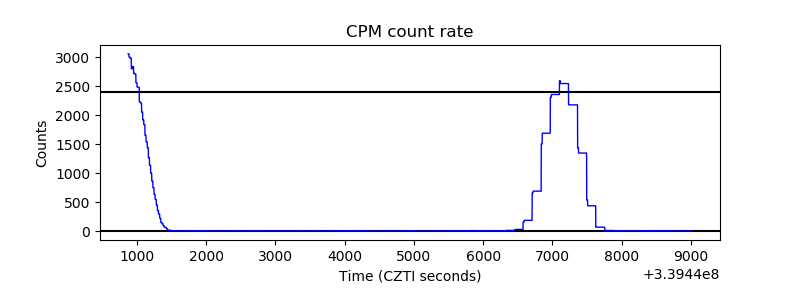 |
| CZT Counter | 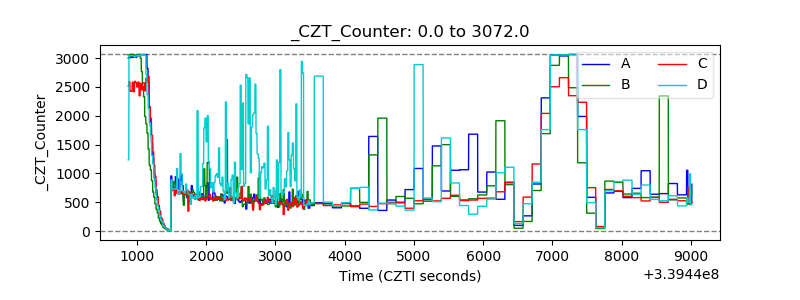 |
| +2.5 Volts monitor | 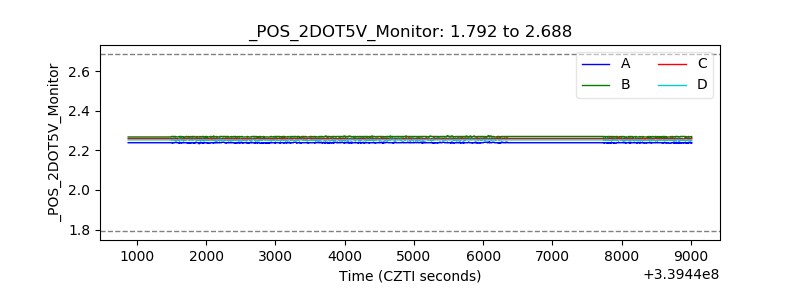 |
| +5 Volts monitor | 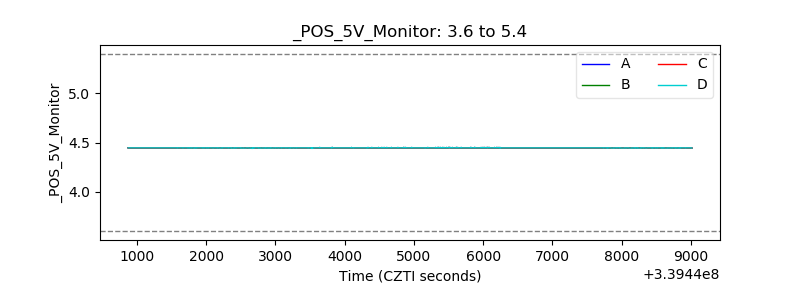 |
| _ROLL_ROT | 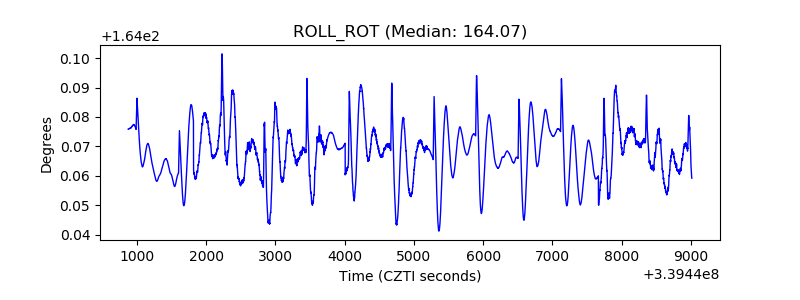 |
| _Roll_DEC | 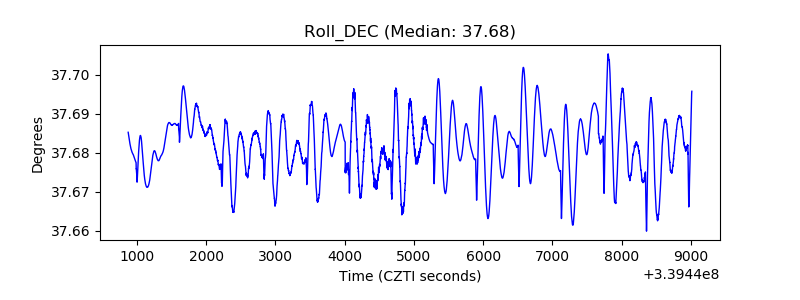 |
| _Roll_RA | 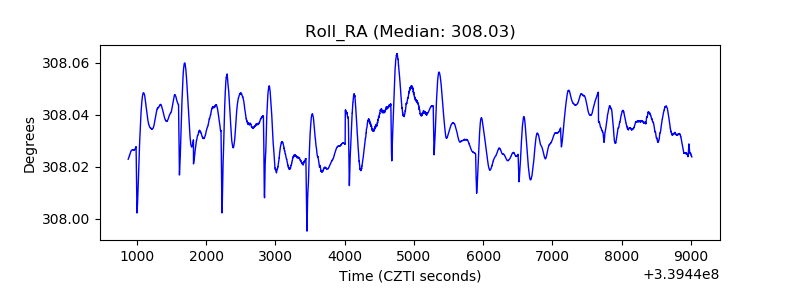 |
| Veto Counter | 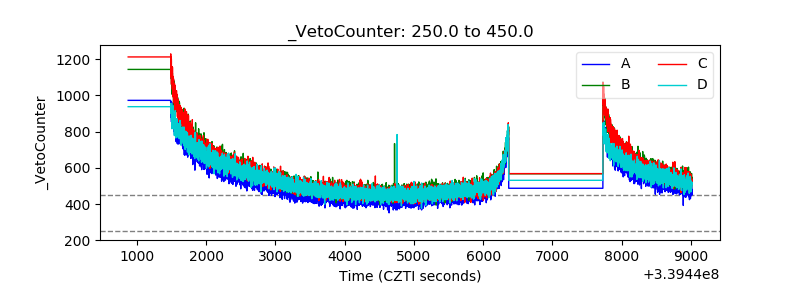 |